Bigtable Monitoring: Client-side metrics
Mattie Fu
Software Engineer, Cloud Bigtable
Billy Jacobson
Developer Advocate, Cloud Bigtable
Cloud Bigtable is a NoSQL database service that can achieve single-digit millisecond latency for reads and writes. However, if you're developing applications with complex infrastructure, global customers and millions of interactions, there is potential for unexpected latency. Latency in large scale systems can cause missed business opportunities, poor customer experiences, and disrupted data pipelines.
Because Bigtable is a managed service, you can monitor its resources with several real time dashboards and tools. You'll see throughput, resource utilization, error rates, and more, which will help you quickly deploy, debug and recognize issues. We have added several new client-side metrics as part of the Bigtable client libraries for Java to improve the monitoring experience. Based on common support questions, we identified metrics to increase the transparency of the entire remote procedure call (RPC.) Now, you can find out more quickly whether latency is coming from issues on your end – like from a new feature or an anti-pattern in your code – or if service downtime is causing the issues and needs escalation.
In this blog post, we'll look at how to get deeper insights into your applications with the new Bigtable client-side metrics. Then we will examine a few scenarios to learn how to debug and address the issues with the metrics.
Understanding the new metrics
There are eight new metrics available when you use either the Bigtable client library for Java or the HBase client available for customers migrating from HBase. Most of the metrics are data points that will provide valuable transparency into your system.
Previously, you may have been able to see the overall latency of a request but couldn't investigate the individual layers of it, which made debugging some scenarios difficult. Now, you can quickly identify a variety of issues on your own and reach out to Support with more informed questions if needed.
The diagram below shows a simplified request lifecycle. Each of the new metrics are labeled, so you can see which layer of the request it is measuring. The lifecycle begins with a client application making a request to the Google frontend, which gets routed to the Cloud Bigtable server. If the request receives a retryable error, the client schedules a retry and resends the request.
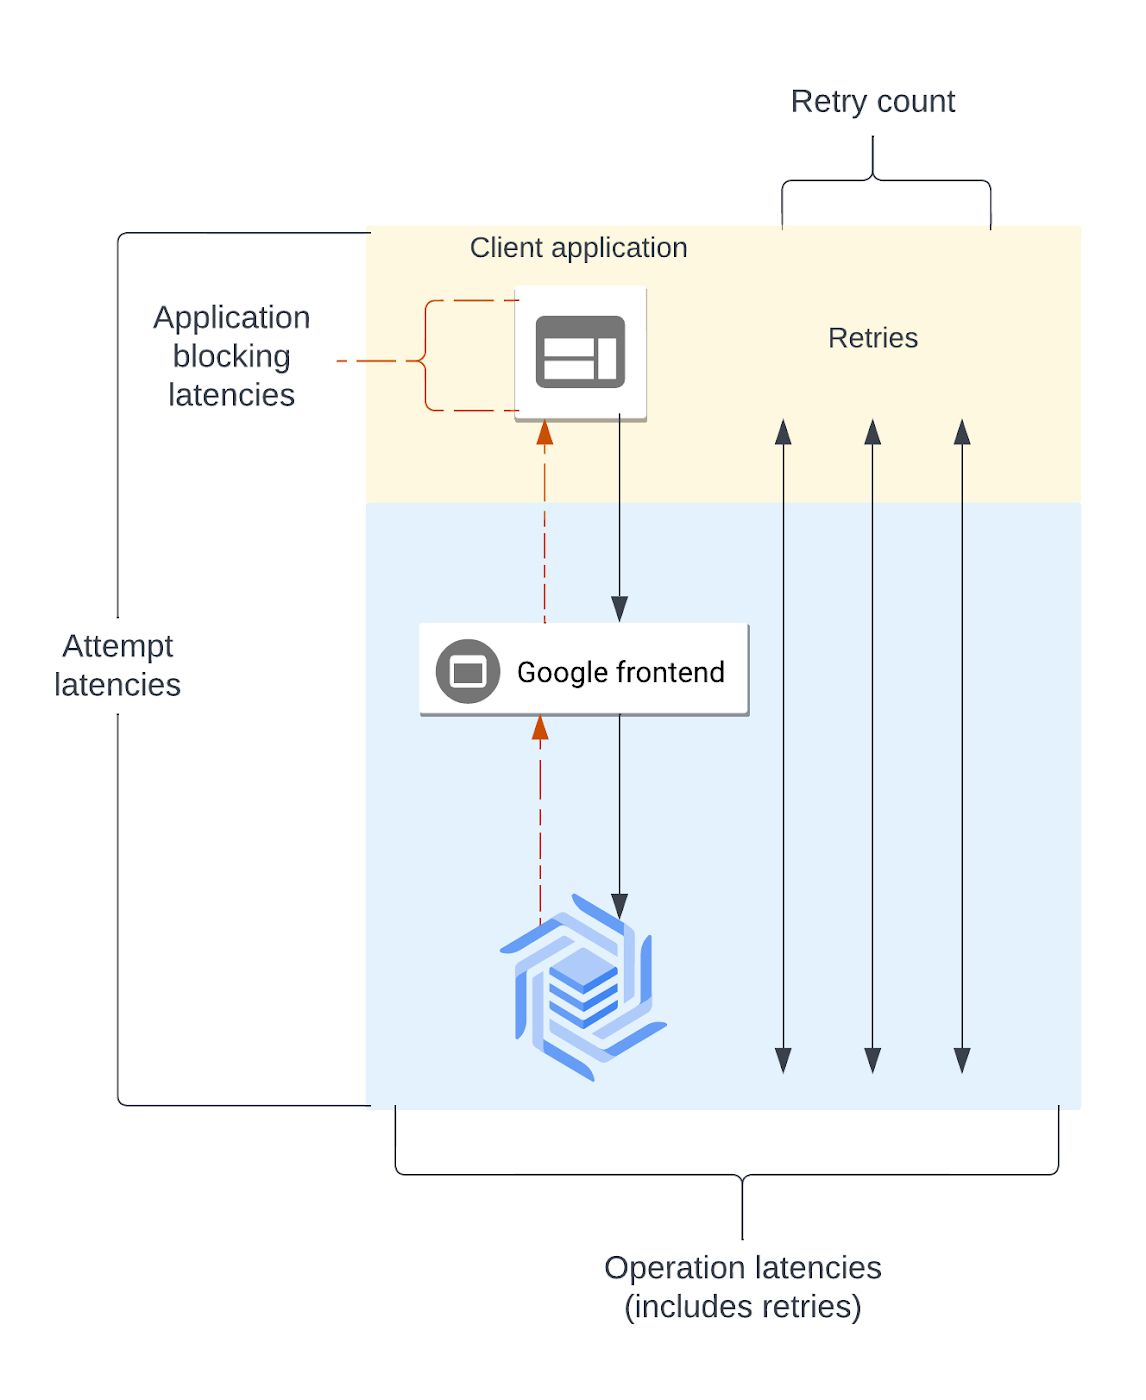
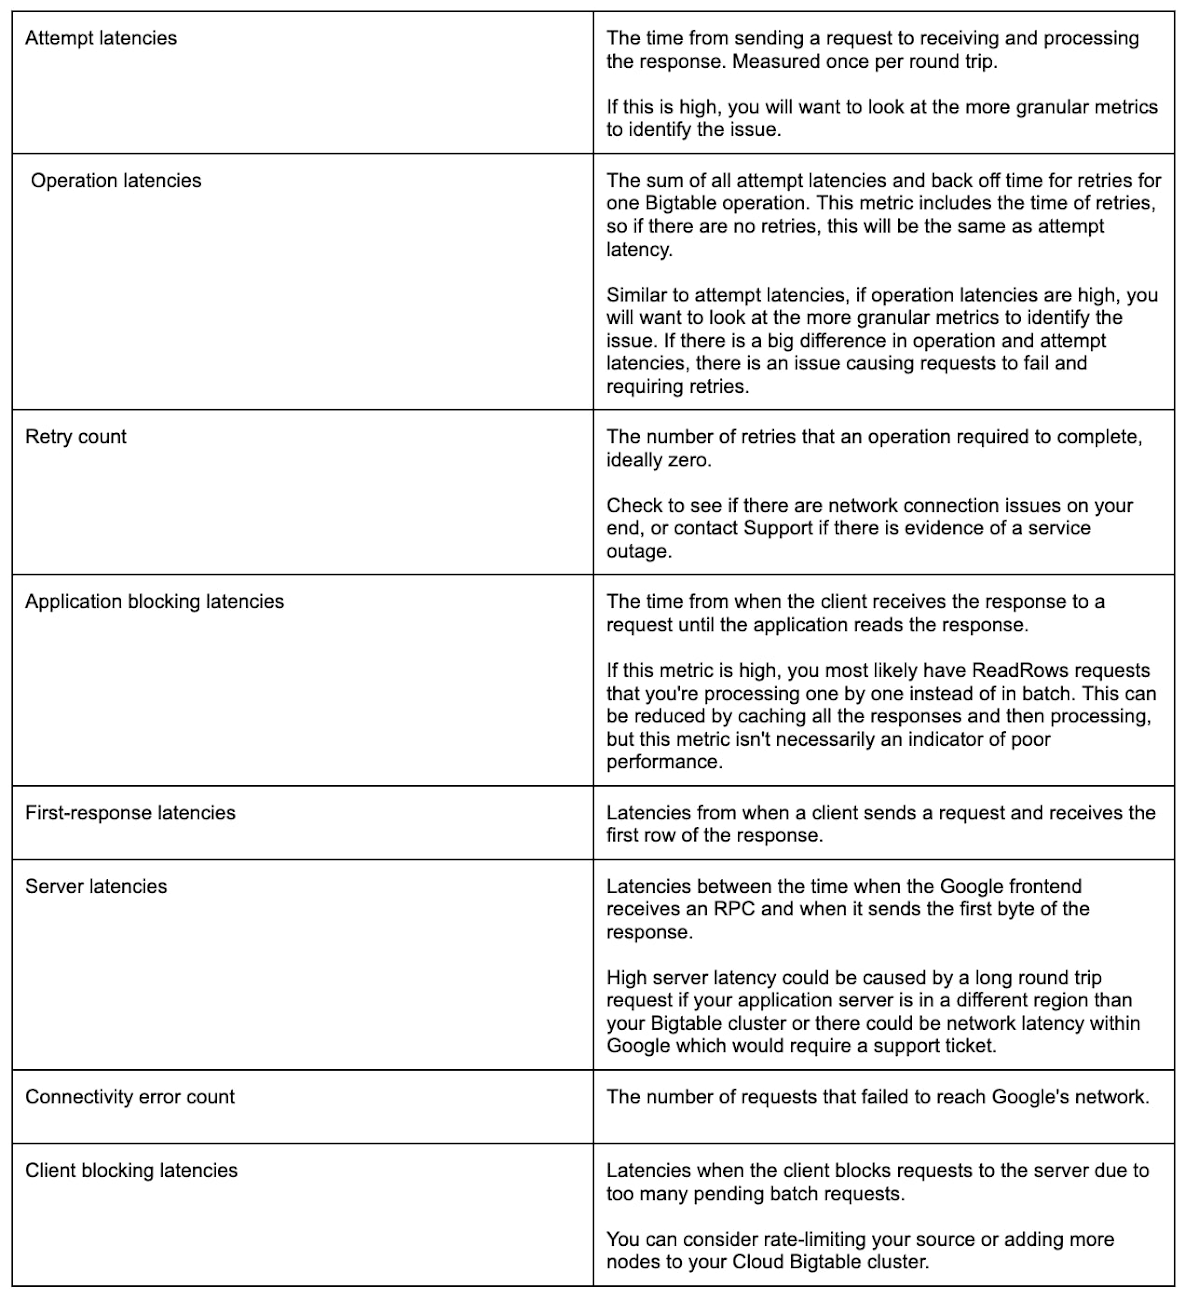
If you can identify where the latency is coming from, then you'll have some clear steps to begin troubleshooting. There are full descriptions of each metric available in the Cloud Bigtable documentation, so use this quick reference to get started:
Client-side Metric Setup
To enable the new client-side metrics in your Java client, follow the steps in the Cloud Bigtable documentation. The change to your code just needs to be added wherever your code connects to the Bigtable client.
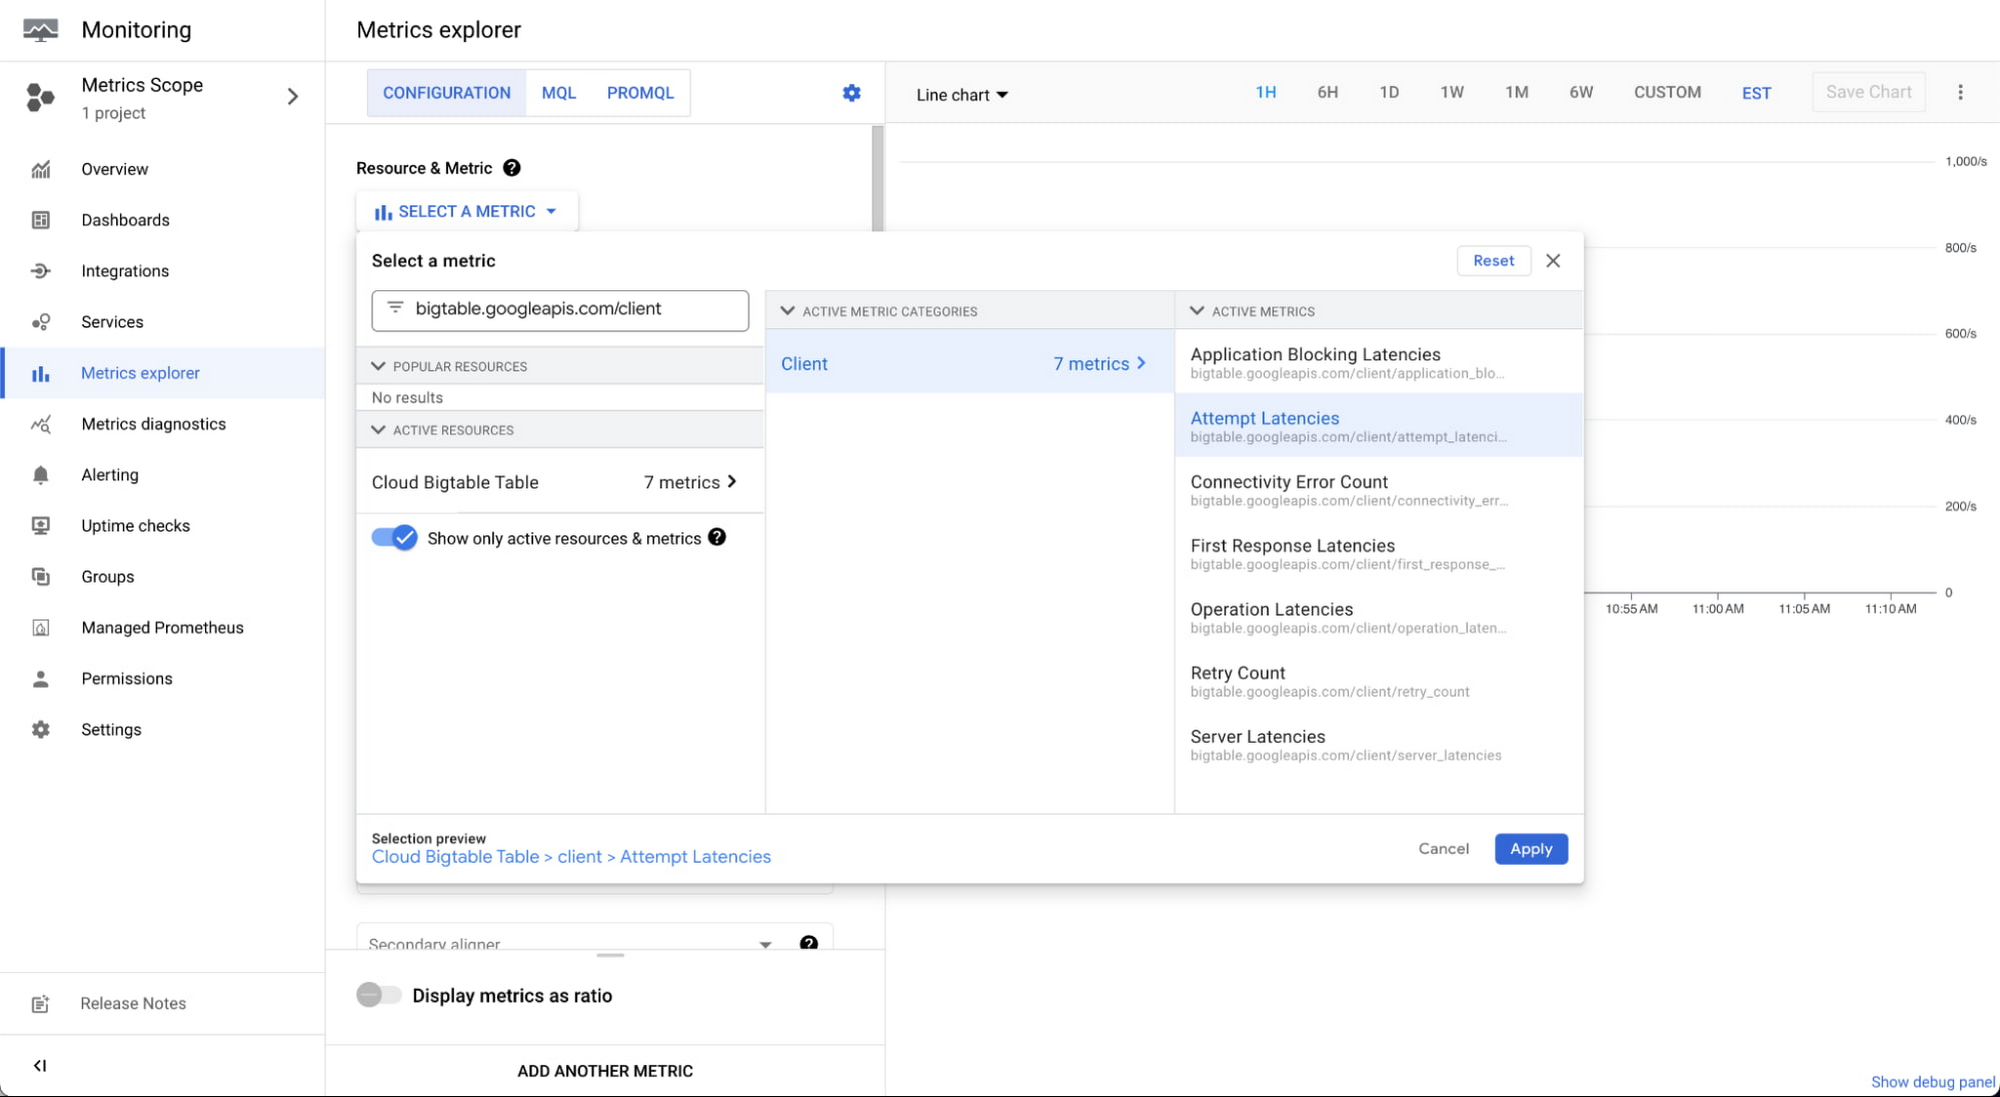
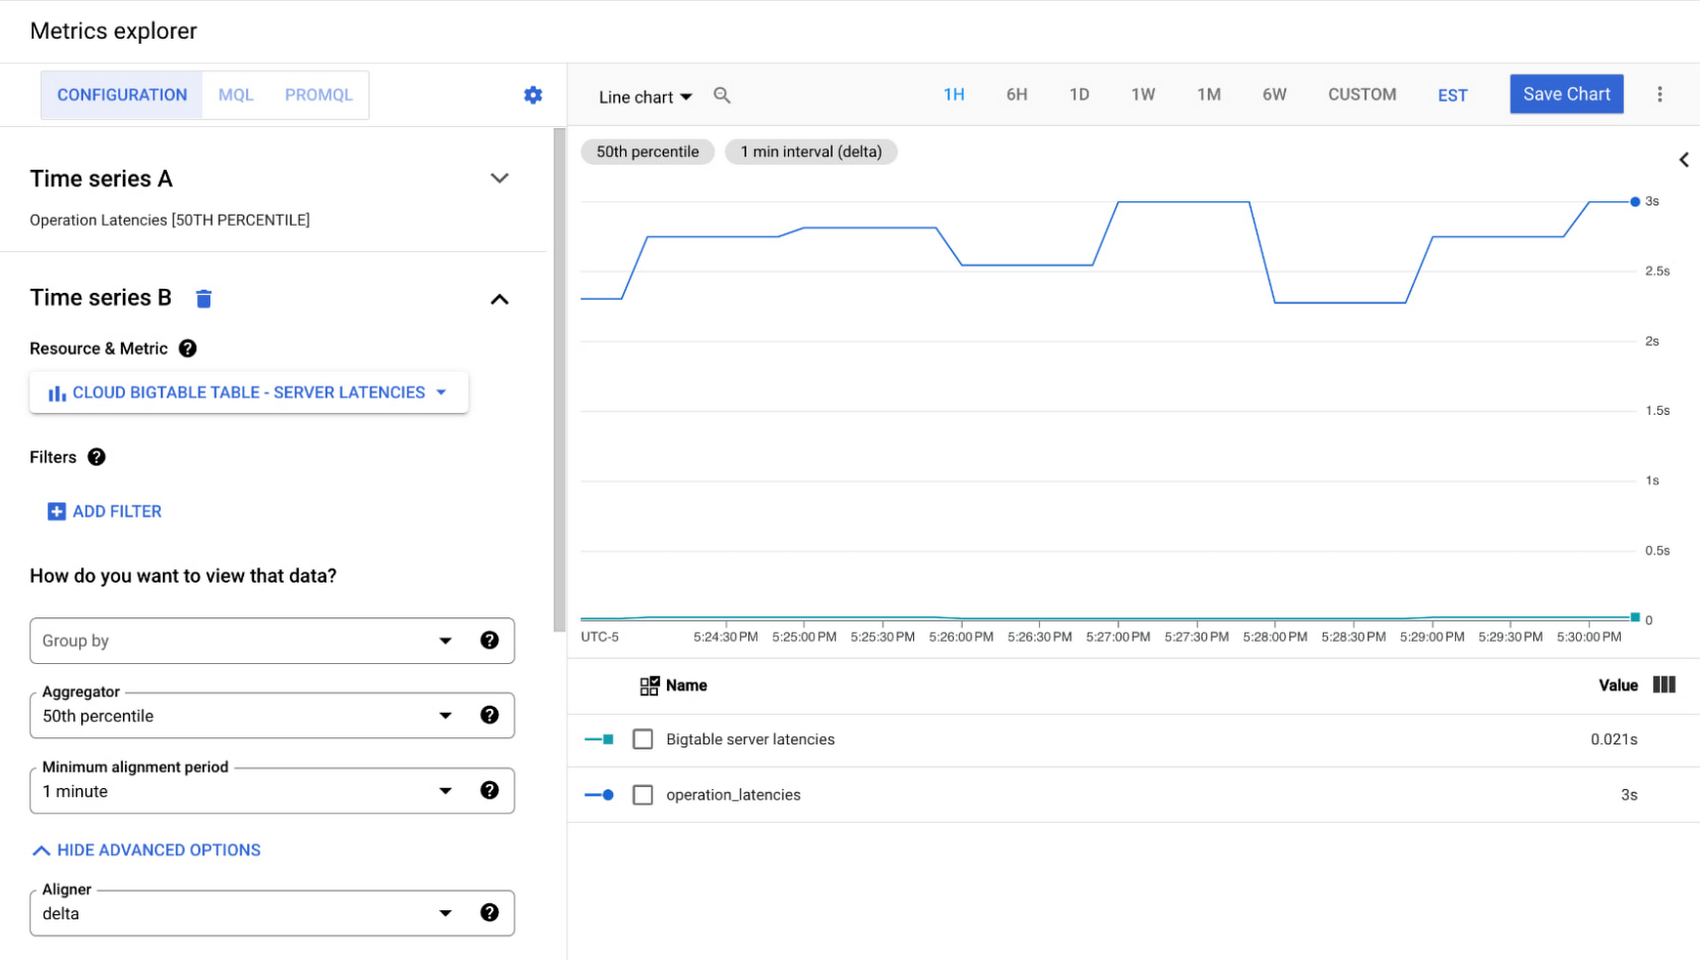
After 15 minutes, the new metrics will be accessible via the Cloud Monitoring UI and the Cloud Monitoring API. We'll look at the metrics via the Cloud Console in the Metrics Explorer.
Using the metric selector, search for bigtable.googleapis.com/client to find the client-side metrics.
You can view additional metrics in one graph by clicking "add another metric" at the bottom. You can also create a dashboard with each metric by clicking "save chart" and adding the chart to your dashboard. We have an example dashboard available in a JSON file and instructions for how to upload and install it to the Metrics Explorer. This example shows all the new metrics in a dashboard that you can customize.
Debugging common problems
As we've explored, there are a variety of reasons latency could be different than expected. Let's look at three examples of high latency exposed by the client-side metrics, their cause and how to fix them.
High attempt latency: Incorrectly sized channel pool
Our first application is doing very low queries per second (QPS) reading from Bigtable with around one request per second. Perhaps this is a dashboard that reads large amounts of data per request, but isn't receiving frequent throughput traffic.
The latency graph looks like this:
The operation latencies are above 3 seconds or 3000 ms, but the Bigtable server latencies are all less than 25ms, so I know my query isn't causing any issues and something else might be going wrong here. We can look at our custom Bigtable client-side metrics dashboard which contains retry count and connectivity error for more context.
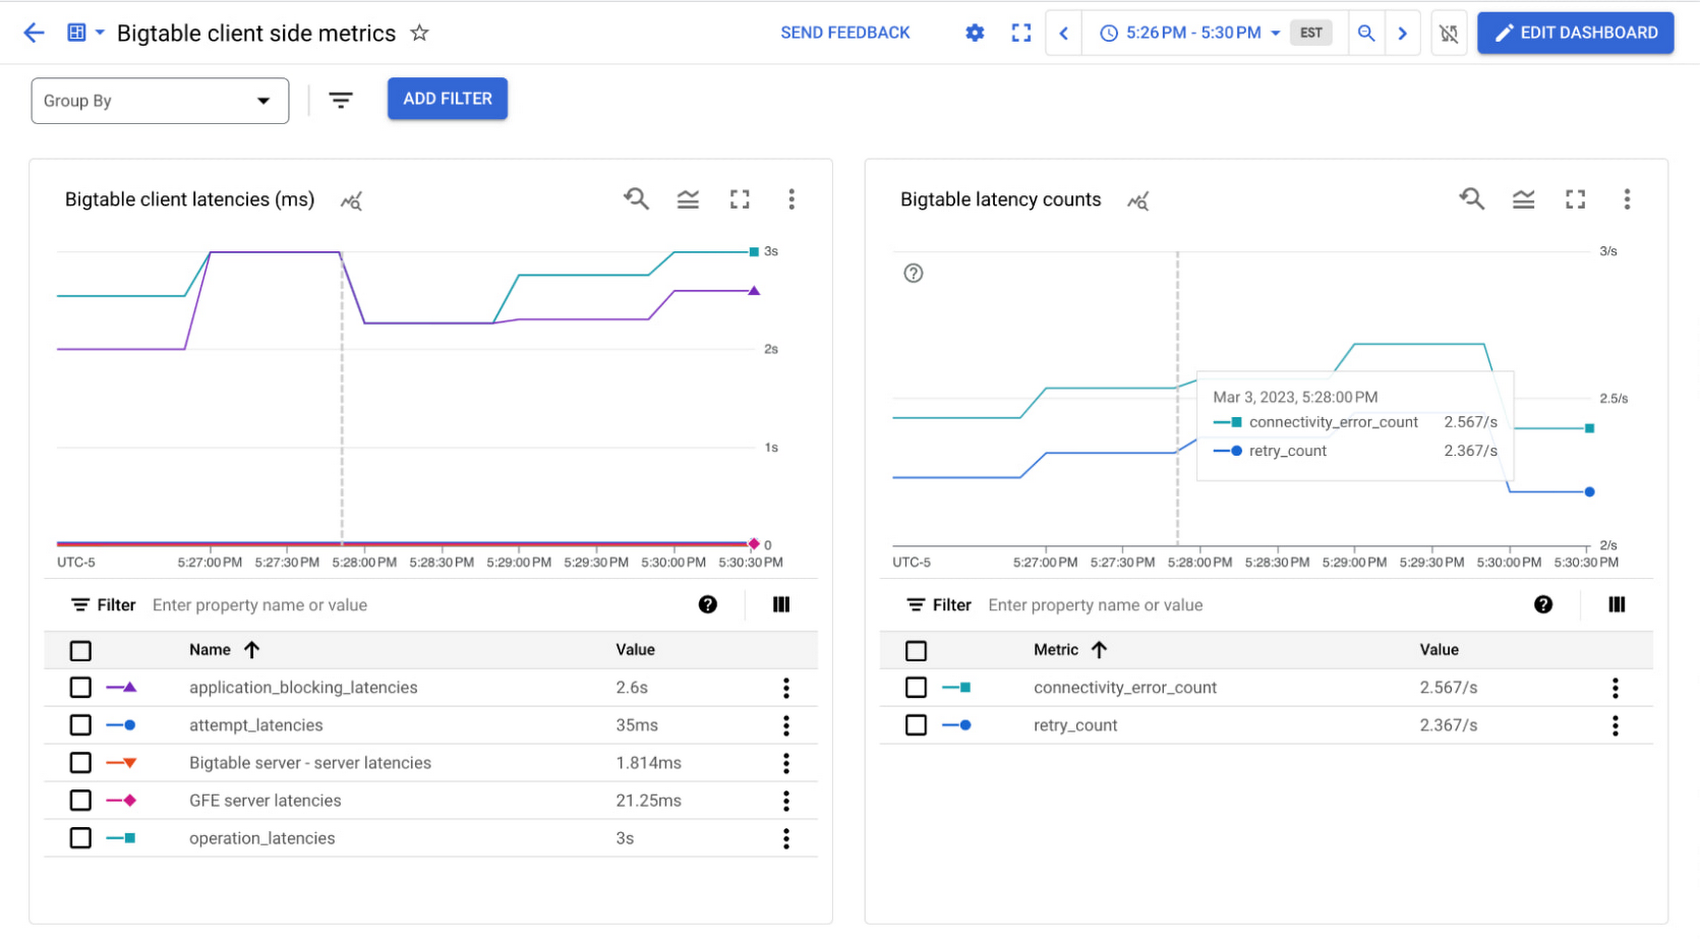
The retry count metric shows that the requests are being retried multiple times. There are also thousands of connectivity errors per minute, indicating that something is wrong with my connection.
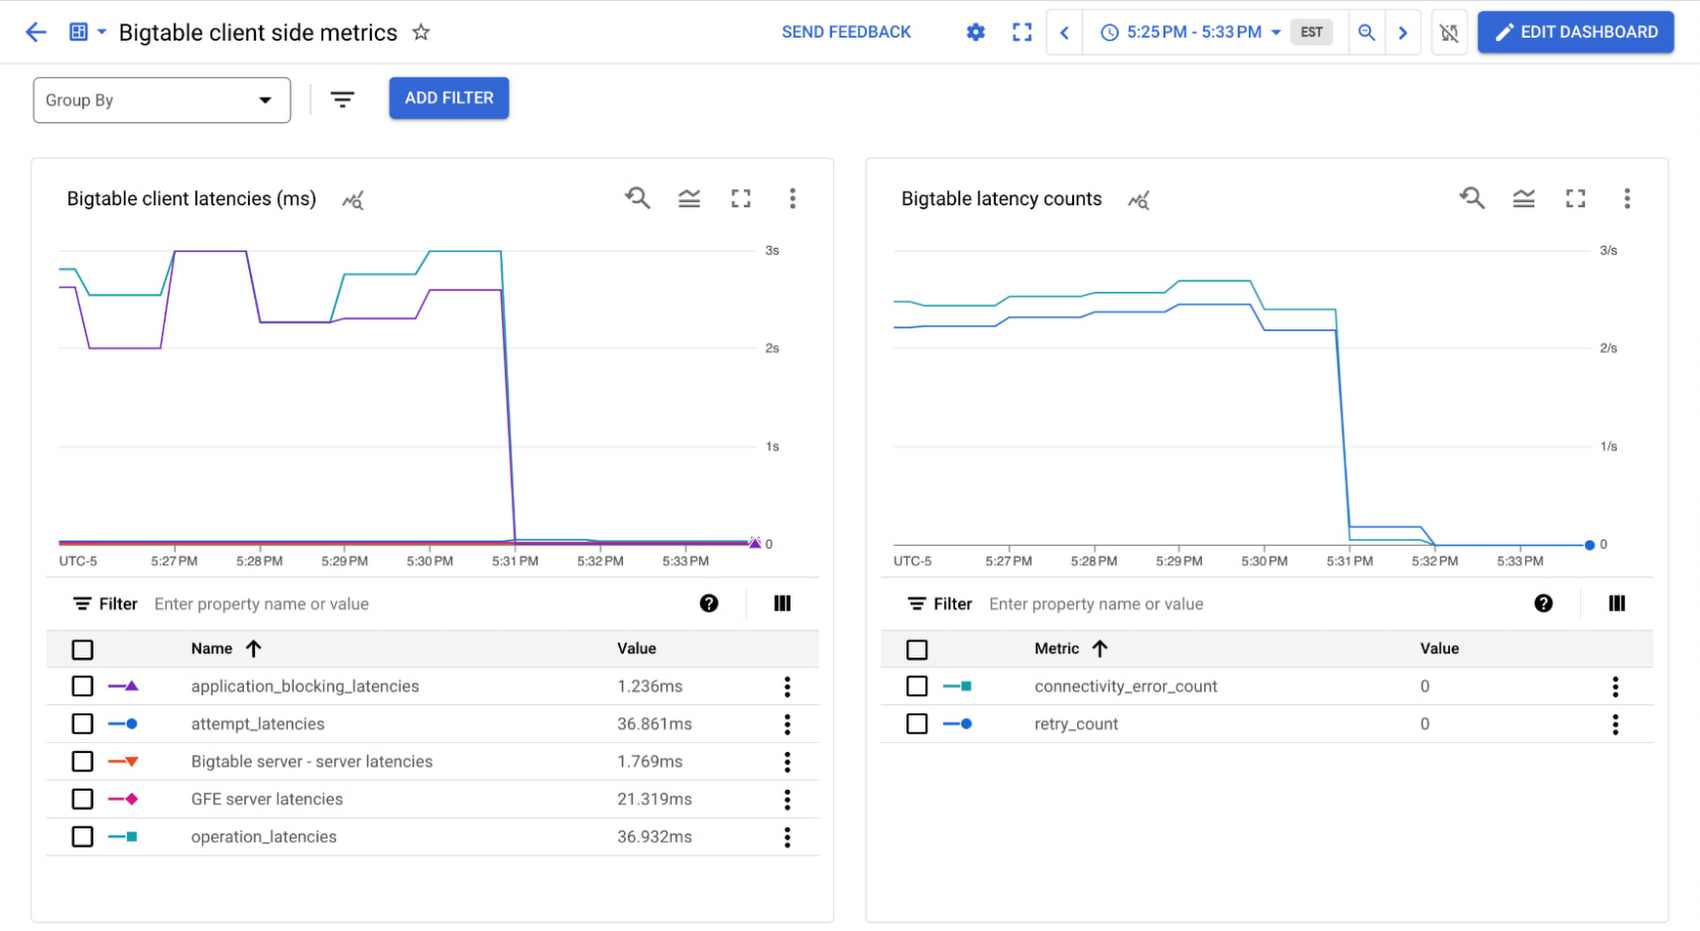
Thankfully, this is a simple fix in this scenario – after reading about connection pools in the documentation, we realize that we need to change the default settings since this is a low-throughput scenario. The idle channels are getting disconnected, and constantly reestablishing the connections is causing the high latencies. We can calculate and set the appropriate size channel pool (a minimum of two channels is recommended) and see the low latency as expected.
High application blocking latency: Processing live read row stream
In another application, perhaps we are doing a prefix scan over several rows and processing each of them. A snippet of the code looks like this:
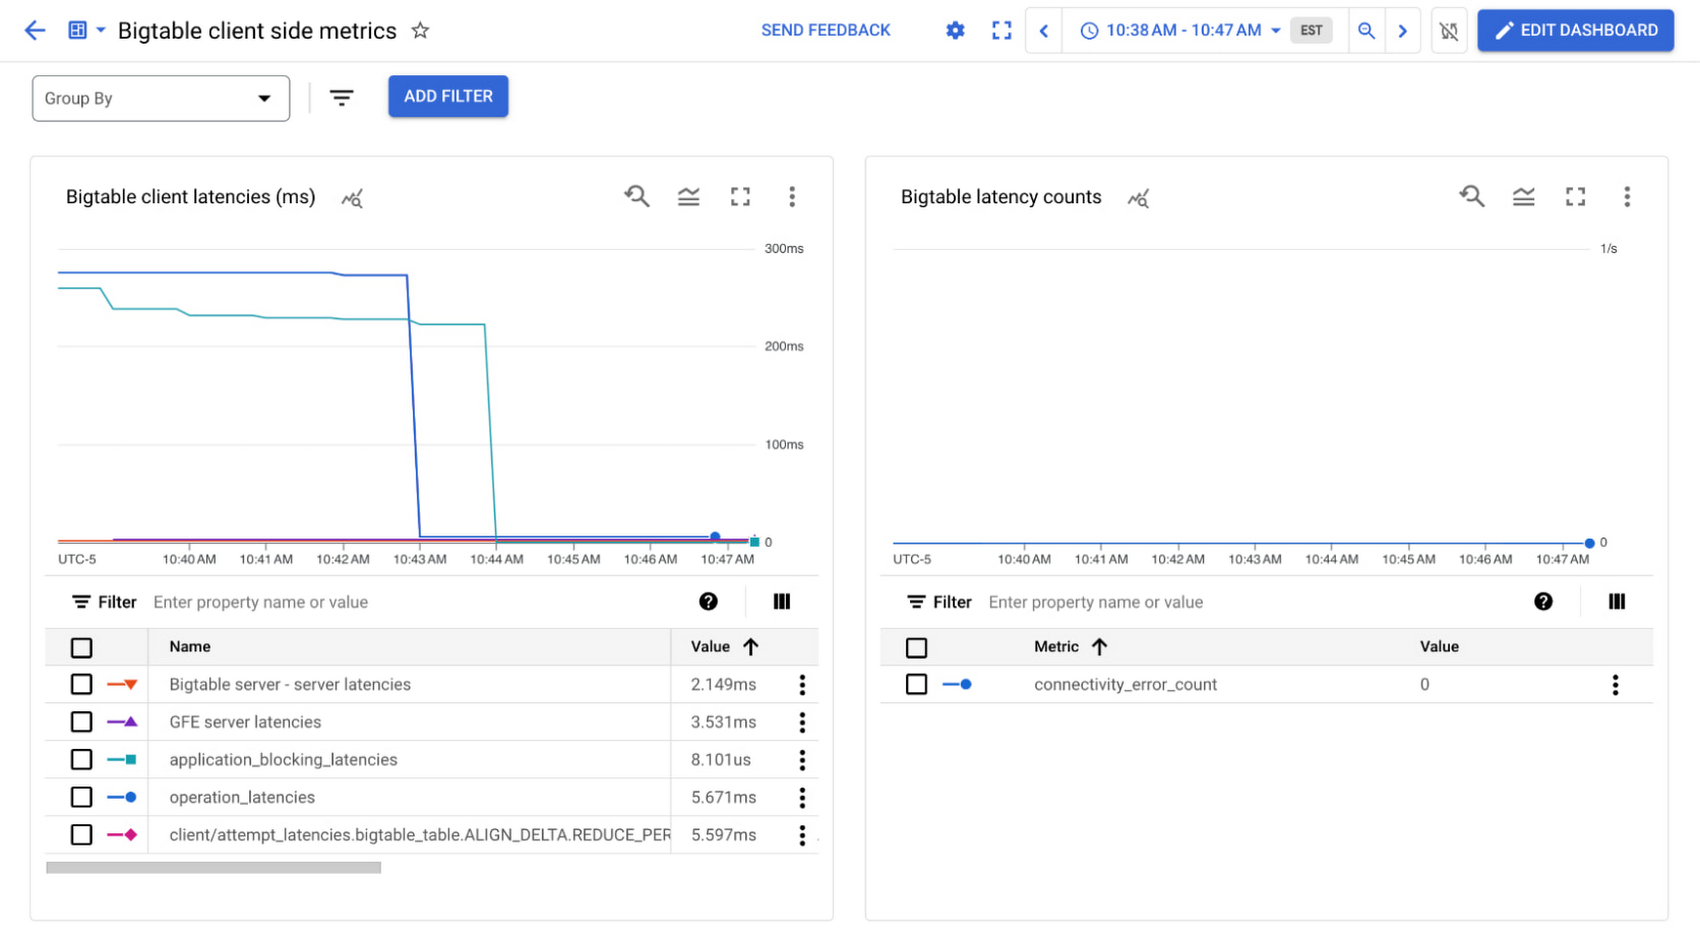
The 50th percentile (P50) for Bigtable server latencies are low at around 4ms, but the P50 attempt latencies are around 275ms. We can see that this latency comes from the processing time of the responses, and if we look at the metrics we'll see most of this latency comes from the application blocking latencies, which are also around 275ms.
To reduce the overall latency or the attempt latency in this scenario, we can cache the rows and then process them:
In this example we're not going to see a significant difference in the overall application performance since each row still takes 5ms to process, but it is a useful way to verify that the larger latency is expected or remove it as a factor altogether. The graphs below shows the original latencies and then the decrease once the code was updated:
High server latency: Cross-region application servers and Bigtable
In this last example, we've solved all our latency problems and want to add an additional Bigtable cluster in a different region because we're expanding globally. When we check the latencies, we see the attempt latencies are around 200 ms while the Bigtable server latencies are still low around 2.2 ms.
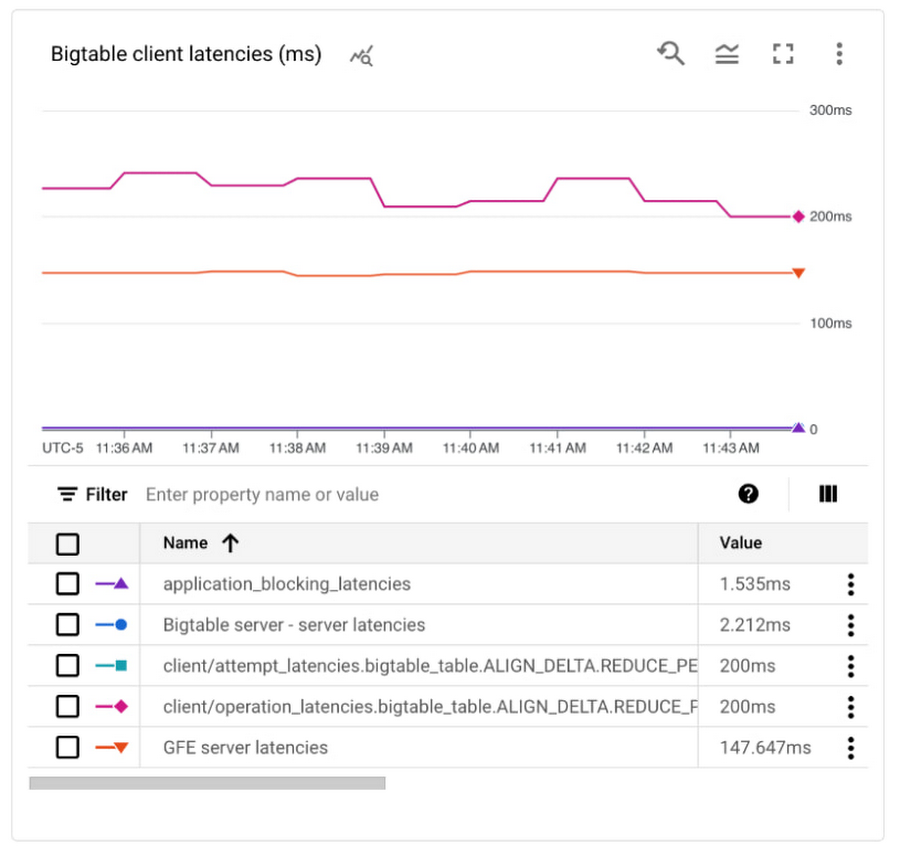
The server latencies are around 147 ms though, which indicates the high attempt latencies are coming from the application communicating with the Bigtable server. This makes sense since there is a round trip call across regions. We can add an additional machine to our application server in the region of our new Bigtable cluster and should see this round-trip cost eliminated.
Next steps
In this article, you've learned how to get increased observability and transparency into your systems with Cloud Bigtable's new client-side metrics, seen how to enable them, and explored a few common scenarios that could be impacting your overall system latency.
Read up more on the new client-side metrics to further optimize your Bigtable system.
Learn about Bigtable performance overall to ensure your database design isn't causing high Bigtable server latency and you're getting the best usage out of your tools
Add alerts for your newly monitored metrics to ensure you can quickly react to any latency changes