A connector to bring Earth Engine and BigQuery closer together for geospatial analytics
Olga Kalashnikava
Software Engineer
Michael DeWitt
Developer Relations Engineer
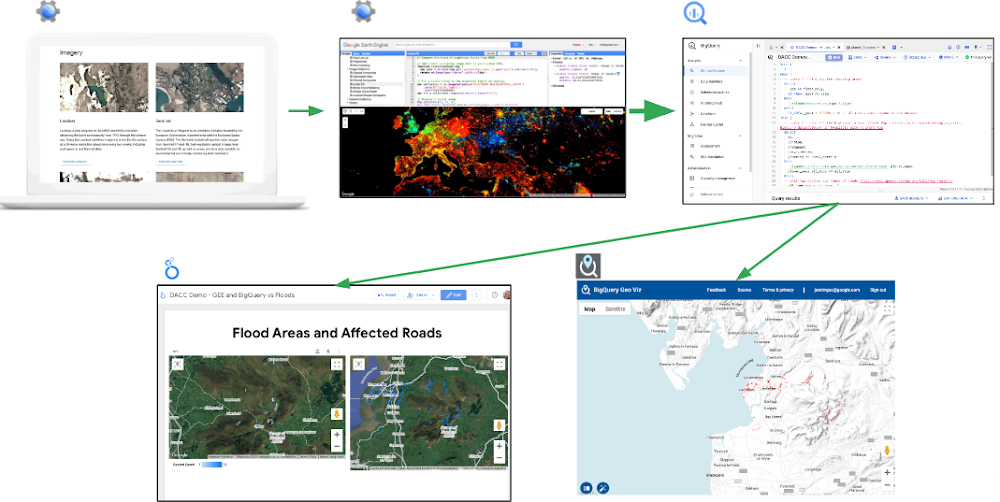
We're excited to announce a new feature that simplifies exporting tabular data from Earth Engine into BigQuery. Earth Engine and BigQuery share the goal of making large-scale data processing accessible and usable by a wider range of people and applications; Earth Engine tends to focus on image (raster) processing, whereas BigQuery is optimized for processing large tabular datasets. This new connection is our first major step towards a deeper interoperability between the two platforms.
For years, users have moved Earth Engine data into BigQuery, but, until now, that required careful attention to encodings, intermediate storage, and data types. Today, we can offer more juice for less squeeze, with a single-line invocation to transfer Earth Engine data into BigQuery. This new `Export.table.toBigQuery()` function makes a number of new flows simpler, including:
combining Earth Engine data with BigQuery data sources to get a more complete picture of a particular problem
using BigQuery's powerful analysis tools to extract insights from Earth Engine data
sharing Earth Engine data with SQL-friendly users in a way that's accessible for them
This guide walks through the process of exporting data from Earth Engine to BigQuery, building a real-world example of using Google's geospatial tools to identify flooded roads.
Example: Flooded road detection
Extreme weather events have a devastating impact around the world. Flooding, heat waves, and drought have substantial human and financial costs, causing mortality and devastation of homes and property. The following example shows how to use satellite data mosaics from Earth Engine and open road datasets from BigQuery, processing the data in both environments to determine which road segments are affected by a flooding event in the UK.
Prerequisites
Create a new Cloud project and enable the BigQuery and Earth Engine APIs.
Configure access to Earth Engine.
Create a dataset in your BigQuery workspace. This example uses one called "your_dataset".
Use Earth Engine Code Editor, or you can follow the same steps in the Colab environment with roughly equivalent Python.
Following this example requires a billing account to be enabled on the project, and it will generate charges for Earth Engine computation, BigQuery storage, BigQuery computation, and network traffic.
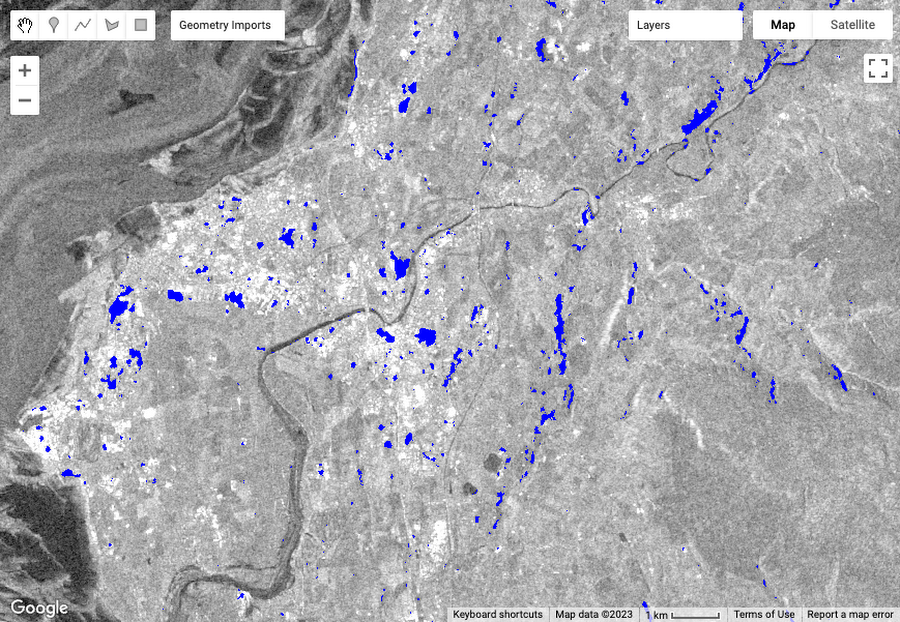
Identify flooded areas in Earth Engine
The Earth Engine Data Catalog contains the Copernicus Sentinel Synthetic Aperture Radar collection. This public dataset is composed of radar images that measure how surfaces scatter light waves back to a satellite's sensor. Standing bodies of water act like mirrors for radio signals, reflecting the satellite's radar light away rather than scattering it back to the imaging sensor. Most natural surfaces don't have this property, which means that one can differentiate standing bodies of water from their surroundings by looking for "dark" patches in the images (that is, areas with low backscatter values). Let’s prepare the input data by selecting an area of interest and filtering images with vertical-vertical ("VV") polarization, sending vertically polarized light, and measuring the vertically polarized light that's returned.
Note: the complete Earth Engine script is available here: https://code.earthengine.google.com/df33632277672cd9bce4295e26a11bbf
1. Load the Code Editor and define the area of interest and the filtered collection:
2. Identify the areas which changed most significantly using a pair of images from before and after the heavy rains. The difference between the two images indicates the regions that were flooded.
3. Next, use the Global Surface Water dataset to remove persistent surface water (like lakes, rivers, etc.) from the result:
4. We want the flooded areas in BigQuery, so let’s convert flooded pixel data to vector format.
5. Display the flooded areas on the map:
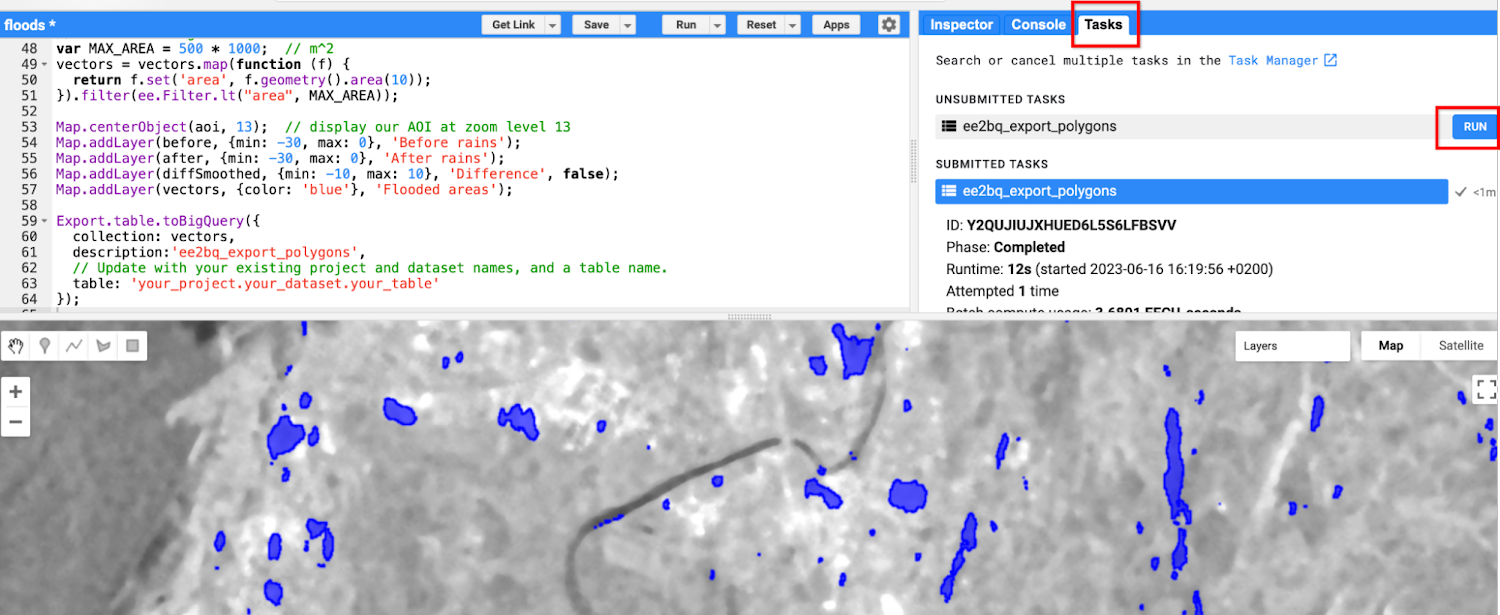
6. This is the big moment, where the new Earth Engine to BigQuery connector simplifies the export to a single `Export.table.toBigQuery()` call!
7. Click the "Run" button in the Code Editor to execute the script. Doing so will add a task to the "Unsubmitted tasks" section of the Tasks tab (see below). To start the task, click the "Run" button on the task itself (see below).
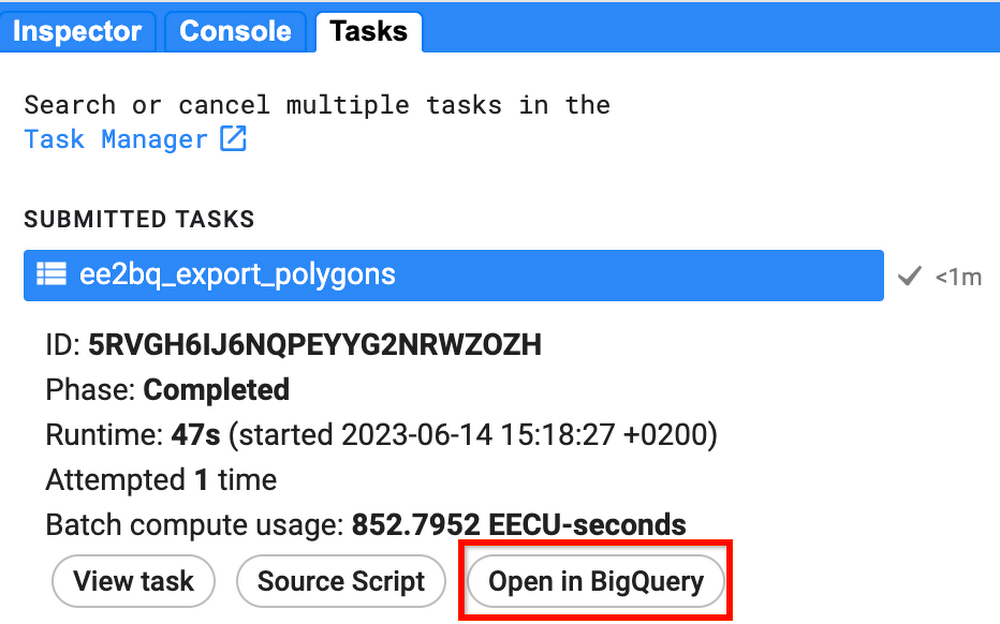
8. Wait for the task to complete and navigate to the exported table by clicking the “Open in BigQuery” button.
Identify flooded road segments in BigQuery
At this point, the flooded polygons are now in BigQuery, where they can be used in combination with the many publicly available datasets that are hosted there. The public "planet_ways" dataset from OpenStreetMap has information about road segments, which we'll combine with the data we exported from Earth Engine.
Select the polygons from our dataset as `flood_poly`
Join the result with the intersecting road polygons from OpenStreetMap data.
Once you have updated the following query with your dataset and table name, run it in the BigQuery UI.
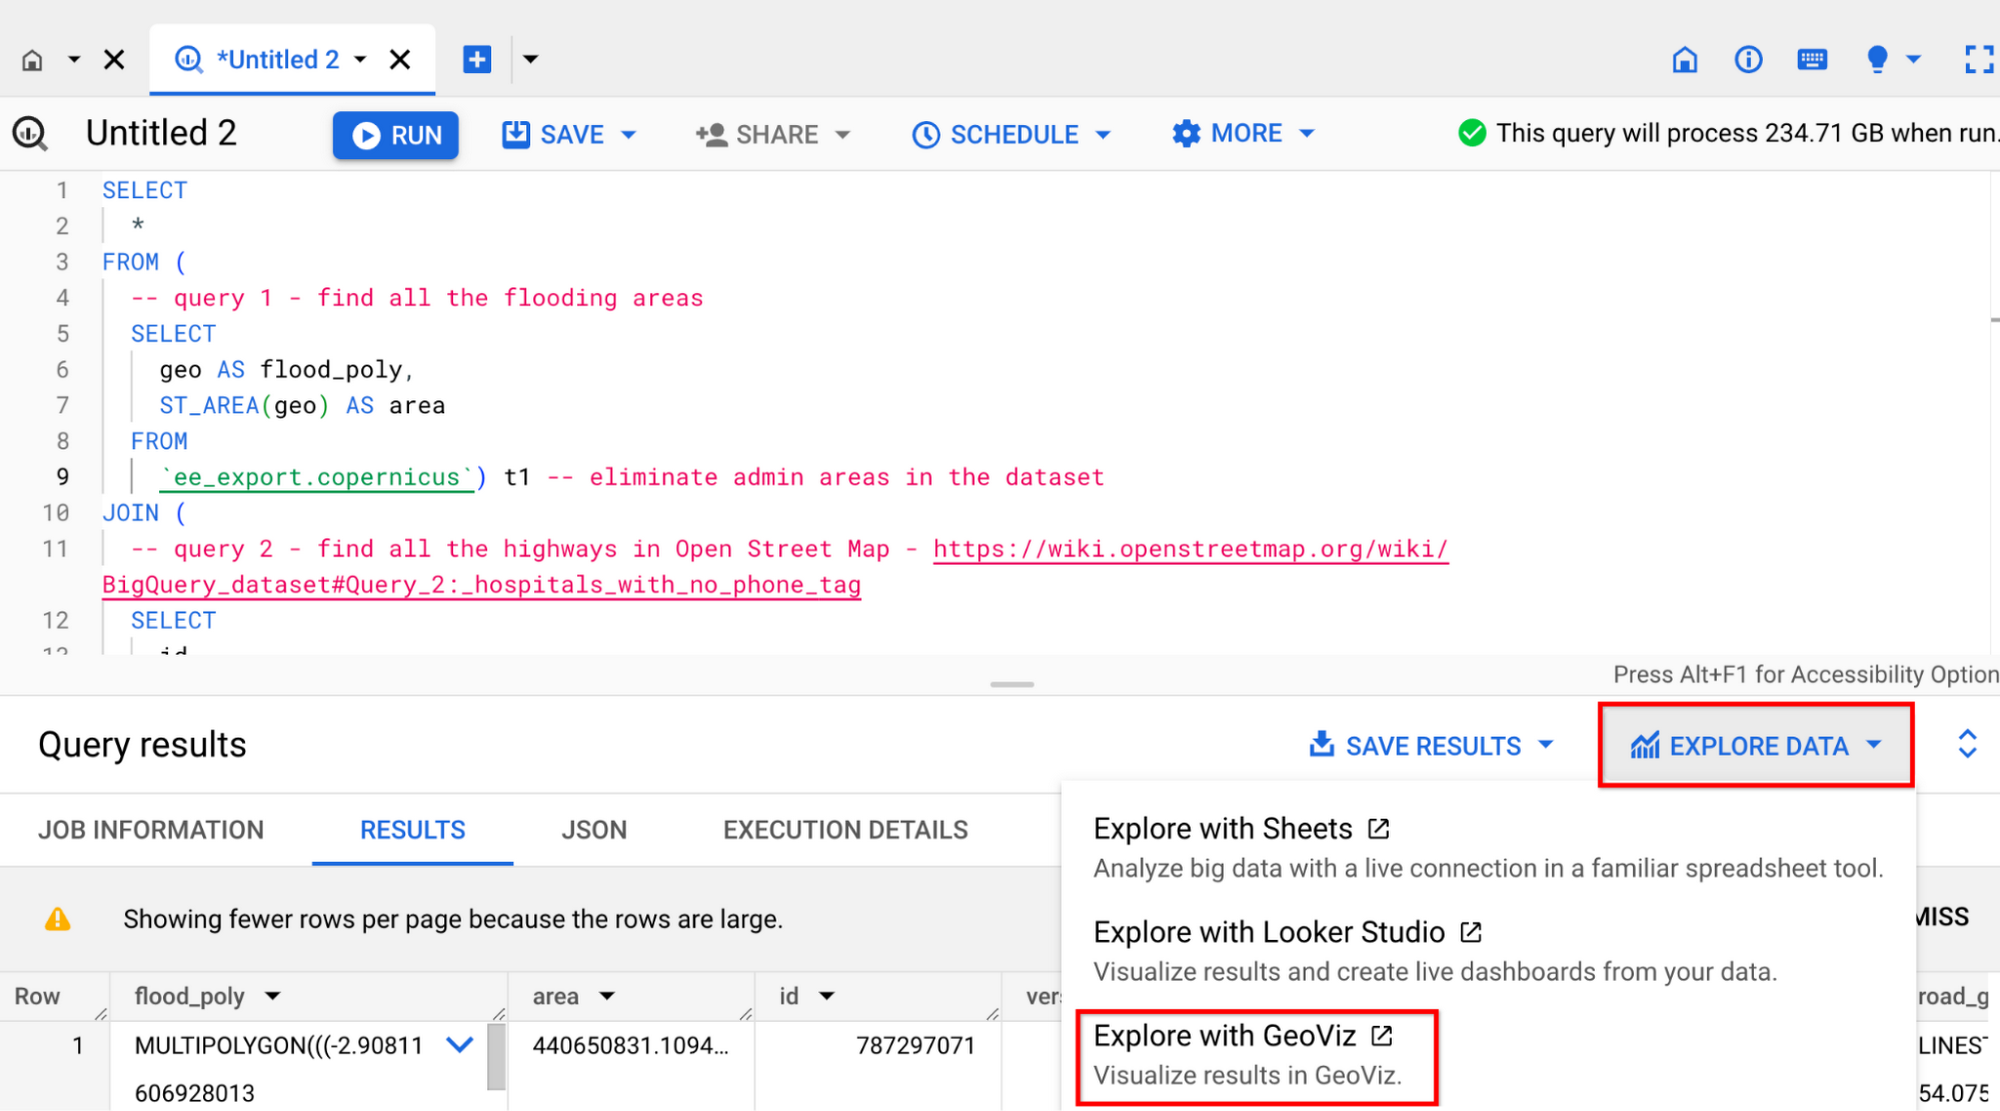
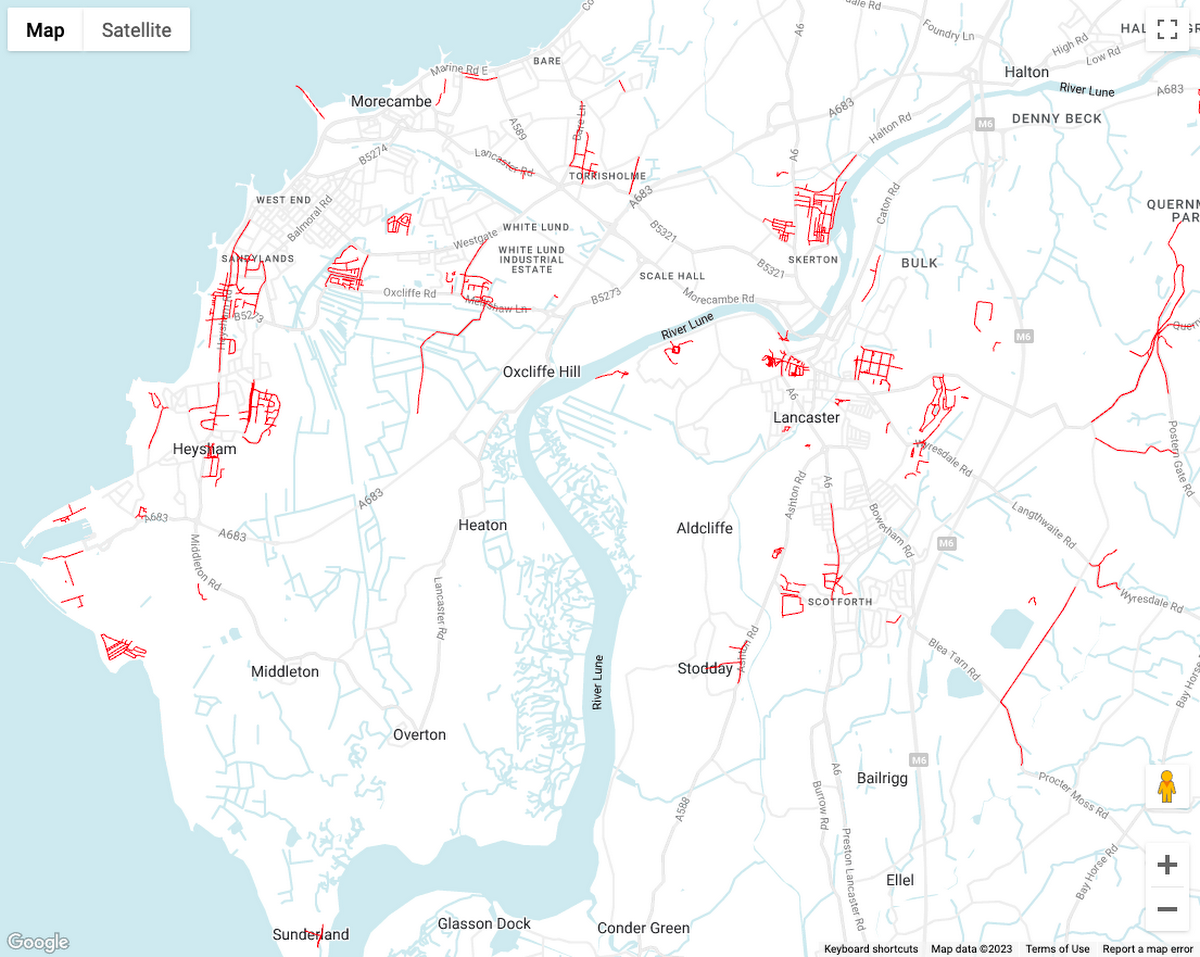
Visualize the results in GeoViz
Check the result of the query by creating a visualization in GeoViz. Click on “Explore Data” and then select “Explore with GeoViz”.
In GeoViz, click “Run” to load data into the system, then select a field to display. To display the flooded road segments, choose "road_geometry" as the geometry column:
What comes next?
To continue your adventure, we recommend:
Make it your own: adjust the area of interest and the time of the before/after layers to customize this example to your needs.
Using BI tools: Perform a similar visualization using filled polygon and linestring maps in Looker Studio.
Applying ML techniques: Run classification in Earth Engine or clustering in BigQuery.
Joining with additional datasets: Add a time-series of weather data to each polygon before exporting.
Learning more about BigQuery export: See the documentation: https://developers.google.com/earth-engine/guides/exporting_to_bigquery
Looking forward, we're excited to see how people use this feature to make new discoveries and solve important problems. We believe that geospatial analyses are key to addressing global challenges, and this feature is a step towards making that easier.
Watch this space. ⁛

