Troubleshoot and optimize your BigQuery analytics queries with query execution graph
Vinay Yerramilli
Product Manager, BigQuery
Samad Lotia
Software Engineer, BigQuery
We all want queries to run faster, better, and cheaper. BigQuery certainly does! But queries can get complicated quickly; this sometimes makes manual optimization necessary and unavoidable.
BigQuery is a complex distributed system, and numerous internal and external factors can influence query speed. Understanding what is going on might be a bit of a puzzle. To solve this, we launched the query execution graph with performance insights in preview a few months ago. Now, we are excited to announce its general availability.
Mercadolibre is a leading company in LATAM that processes millions of queries daily on BigQuery. "The query execution graph has helped us see where our queries are slowing down, and in a lot of cases, it's pointed us in the right direction for making optimizations," said Fernando Ariel Rodriguez, Data & Analytics expert at Mercadolibre.
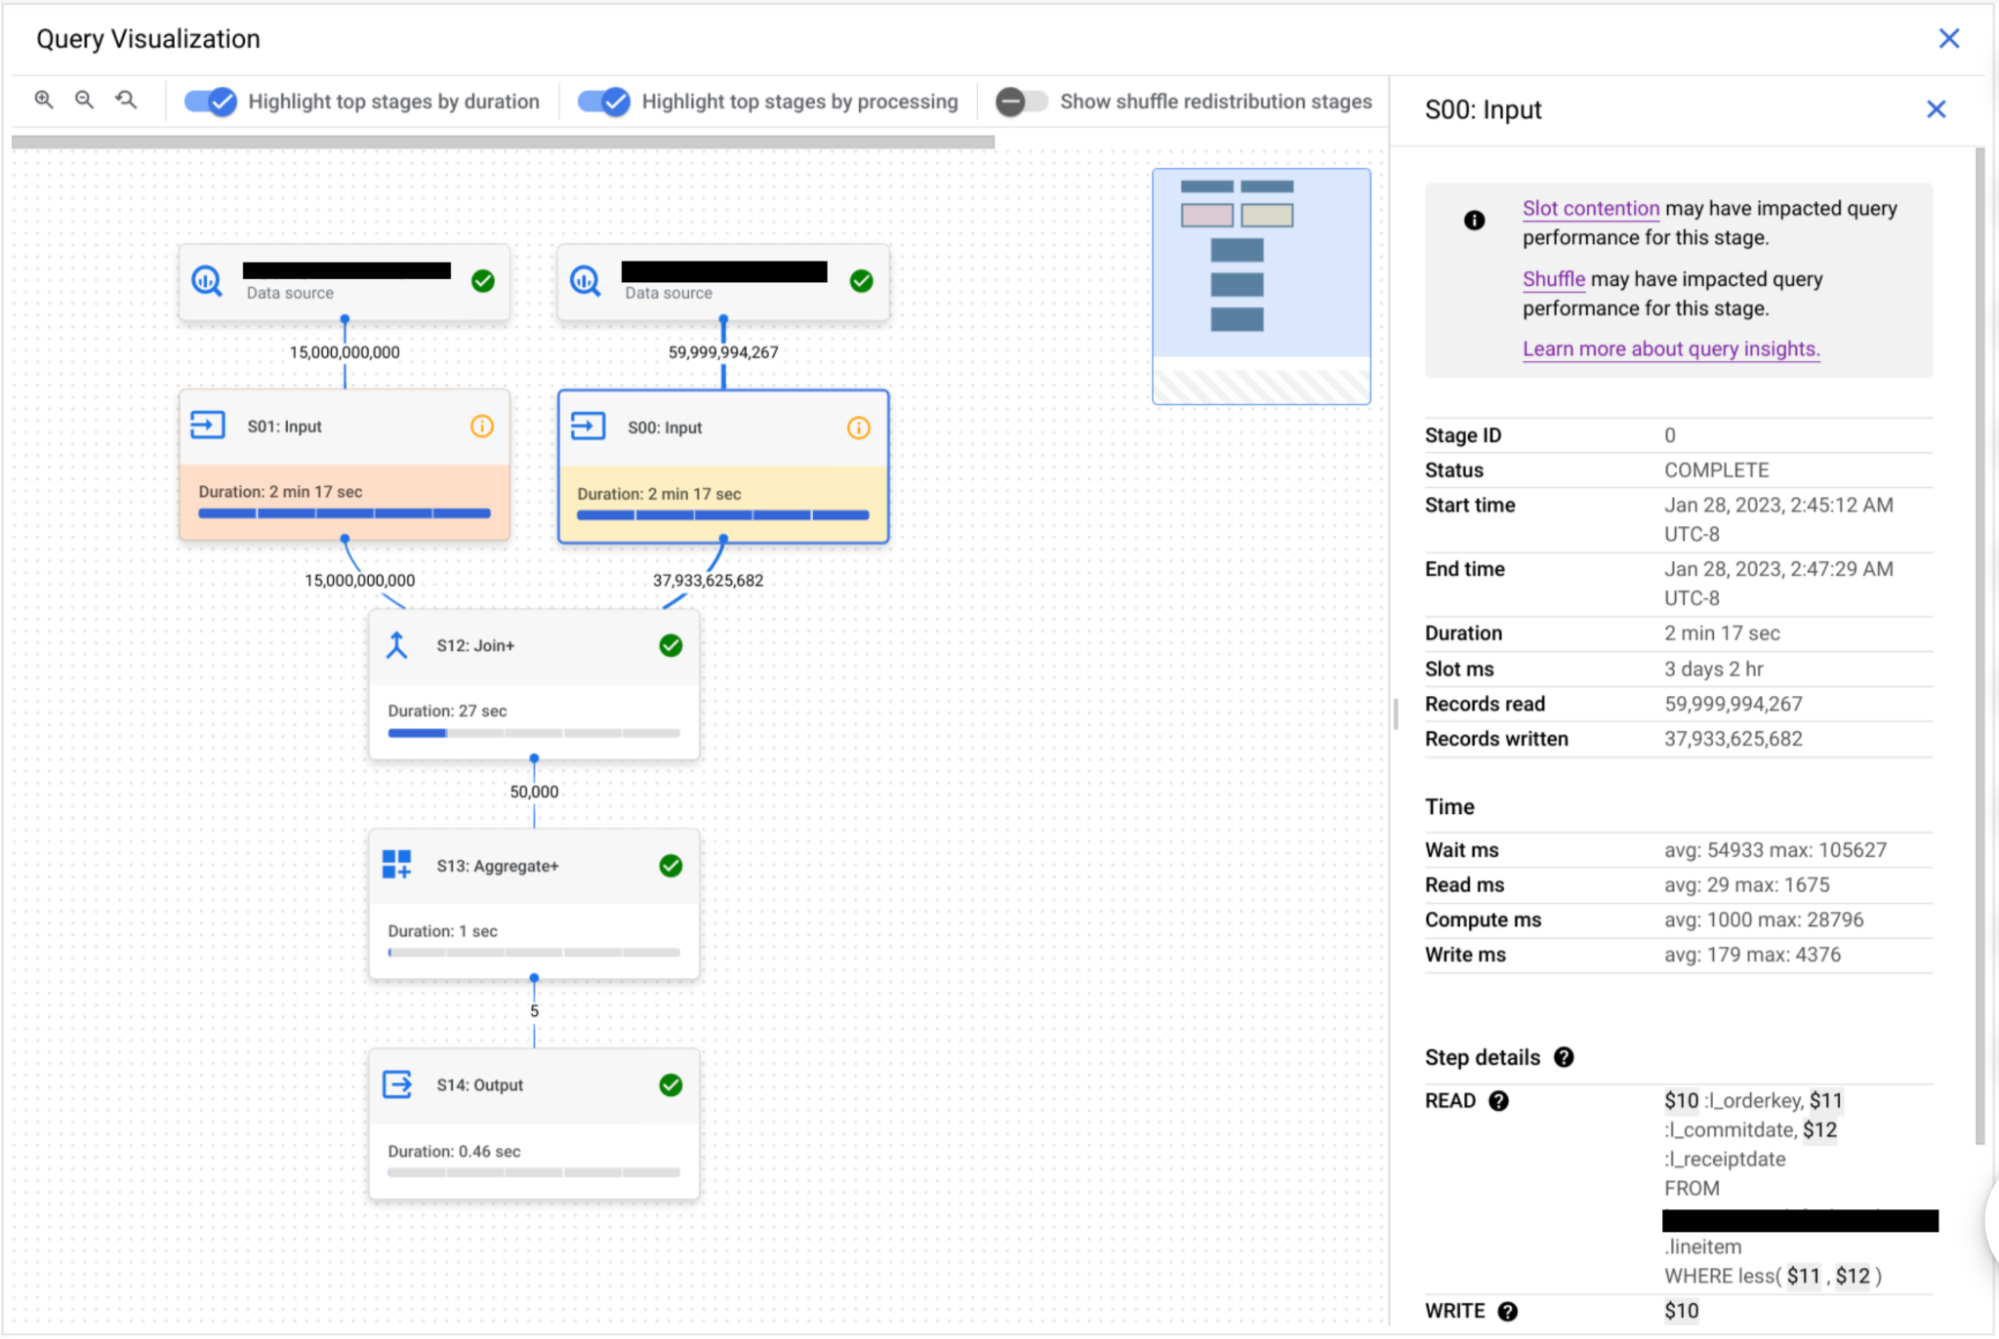
Think of the query execution graph as your magnifying glass to zoom into those nitty-gritty details of your query execution. It transforms your query plan info into an easy-to-digest graphical format and gives detailed information for each step. Whether you're dealing with a query in progress or a completed one (and soon a failed one as well), it’s a great way to understand what's happening under the hood.
Here's the cool part: the query execution graph also serves up performance insights. These are like friendly neighborhood tips, aiming to offer suggestions on enhancing your query performance. But remember, just like with any good detective work, getting the full picture involves looking at it from multiple angles, and these insights might only provide a piece of the puzzle.
Diving in
Now, let's delve into the intricacies of query performance insights. When BigQuery is put to work, it transforms your SQL statement into a query plan, divided into stages, each made up of various execution steps. Each stage is unique — some might be resource-intensive and time-consuming. But with our execution graph, spotting these potential speed bumps is a breeze.
But, of course, we're not stopping there. BigQuery also offers you insights into potential factors that might be causing your query to take the scenic route.
Familiar with slot contention? When you run a query, BigQuery tries to divide the work into manageable tasks. Each of these tasks is then assigned to a slot, which ideally, works on them in parallel for max efficiency. But if there aren't enough slots to pick up tasks, you've got a slot contention situation.
Then there is the "insufficient shuffle quota" issue. Think of it this way: as a slot finishes up a task, it stores the intermediate results in a "shuffle." Future stages of your query then pull data from this shuffle. But if you've got more data to write to the shuffle than there’s capacity, you might run into the “insufficient shuffle quota” issue.
If your query encounters either of the above issues, consider these solutions: optimize the query to use fewer resources, allocate more resources, or distribute the workload to avoid peak demand.
We must also address the intricacies of data-intensive joins. If your query includes a join with non-unique keys on both sides, you might end up with an output table that’s vastly larger than the input tables. This disparity between output and input row counts indicates a significant skew. A word to wise analysts: meticulously review your JOIN conditions. Did you anticipate the bloated size of the output table? It's best to avoid cross joins, but if you must use them, think about adding a GROUP BY clause for preliminary result aggregation, or a window function might come to the rescue.
Lastly, there's the possibility of a data input scale change. This is essentially when your query ends up reading at least 50% more data from a table than the last time you ran the query. You might be asking, "Well, how'd that happen?" One possibility is that the size of the table used in the query has recently grown. You can use the table change history to double-check this.
Viewing query performance insights across your entire organization
You can quickly retrieve insights for your entire organization by querying the INFORMATION_SCHEMA.JOBS_BY_ORGANIZATION view as shown below:
The output of the above query will return all query jobs in your organization for which performance insights were generated, along with a generated URL that deep-links to the query execution graph in the Google Cloud console (that way you can visually inspect the query stages and their insights).
What's next?
So, what’s on the horizon for our query execution graph and performance insights? Well, we're continuously fine-tuning these features. Expect to see more metrics, additional performance insights, and an even more intuitive graph visualization. We're just getting warmed up, so stay tuned for more exciting updates!
We hope you use BigQuery query execution graph and performance insights to better understand and optimize your queries. If you have any feedback and thoughts about this feature please feel free to reach us at bq-query-inspector-feedback@google.com. To learn about the feature in more detail, please see the public documentation.