Self-service analytics from ThoughtSpot comes to Google Sheets
Sean Zinsmeister
Director of Product Management, Data Cloud
Try Google Cloud
Start building on Google Cloud with $300 in free credits and 20+ always free products.
Free trialToday’s workplace is data intensive. This is why, even in a modern data stack world full of incredible business intelligence tools, "good ol’ reliable" spreadsheets are still commonly used to wrangle data problems big and small.
Data is everywhere, so why aren’t insights?
While companies recognize the value data can provide for business, tapping into it is not always easy. Spreadsheets are a fantastic tool for users to start turning raw data into something meaningful, which is why knowing how to use spreadsheets for data analysis remains critically important for users across industries — it’s the top use case cited by 63% of users when it comes to their spreadsheets. And yet, more than half of users say that they still struggle to make sense of the data in those spreadsheets. For every power user or data analyst who knows how to make the most of spreadsheets, there are countless business users, each with their own specific questions.
The increasing demands on today’s knowledge workers, the new decision makers, are only exacerbating these challenges. Not only do you need the skills to analyze and act on data quickly, but there is a need for live access to this data so that decisions are made based on up-to-date information in the moment, not what was happening earlier today, yesterday, or last week.
With the industry adopting cloud data warehouses and the rise of the data cloud, we are witnessing the rise of data connectors. Google Cloud BigQuery makes it easy for anyone at an organization to make data-driven decisions quickly, with access to big data insights in real-time, all within the familiar interface of Sheets with Connected Sheets.
ThoughtSpot and Google Cloud are collaborating to bring data-driven analytics to everyone with ThoughtSpot for Google Sheets. Organizations like CNA Insurance, Vodafone, Mayo Clinic, and FactSet use the combination of ThoughtSpot and Google Cloud to empower business users to answer their own data questions with a simple, powerful self-service analytics experience on fresh, reliable data.
Unleashing insights from data in sheets
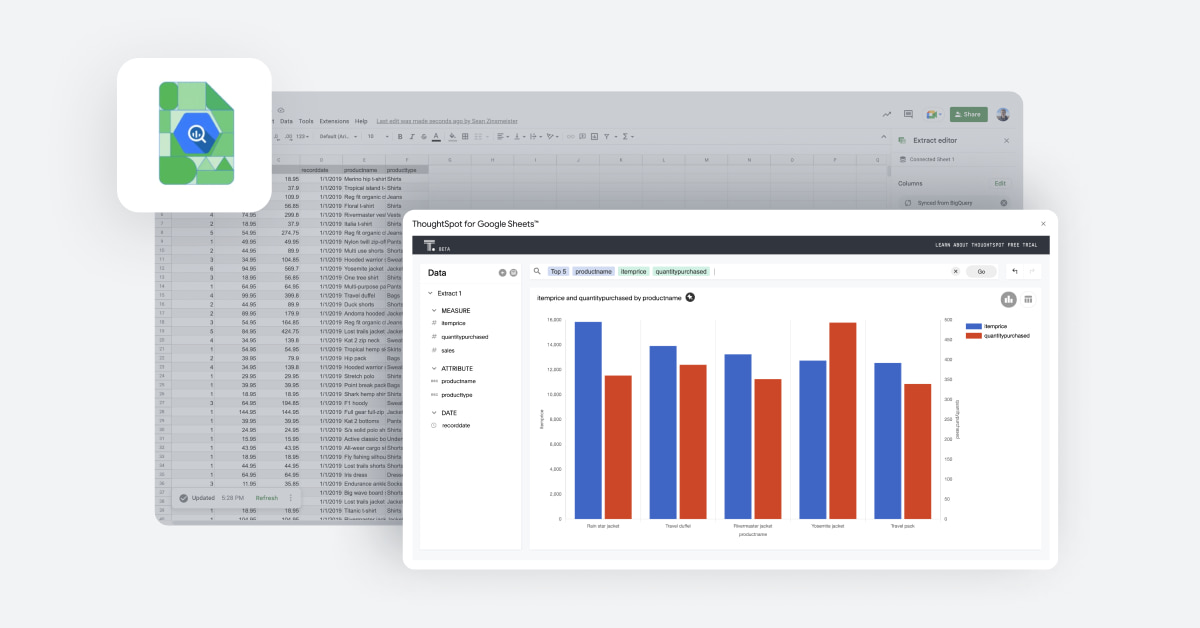
ThoughtSpot for Sheets is a standalone native app plugin for Google Sheets that brings a true self-service analytics experience to your Sheets data. With ThoughtSpot for Sheets, creating charts and visualizations is as simple as searching. All that is needed is some data in Sheets and a curious mind.
Let's take a look.
Bringing data to Google Sheets
There are a plethora of ways to get data into Sheets. Many savvy users are turning to popular data integration tools like Supermetrics and Coefficient.io to connect live data from their business apps to Google Sheets for ad-hoc analysis. Other people like a quick and dirty copy and paste. However, with so much business data moving to data clouds, you can now query the trove of customer data in BigQuery through Sheets.
Getting started
ThoughtSpot for Sheets is simple to launch. Do a quick search on Google Workspace Marketplace or find it here. A simple click and you’ve installed the app. Depending on your organization, you might have to send a brief friendly message to authorize the plugin from your Google Workspace Admin.
With ThoughtSpot installed, you're ready to connect to some data — just go to the Data tab and select "Connect to BigQuery". From there one can explore tables in the business data set or connect to some of the public data sets available from Google Cloud’s Analytics Hub.
Once the Sheet has the data you want to work with, the fun really begins.
No data modeling required. That’s right. No star schemas or snowflake schemas. Just insights.
With one click,be able to leap over the biggest hurdle people face with data. Simply select ThoughtSpot from the Extensions menu, and the app handles the rest. Depending on the data size, in just a few moments the app automatically reads, understands, and categorizes your data into different types (DATES, MEASURES, ATTRIBUTES) all in a easy to use modal that sits right on top of your Sheet for easy exploration.
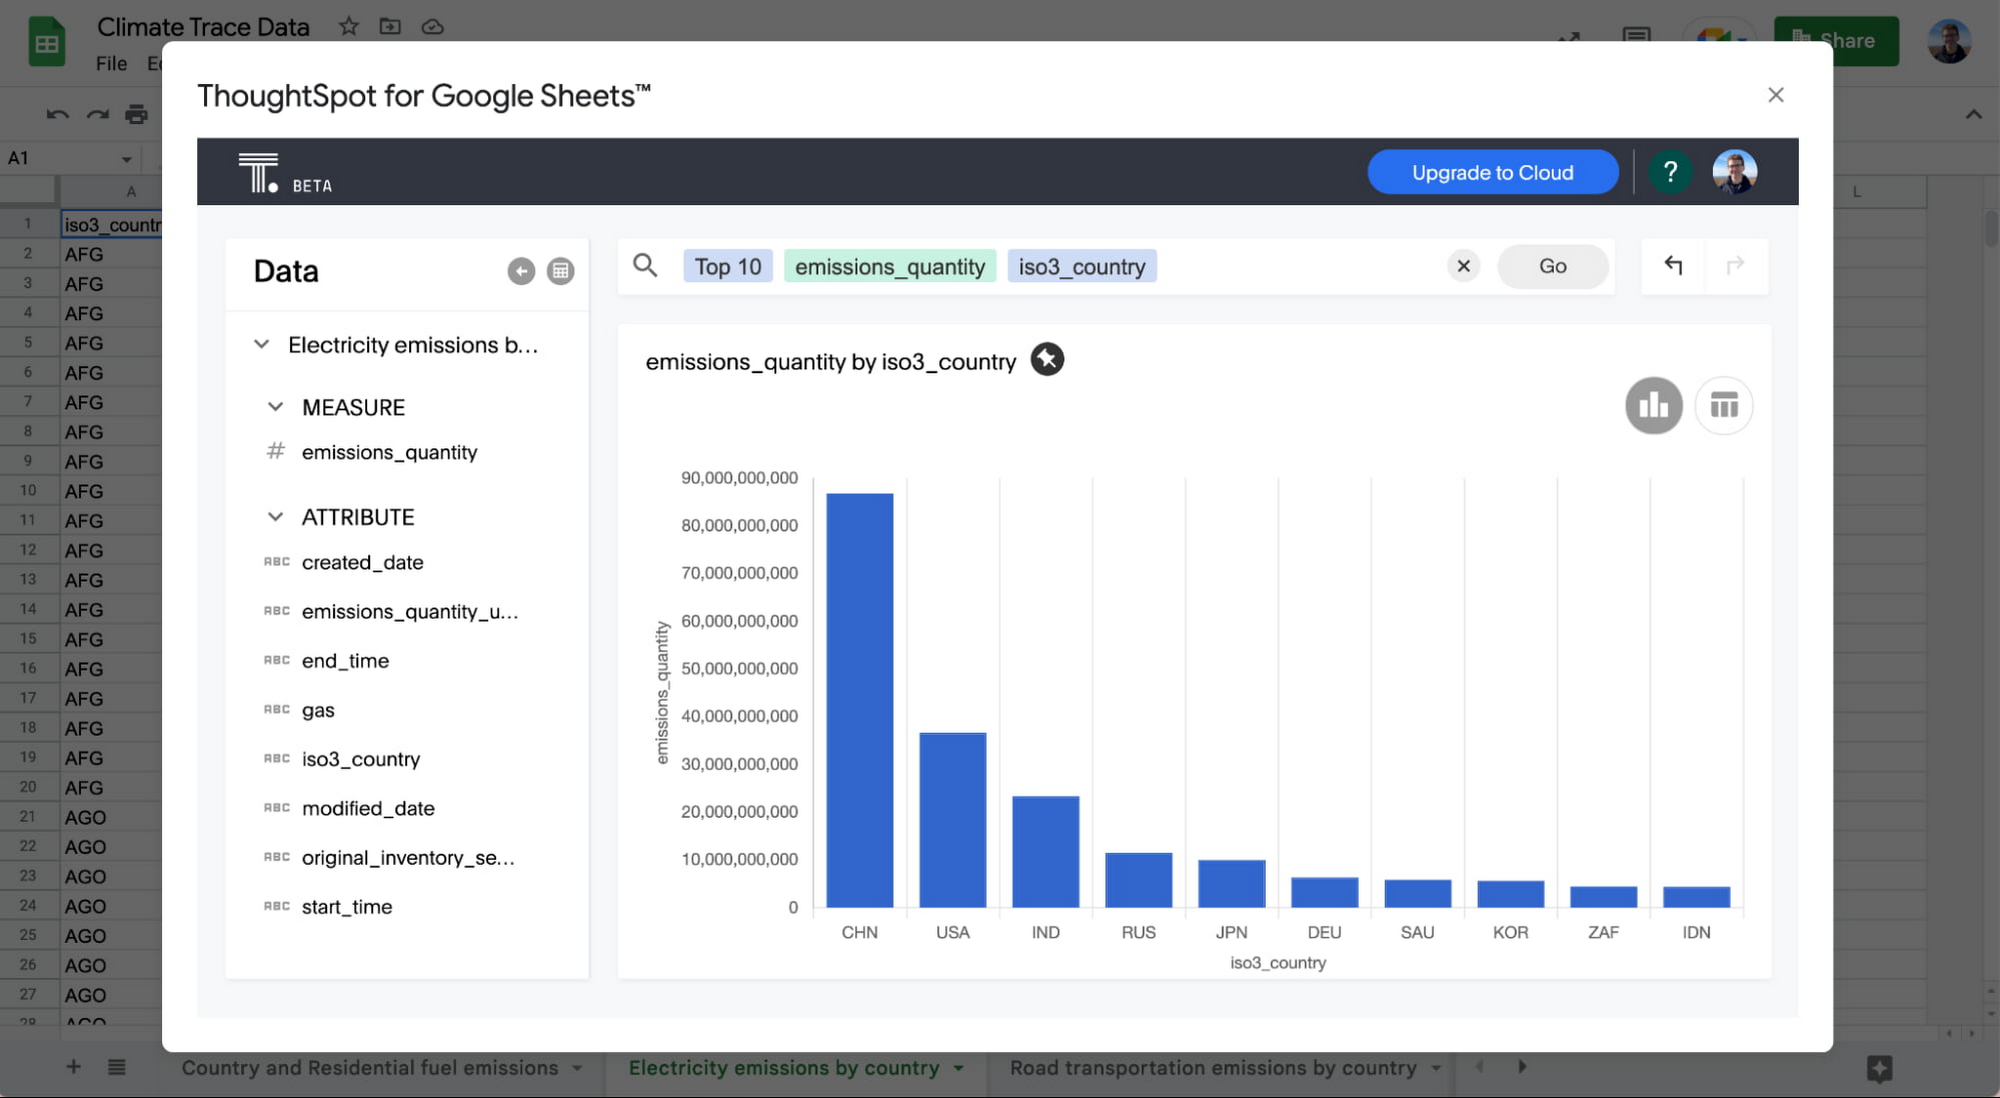
Create content with search
Once data is in Sheets, ThoughtSpot makes it easy to ask questions of data. Using the search bar or selecting from the side panel, one can start to create new visuals automatically. The user experience was designed for the data explorer, and the data explorer in all of us just waiting to be unleashed. The search engine acts as a powerful compiler and gives you access to unlimited combinations of searches to uncover opportunities hidden in your Sheets. With search you can call up endless combinations of measures, attributes, and even filters in your data, so no stone is left unturned.
We even built in powerful keywords to take your analysis further, like “top” which generates the top n items from a sorted result. If the search has more than one measure, ThoughtSpot generates the top n items from the first measure in the search.
Travel through time with ease with search. The search engine allows users to easily aggregate data daily, weekly, monthly or get even more granular with time slices.
Drill anywhere
True self-service BI should be limitless, without making drilling into the data difficult. So we put the data search engine to work again to let you drill anywhere in your data with a single click. Say "so long" to VLOOKUPS.
Don't worry, you won't get lost. We built in easy internal navigation that lets you easily undo/redo your query so you never lose track of that aha-moment.

Data storytelling with Slides & Sheets
For almost every user we surveyed, making sensible charts and visualizations from spreadsheet data is a requirement, especially for data storytelling. Yet more than half say doing so is challenging. In addition to being a valuable companion for Google Sheets, the app also integrates with Google Slides to make sharing, collaboration, and presenting data a breeze. When happy with the chart or visualization created, click Pin to Slides which then lets the user create a new presentation or add to an existing deck.
Putting ThoughtSpot for Sheets to work
So in theory, this all sounds great. But it’s even more exciting when applied to the real world.
Sales
Whether Salesforce, Gong, Outreach, Qualified, or Drift, there are so many data sources to help give sales professionals the edge.
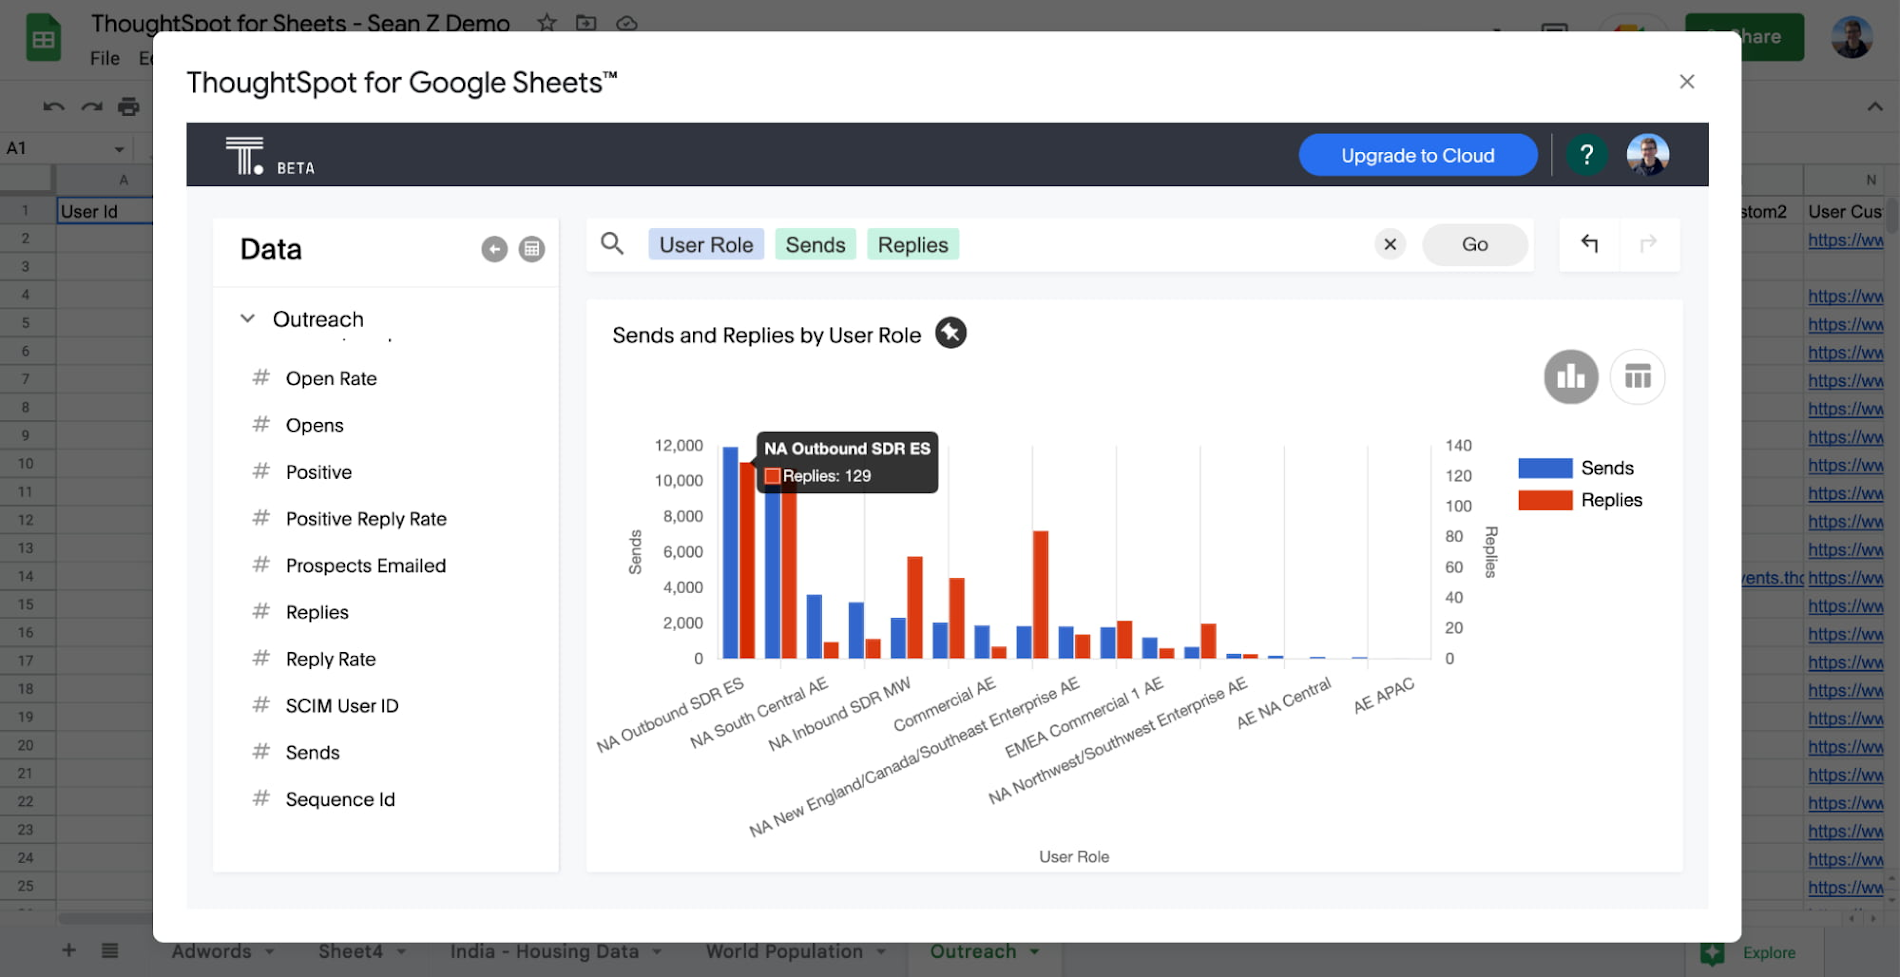
With ThoughtSpot for Sheets, you have easy to use sales analytics to manage pipeline health, go deeper with prospecting, or make sure your next QBR with your customer or manager is grounded in actionable data.
Marketing
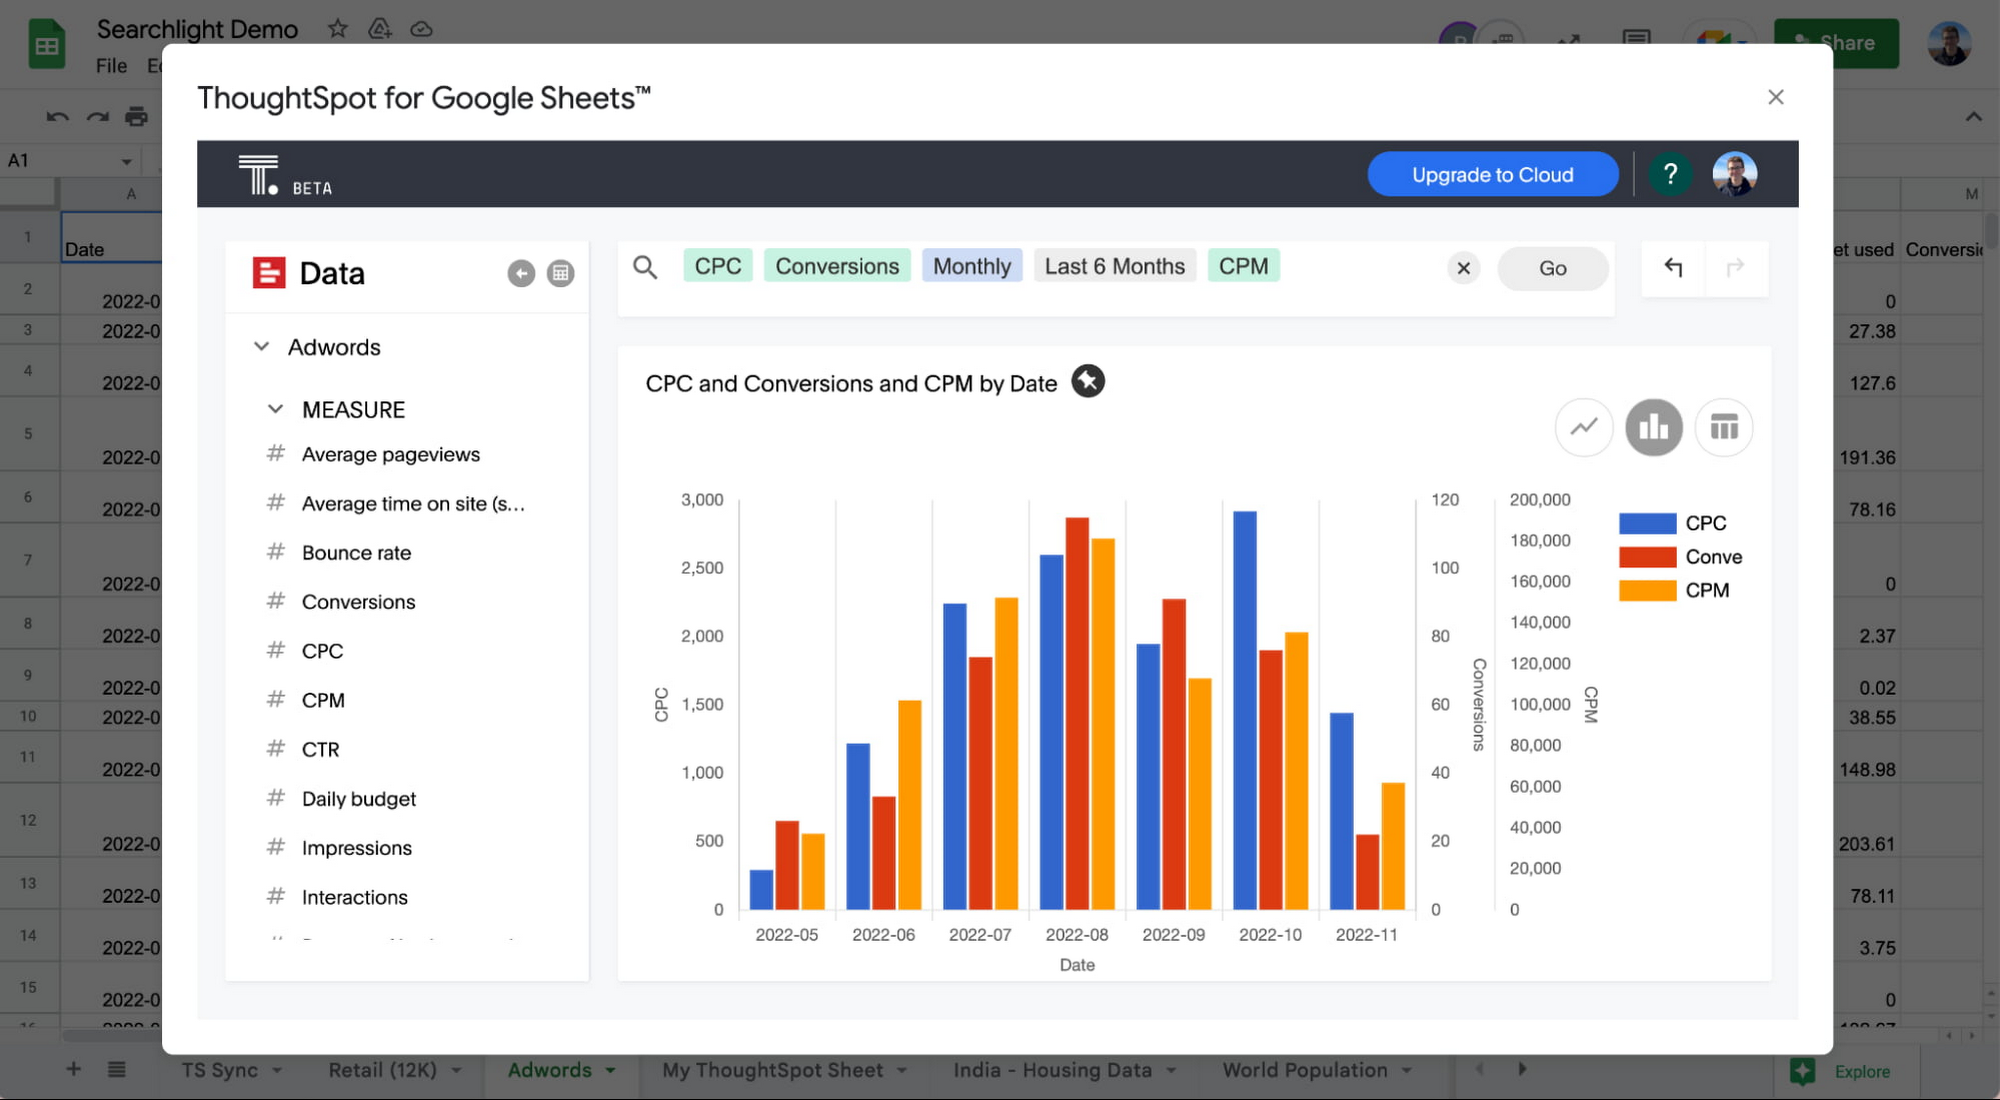
Google Sheets has become the workhorse of any marketer. Data from Google Ads, web analytics, HubSpot, and advertising all find their way into Sheets, begging for marketing analytics so users can understand customer and user trends, optimize programs, and uncover the next winning campaign.
Research
Students and researchers now have access to a powerful self-service experience, conveniently right in the Google Sheets they already use.
Explore public datasets available from BigQuery and Analytics Hub from crypto and census data to geopolitical ad spend to boost data fluency and research projects.
Spreadsheets 2.0 and the dawn of data-driven analytics is upon us. Install ThoughtSpot for Google Sheets on Google Marketplace and let us know what you think.
Happy data exploring.