Accelerate your data exploration with Quick Starts
Tej Toor
Looker Product Manager, Google Cloud
Try Google Cloud
Start building on Google Cloud with $300 in free credits and 20+ always free products.
Free trialLooker Explore users may recall their first encounter as landing on the page, seeing all the dimensions and measures on the left, and getting the sense that this tool would be incredibly powerful, even though they weren’t exactly sure how to start using it. On the other hand, if you’re an experienced Looker data explorer, you likely understand that while Explores can be intimidating at first, they offer a gateway to virtually unlimited data analysis.
Even power users, though, often don’t want to build queries from scratch. Different naming conventions or model structures can require a learning curve when bouncing between various Explores on their instance. People finding themselves building the same types of analyses over and over often instead start from an existing analysis, choose “Explore from Here,” select a relevant dashboard tile, and modify the fields as needed.
We’re introducing Quick Starts to make it easier for all users to get started and easily explore data in Looker. Whether you are brand new to Looker or an Explore pro, this capability will be equally useful. Quick Starts enable you to jump right into an analysis with a single click on the Explore page. From there, you can modify the selected fields to find the specific answers you’re looking for.
Quick Starts use cases
- Demonstrating the power of Explores to highlight key types of analyses that can be created from a specific Explore page.
- Offering a “soft-landing” for new explorers that are initially less intimidating and allow them to tweak an existing analysis vs. building one entirely from scratch.
- Saving time for seasoned users by modeling frequent queries and using them as Quick Starts to make your analyses faster and less repetitive, just like modeling commonly requested fields in LookML reaps benefits in terms of reusability .
- Providing one-click access to common filter sets by providing explorers with a preconfigured set of filters to grab and go. No need to repetitively add and configure the ones you need.
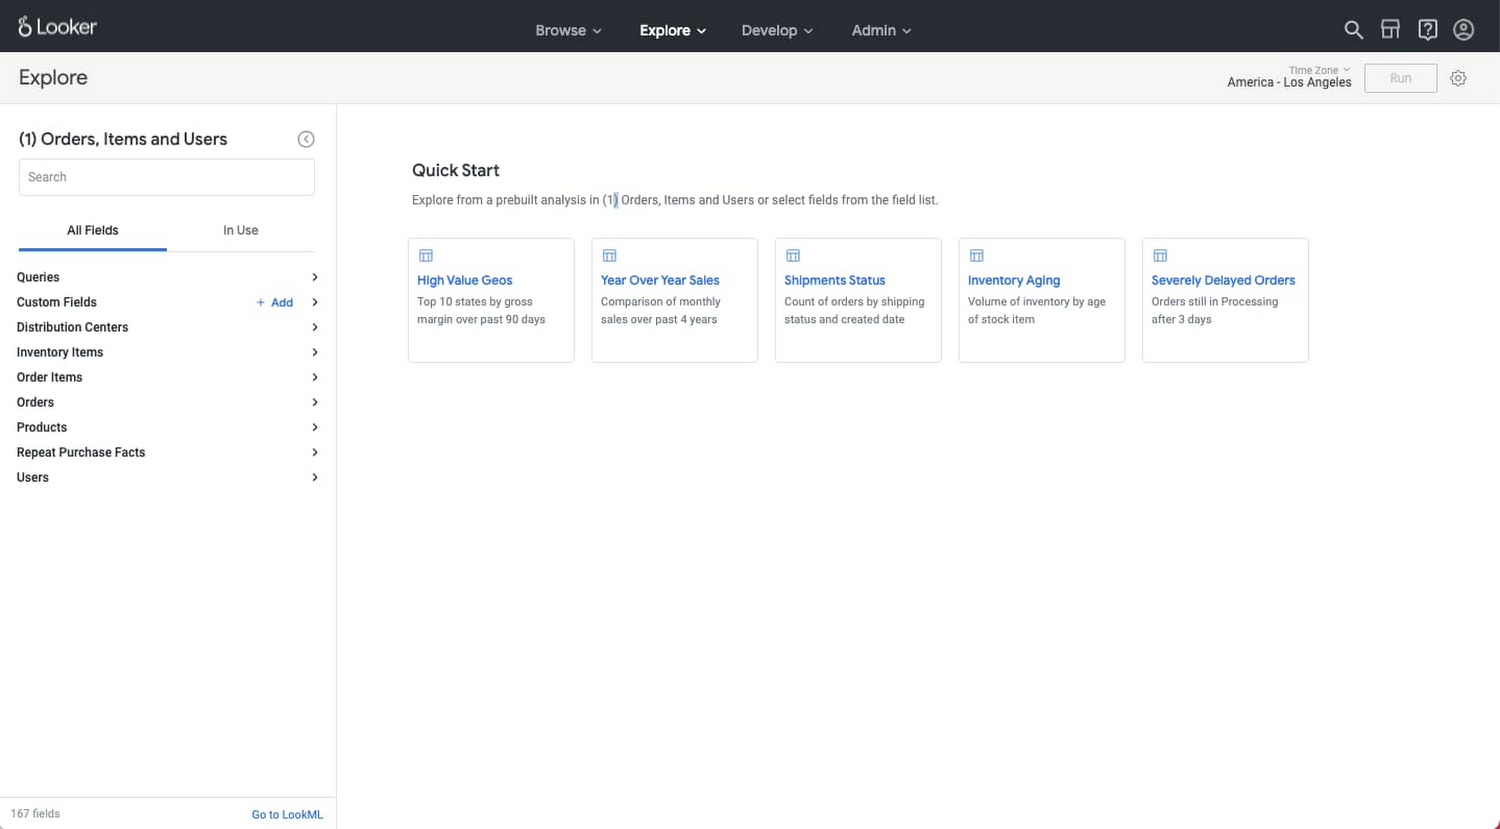
Let’s take a look at Quick Starts in action. Suppose you had an Explore with ecommerce data about orders, items, and users. Here’s an example of some Quick Starts you might offer for the Explore:
Clicking into the first Quick Start tile lands you on the analysis below.

Now, suppose you are actually interested in the top 10 states by order count. In this case, you could very easily remove the “Total Gross Margin” measure and swap in the “Order Count” measure, without having to configure the filters, the visualization, or the row limit. Using a Quick Start helps you get to the answer you were looking for with just a few clicks.
How to add Quick Starts to an Explore
Quick Starts are generated by default from queries defined in your LookML model. The easiest way to define a query in your model is by building the analysis in an Explore and then copying the aggregate table LookML to use as a starting point for your modeled analysis LookML. Modeled analyses will automatically show up as Quick Starts on your Explore page, so once they’ve been defined, you’re all set.
Best Practices for building Quick Starts
- Offer different types of analyses that have a better chance of finding something close to what you’re looking for. If you had an Explore containing orders data for an e-commerce company, for example, you may choose to build one Quick Start showing the total revenue for each category by state, and another showing a period-over-period analysis of revenue by month for the past 3 years. This way, a user who may be looking for an analysis of the number of customers over time could swap out “revenue” for “number of customers” in the period-over-period analysis and be good to go.
- Avoid getting too nuanced, since Quick Starts will be used as a jumping off point for many different future data explorations. Quick Starts are not ideal for crafting very nuanced queries for one-off analyses. Instead, focus on creating analytical structures that can easily be applied to different analyses.
- Add clear, easy to understand descriptions that define the analytical question a Quick Start will answer and offer the ability to easily select the Quick Start that will be most helpful. In the process, you’ll also be able to see firsthand how that analytical question translates into an analysis in Looker.
As you get started with Quick Starts, we’d love to hear any feedback you have. We’ve been using Quick Starts a lot internally at Looker, and we hope you and your teams find them as useful as we do.