Getting to know Looker: How LookML can simplify BI workflows
Shane Glass
Developer Advocate
Business intelligence workflows at any organization can help the business make better decisions, like where to expand your company and how to most effectively deploy your resources. My work as a data analyst, open data advocate, and former lead of the Google Cloud Public Datasets Program has given me a broad view into how data teams develop their business intelligence workflows. I’ve been fortunate to work with data analysis teams across numerous industries, including retail, weather, financial services, and more. Throughout this, I’ve seen the common challenges that teams run into in their business intelligence workflows.
You might think that teams’ challenges stem from the tool they pick, but every business intelligence tool has its own advantages. Some excel at data visualization, others are great for sharing dashboards, and some BI tools do well with data preparation. Most BI tools connect easily to at least some data warehouses, and have the ability to visualize these data.
But every BI tool also has its drawbacks. And because every team across an enterprise has slightly different requirements for BI, they often choose different tools, creating a segmentation problem within a company. The most common form of this I’ve seen is that metrics are defined differently within each tool and there is no centralized data governance, which leads to unnecessarily duplicated workflows across the company.
Looker, now part of Google Cloud, can help address these "in-between product" issues. LookML, Looker's powerful semantic modeling layer, gives teams the ability to easily create a standardized data governance structure and empowers users across the enterprise to undertake their own analysis while trusting that they all are built on the same single source of truth. (You can read more about why Looker developed LookML in this blog post.)
In this post, though, we’ll focus on five groups who can benefit from LookML and see how it can simplify their BI workflows. For each group, you’ll see how LookML can help, with a snippet of LookML code as an example. Click through to the "Here's an example" link to GitHub repositories to see the full LookML file if you'd like more detail.
Data engineers and modelers
Who are you: You are the group that most obviously benefits from LookML. Your title is probably "business intelligence analyst" or "data engineer." Your team builds the underlying infrastructure that makes data-driven decision-making possible, standardizes the data that feeds key metrics, and helps measure progress toward KPIs.How LookML helps: LookML is all about reusability. It brings to data modeling many of the tools and methodologies used in software development, such as collaborative development with Git integration, object definitions, and inheritance. It allows you to define a dimension or measure once and build on it, instead of having to repeat this effort. This enables you to standardize metrics and the data that define them across the entire enterprise in a scalable manner that saves you time. By converting raw data into meaningful metrics using LookML, you empower BI users across the entire enterprise, from accounting to marketing, to easily get started building their dashboards with the confidence that comes from knowing their metrics are properly defined and aggregated.
Here's an example: One common challenge for businesses is being able to compare profit and margin across different business units because of differences in revenue sources, inventory costs, personnel expenses, and other factors. This often leaves decision-makers siloed from each other and requires you to make manual adjustments any time you want to do cross-silo comparisons.
However, LookML can eliminate that challenge. The LookML snippet below joins the item cost from the inventory_items table with the sale price from the order_items table, so that gross_margin can be defined as sales_price - inventory_items.cost. Once that’s in place, you can see how easily gross_margin is referenced repeatedly throughout other dimension definitions. You can call ${gross_margin} without having to either rewrite the SQL each time or rerun the same SQL statement in several different places.
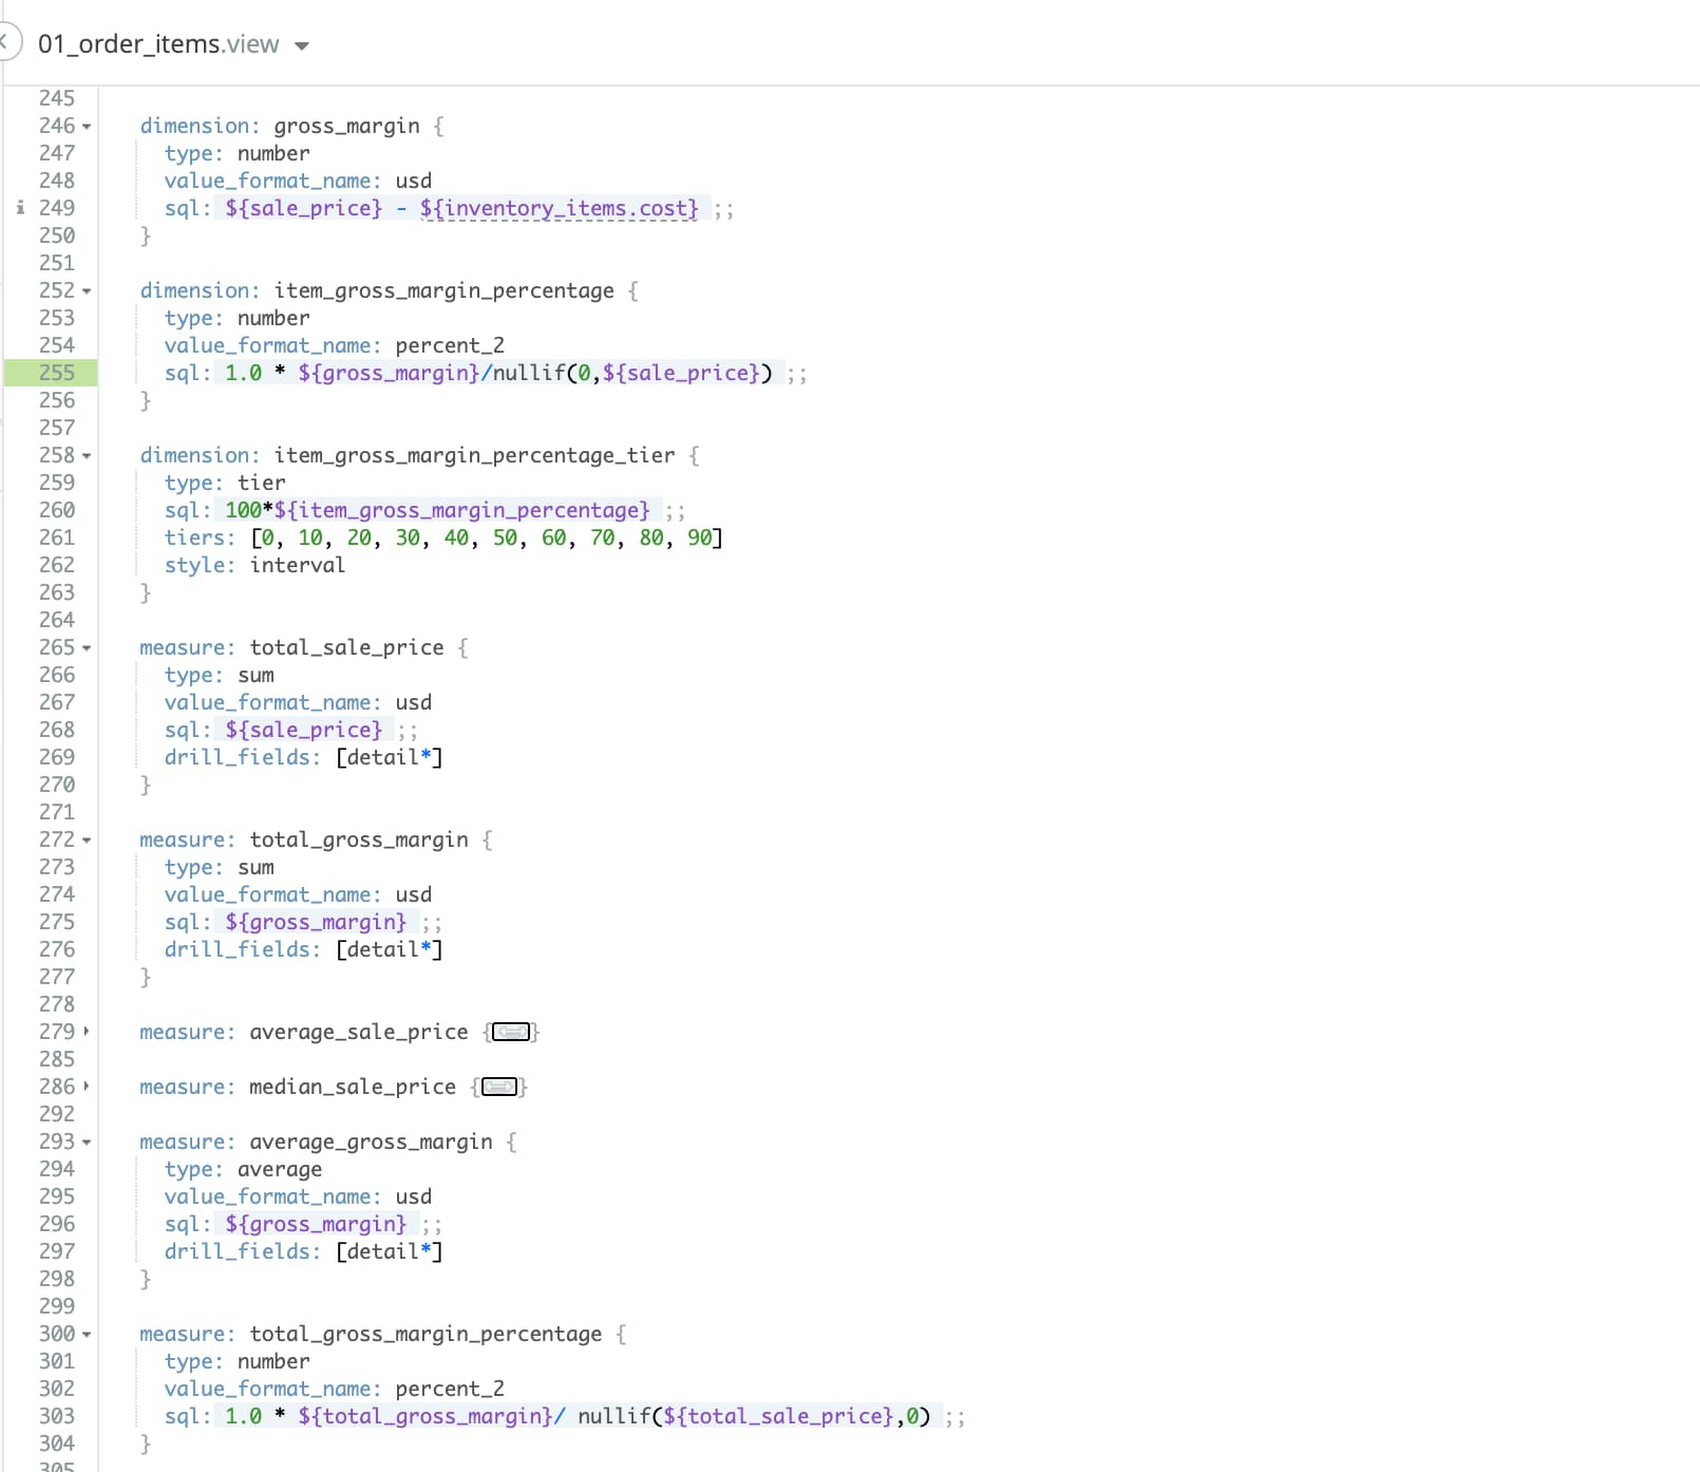
Why this matters: Centralizing the definition of a metric decreases the likelihood of introducing human error that can potentially break data pipelines, and reduces the demand on the SQL engine by not having to run the same SQL statement every time you want to reference gross margin. Most importantly, it ensures there’s a single, standard definition of gross margin across the business under the hood, hiding that complexity from downstream users.
Data analysts
Who are you: You are the people that companies rely on to verify that an analysis is accurate. Your title is something along the lines of "data analyst" or “business analyst,” and you know the intricacies of the data that lie behind these analyses. Your colleagues trust and rely on you to make sure they are interpreting the data correctly.How LookML helps: LookML empowers data professionals to empower others. It allows you to document your extensive knowledge of the data, pre-define common aggregations to prevent misuse, and provide your colleagues with a trusted layer of data definitions that allows them to focus on their individual analysis. LookML can reduce the number of chats, emails, and calls that you get, since it gives users a central repository of information about the data where they can get answers directly.
Here's an example: Data analysts are regularly asked to develop a one-off analysis that can answer a question that either doesn't come up very often, or needs to be answered in a certain way. This ends up consuming time that could be spent on higher-impact projects.
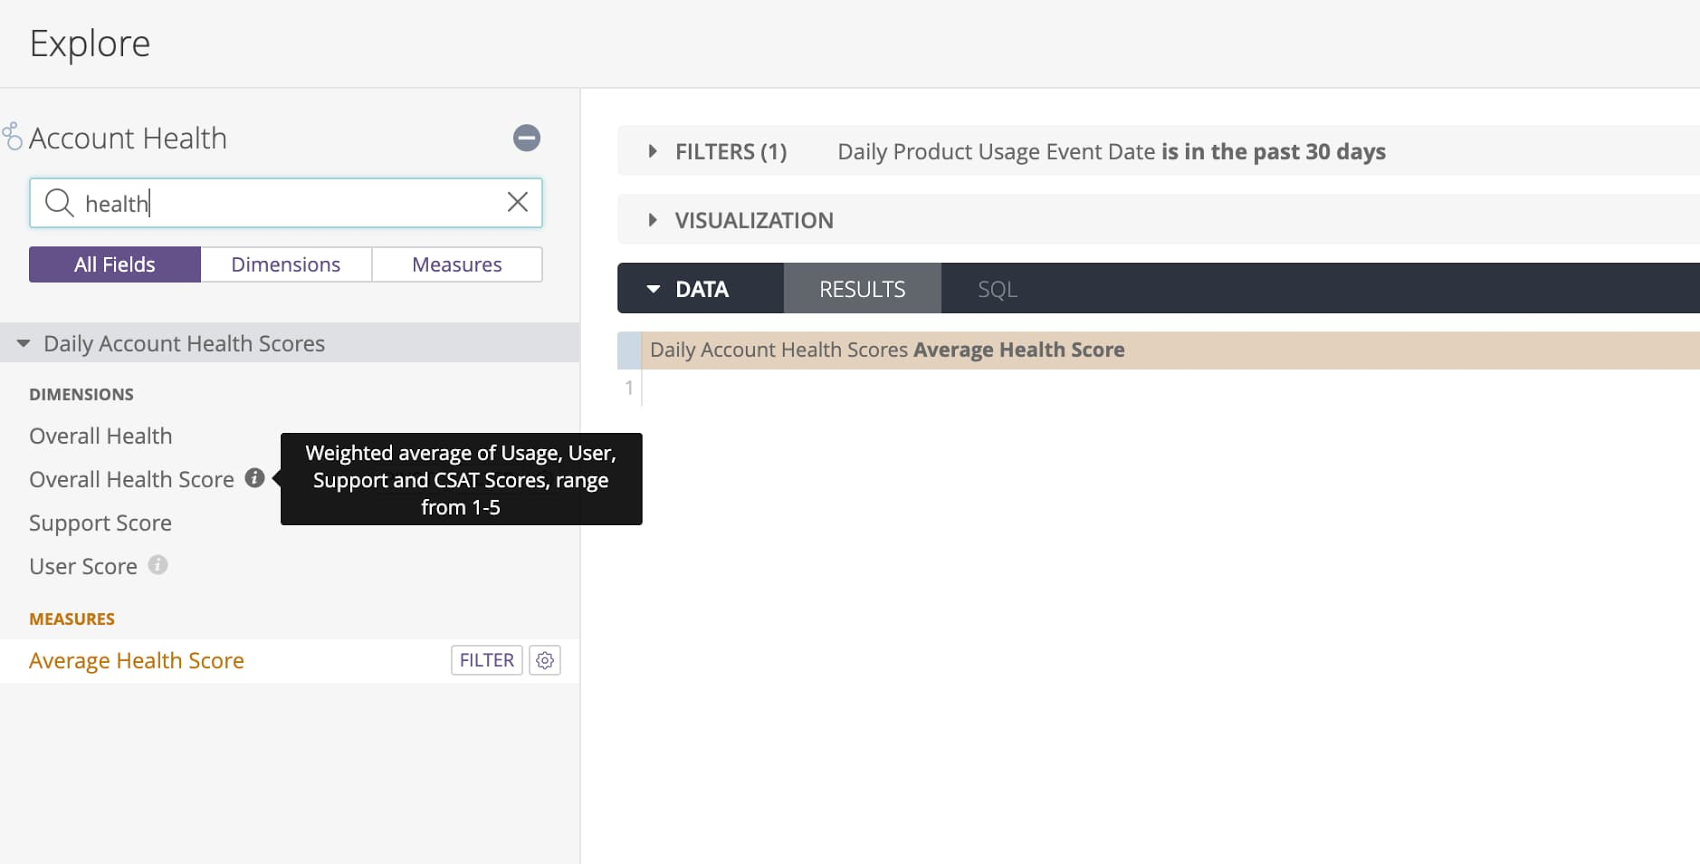
LookML helps analysts expose key metrics, so users can do their own analysis without having to worry about whether they are calculated consistently. This means that everyone across the business gets a single source of truth for their data. Let's look at an example from the healthcare industry. Customer health score has many various definitions. It's easy for two individuals to define it differently, especially when various tools have different definitions that aren't always clear about how they calculate it.
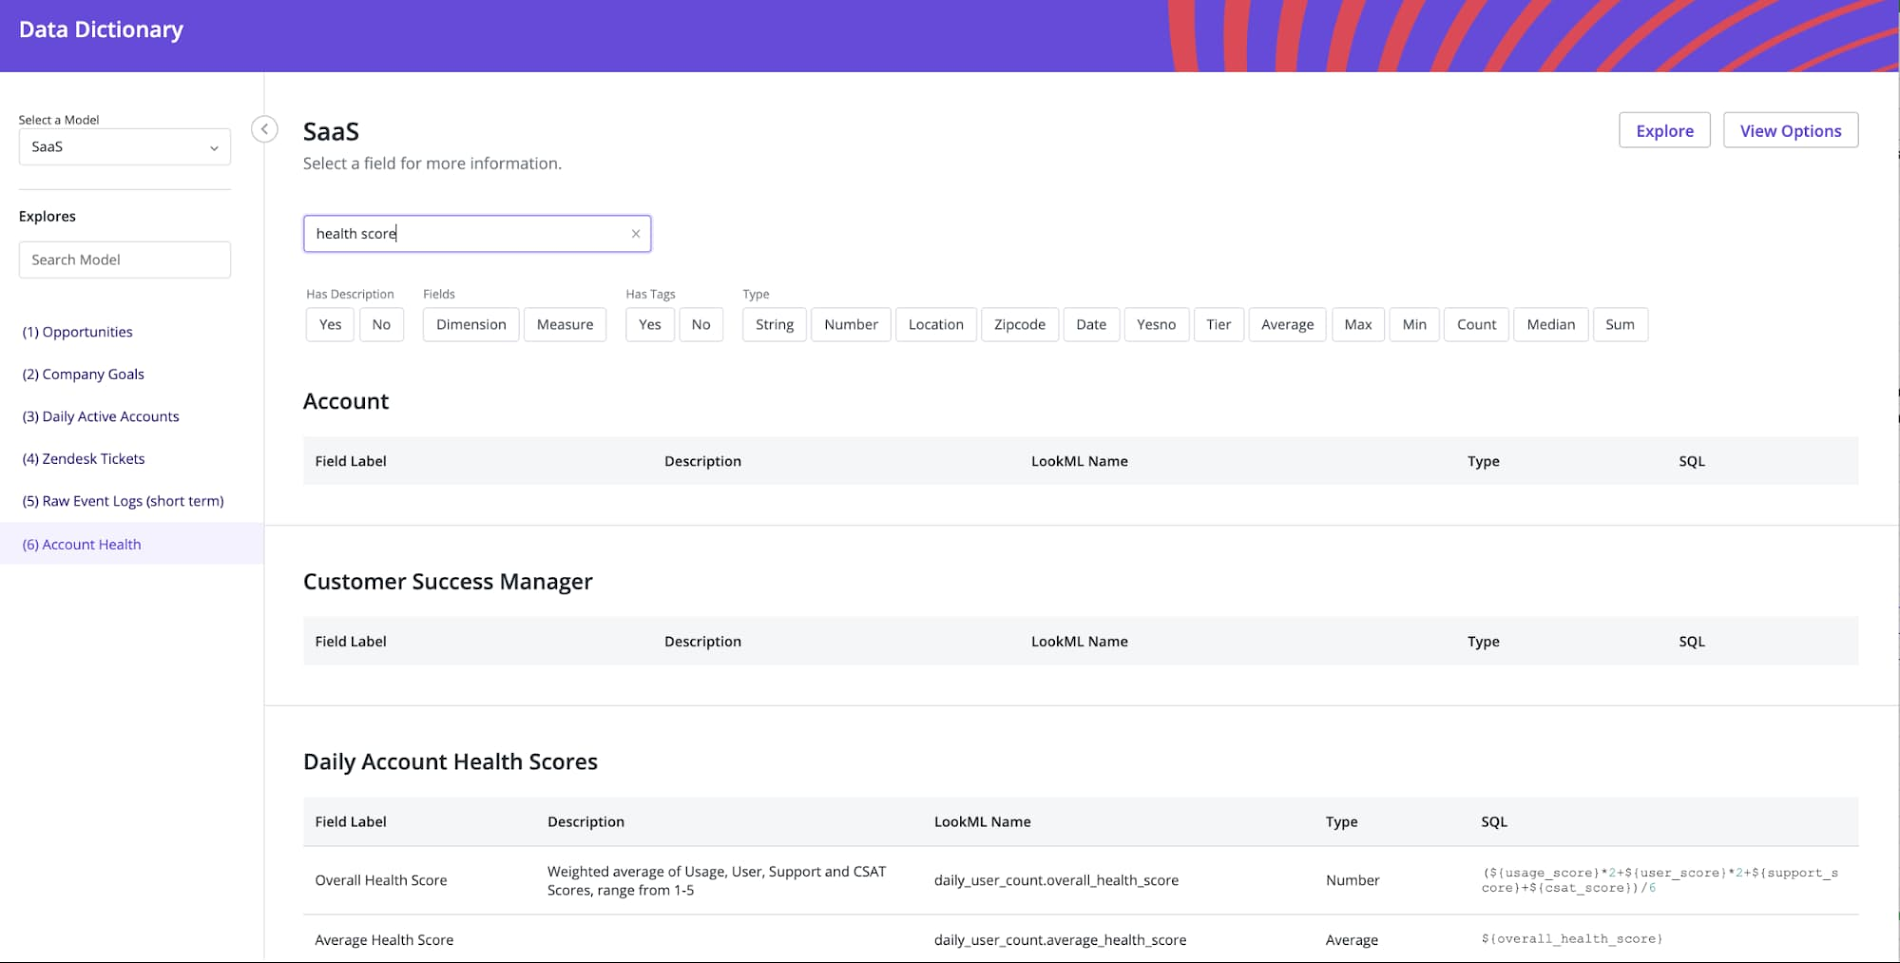
However, LookML enables you to set this definition for business users so they can dig into the trends on their own using a reliable source. It also allows developers to add comments and descriptions to help users understand how a specific metric is calculated and what assumptions were made. These custom metrics descriptions propagate in Looker's front end Explore environment as tool tips (see image below). Plus, Looker's new Data Dictionary (available for free in the Looker Marketplace) hosts all of the descriptions and SQL definitions for each metric (see image below).
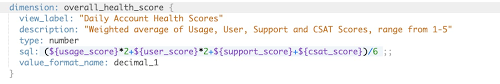
Why this matters: LookML's ability to help you communicate and collaborate with end users helps business users and decision-makers dig into the data further without having to reach out to a data analyst. Looker's Explore capabilities empowers those users to dig into the relationships in your data on their own, knowing they can trust the underlying metrics and calculations. This means that you can spend less of your time in meetings, emails, and chats explaining the analysis and its underlying assumptions, and more time analyzing data for more impactful projects.
IT security
Who are you: You make sure that those who are supposed to access data can, and those who aren't supposed to cannot. Your title might be "IT specialist" or "Data security specialist." You help companies comply with regulatory requirements such as HIPAA, GDPR, and CCPA, and protect customer privacy by ensuring that the company's data isn't exposed to those who don't have a need for access.How LookML helps: LookML is built for today's complex data. It allows you to provide access to those who need it and deny access to those who do not without having to create and manage separate dimensions, dashboards, or instances of Looker. LookML's implementation of the open-source template language Liquid lets you tap into Looker's user permissions to programmatically determine a user's access level. This means you can dynamically restrict a user's access to view a dimension or measure based on the user's access permissions, managed directly in LookML. These controls enable you to set row-based access filters and column hiding that is determined based on user attributes and groups within Looker and data masking, which is demonstrated in the image below. This means that data analysts only have to maintain one dashboard, instead of several, while security professionals like you can have all the tools you need to manage permissions.
Here's an example: Currently, security teams have to manage user permissions across multiple data warehouses, each of which has their own permissions and definitions. Not only is this cumbersome, but it adds an unnecessary layer of complication to try to get the right permissions from each individual product that you need to provide only the right data to users.
LookML support for Liquid SQL helps simplify this entire process. It directly connects to Looker's user permissions, where you can set attributes and roles for each individual user. This example looks at a retail banking use case, where an individual may need to see a customer's full credit card number. Instead of having to manage column-level permissions across multiple warehouses, LookML's Liquid SQL enables Looker to dynamically determine if a user should have access to a given column based on their user attributes.
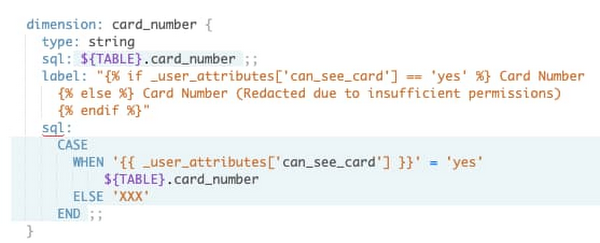
Why this matters: Managing all user access permissions in a single place saves you time and effort while reducing the risk of a mistake leading to inappropriate data access. LookML's Liquid templating means you can manage permissions right alongside the metric definition, so you know exactly what you are allowing appropriate users to access. Plus, you no longer need to determine which permissions need to be given in which data warehouse using what syntax.
Executive/CXO
Who are you: Your job is to make sure that the enterprise as a whole can use data to be more effective. Your title could be "chief data officer" or "SVP of analytics." Your job is to ensure the company runs as smoothly as possible. This means making sure that metrics are measured and reported uniformly across the business.
How LookML helps: Data warehousing technology and needs have evolved over the years. These repeated paradigm shifts have left many enterprises with data stored in different places, different structures, and with different definitions of key performance indicators. This can sometimes make it hard or impossible to compare performance between different business units. LookML lets you standardize these definitions across the business, so you can more easily analyze the success of the business. This means less duplication of work and more streamlined metrics.
Here's an example: You are constantly running between meetings, and don't always have time to dig into the data as deeply as you might prefer. This means you have to trust that the answers provided for you are comparable between different business units, so you can prioritize resources and allocate budget as effectively as possible.
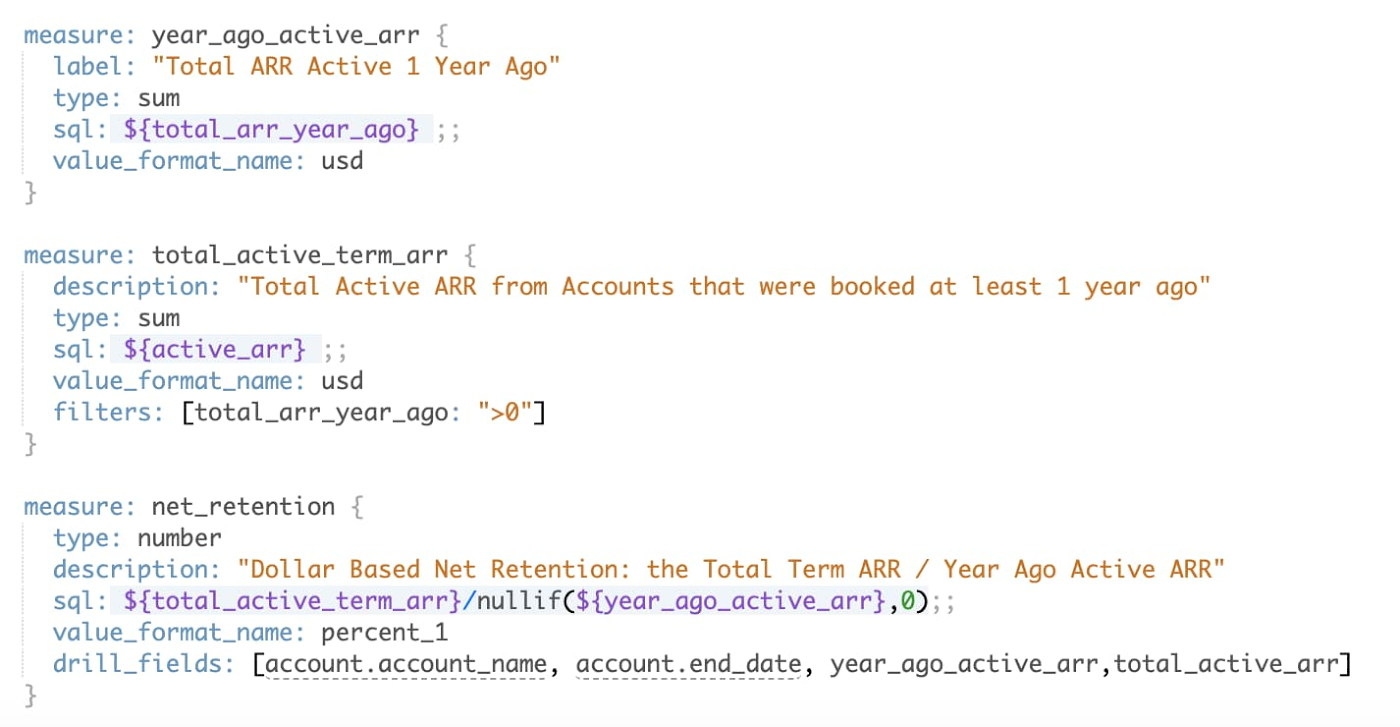
Let's look at how LookML can simplify life for software as a service (Saas) companies by calculating dollar-based net retention instead of requiring you to manipulate data in a spreadsheet and slice data in different ways. The importance of this metric, often presented at board meetings and during investor meetings, means there is incredible pressure to make sure it is accurate—every time. LookML allows you to define the metric once and never have to worry about it again, eliminating redundant effort between your teams. Plus, Looker can send you the results of the analysis on a scheduled basis in the format you need, whether it's an emailed PDF for a quick review or a Google Sheet where you can dig in deeper or automatically update your slide deck for your next presentation.
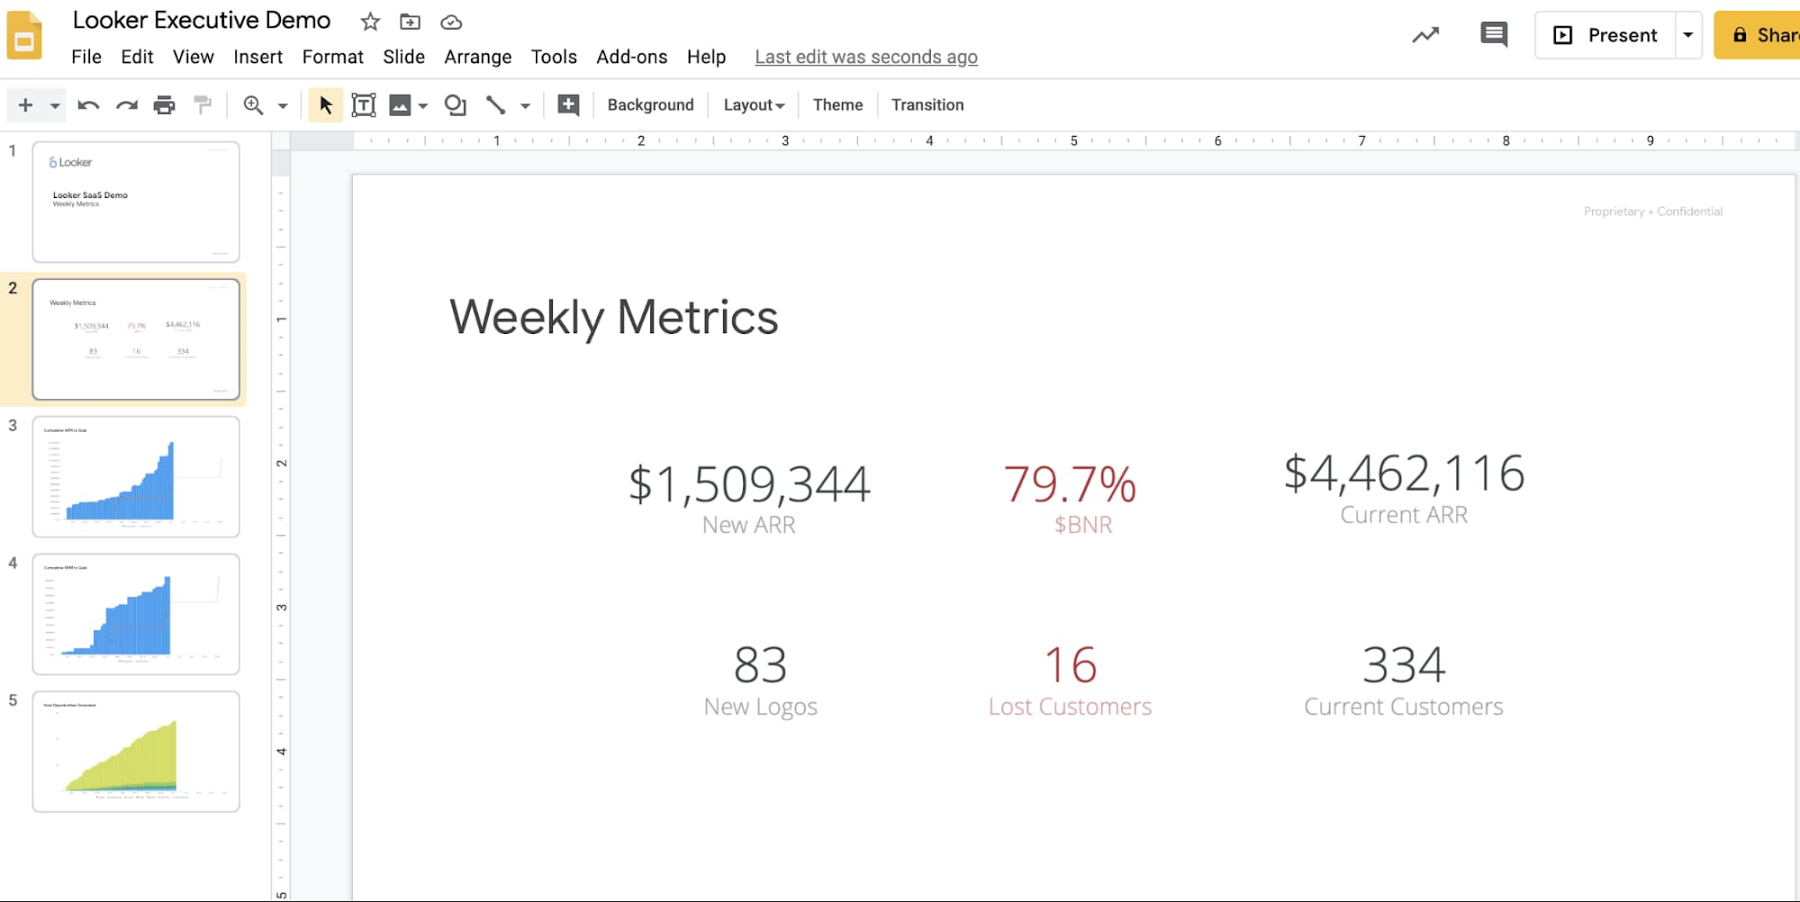
Why this matters: All of this automation saves you time and hassle, making it easier for you to stay on top of your business. You never have to worry about data freshness, no matter where you are reviewing the data. More importantly, it means that your teams no longer have to duplicate the same work across the entire business. This saves you time and ensures that you are receiving the most streamlined, consistent updates.
Operations
Who are you: Your job is to oversee the day-to-day operations of the business. Your title might be "operations manager" or "customer support director." You care about understanding the high-level trends, but need to be able to dive down into the details of the data at a moment’s notice.
How LookML helps: LookML is built for today's complex data. The business segments you oversee are complex, and the data they produce reflects that. While high-level trends are valuable, a single abstraction or aggregation of the data will never fully communicate the intricacies you need to know to succeed. LookML's ability to define how you want to drill down into your data gives you access to the details you need and can help you take action from the dashboard. When combined with Looker’s architecture, it gives access to the full, row-level data, not just extracts. You get all the tools you need to understand anomalies and important trends in your data.
Here's an example: You need to know the in-depth details about every part of the business you oversee, but can't spend all day meeting with your teams to get them. While a dashboard with aggregated trends helps you know where to focus your energy, it'll never be enough detail for you to take meaningful action to correct any potential problems and communicate with your teams or customers.
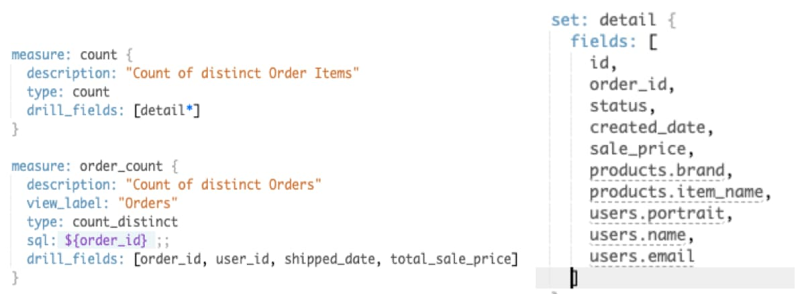
The images below demonstrate how LookML can be used to help a retail operations or customer support team lead. The first two show how LookML can be used to define drill_fields on a dashboard. This allows a user to click on an aggregated metric, such as number of orders, to see a table with the specified fields of each data row that makes up the aggregation. You can also drill down to a separate dashboard that has more detail for a given metric.
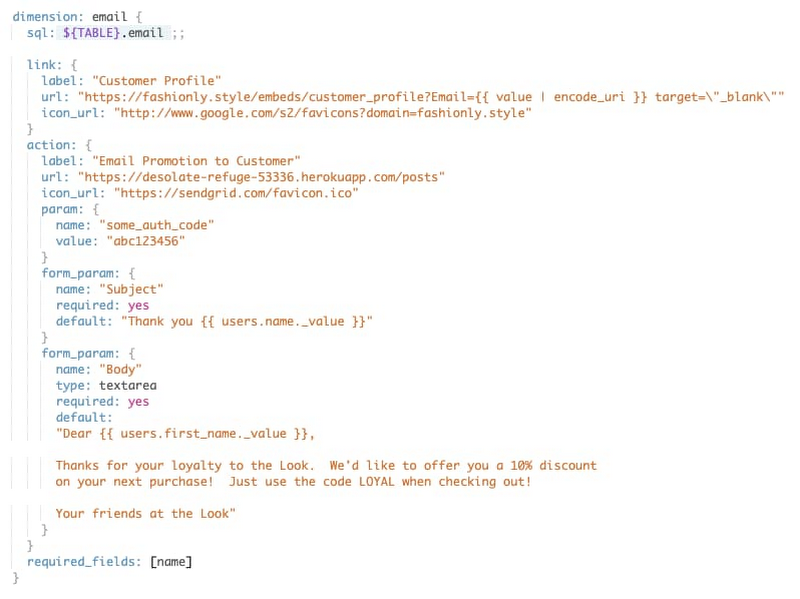
The final image shows how an action can be defined in LookML as well. This makes Looker's drill-down capabilities even more powerful. An action can be defined on a given field to allow you to take action while examining the data without having to leave Looker. In this case, the action defined can send a promotional email to a customer when the data viewer clicks on the user’s email address. You can define any number of actions as appropriate for your data.
Why this matters: These capabilities let you see exactly the information you need, find more detail when you need it, and take action immediately. This removes dependencies on others and frees up your team's time and energy to focus on the most important projects. It also lets you engage and take action directly from the insights you uncover in your data, allowing you to operate more efficiently.
If you're interested in learning more about how LookML can support your BI workflows, check out the LookML documentation or join our deep-dive Looker session during Google Cloud Next ‘20: OnAir. If you're ready to get started taking advantage of LookML's unique capabilities, sign up for a free trial.