How Bayer Crop Science uses BigQuery and geobeam to improve soil health
Aswin Ramakrishnan
Sr. Data Engineer at Bayer Crop Science
Travis Webb
Google Cloud Solution Architect
Bayer Crop Science uses Google Cloud to analyze billions of acres of land to better understand the characteristics of the soil that produces our food crops. Bayer’s teams of data scientists are leveraging services from across Google Cloud to load, store, analyze, and visualize geospatial data to develop unique business insights. And because much of this important work is done using publicly-available data, you can too!
Agencies such as the United States Geological Survey (USGS), National Oceanic and Atmospheric Administration (NOAA), and the National Weather Service (NWS) perform measurements of the earth’s surface and atmosphere on a vast scale, and make this data available to the public. But it is up to the public to turn this data into insights and information. In this post, we’ll walk you through some ways that Google Cloud services such as BigQuery and Dataflow make it easy for anyone to analyze earth observation data at scale.
Bringing data together
First, let’s look at some of the datasets we have available. For this project, the Bayer team was very interested in one dataset in particular from ISRIC, a custodian of global soil information. ISRIC maps the spatial distribution of soil properties across the globe, and collects soil measurements such as pH, organic matter content, nitrogen levels, and much more. These measurements are encoded into “raster” files, which are large images where each pixel represents a location on the earth, and the “color” of the pixel represents the measured value at that location. You can think of each raster as a layer, which typically corresponds to a table in a database. Many earth observation datasets are made available as rasters, and they are excellent for storage of gridded data such as point measurements, but it can be difficult to understand spatial relationships between different areas of a raster, and between multiple raster tiles and layers.
Processing data into insights
To help with this, Bayer used Dataflow with geobeam to do the heavy-lifting of converting the rasters into vector data by turning them into polygons, reprojecting them to the WGS 84 coordinate system used by BigQuery, and generating h3 indexes to help us connect the dots -- literally. Polygonization in particular is a very complex operation and its difficulty scales exponentially with file size, but Dataflow is able to divide and conquer by splitting large raster files into smaller blocks and processing them in parallel at massive scale. You can process any amount of data this way, at a scale and speed that is not possible on any single machine using traditional GIS tools. What’s best is that this is all done on the fly with minimal custom programming. Once the raster data is polygonized, reprojected, and fully discombobulated, the vector data is written directly to BigQuery tables from Dataflow.
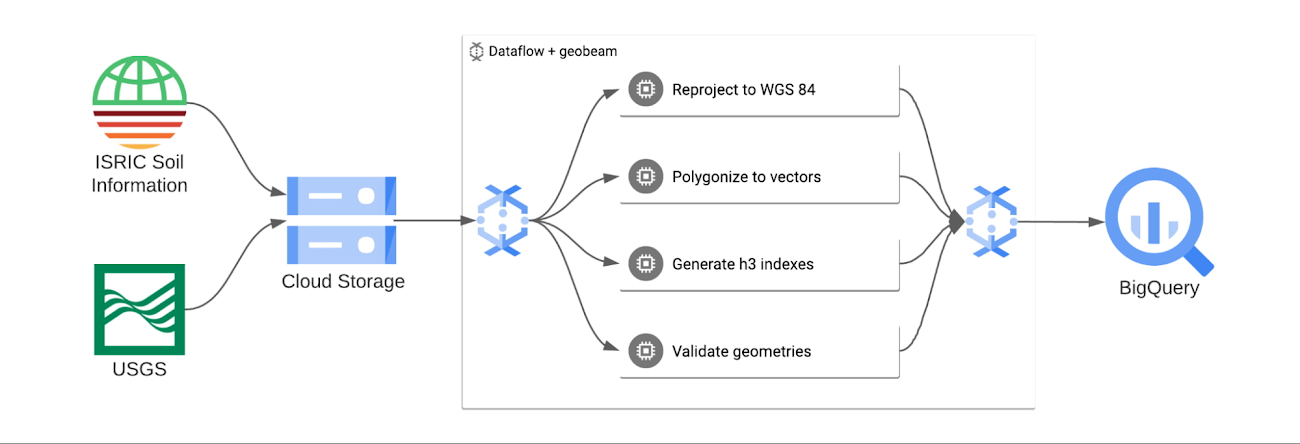
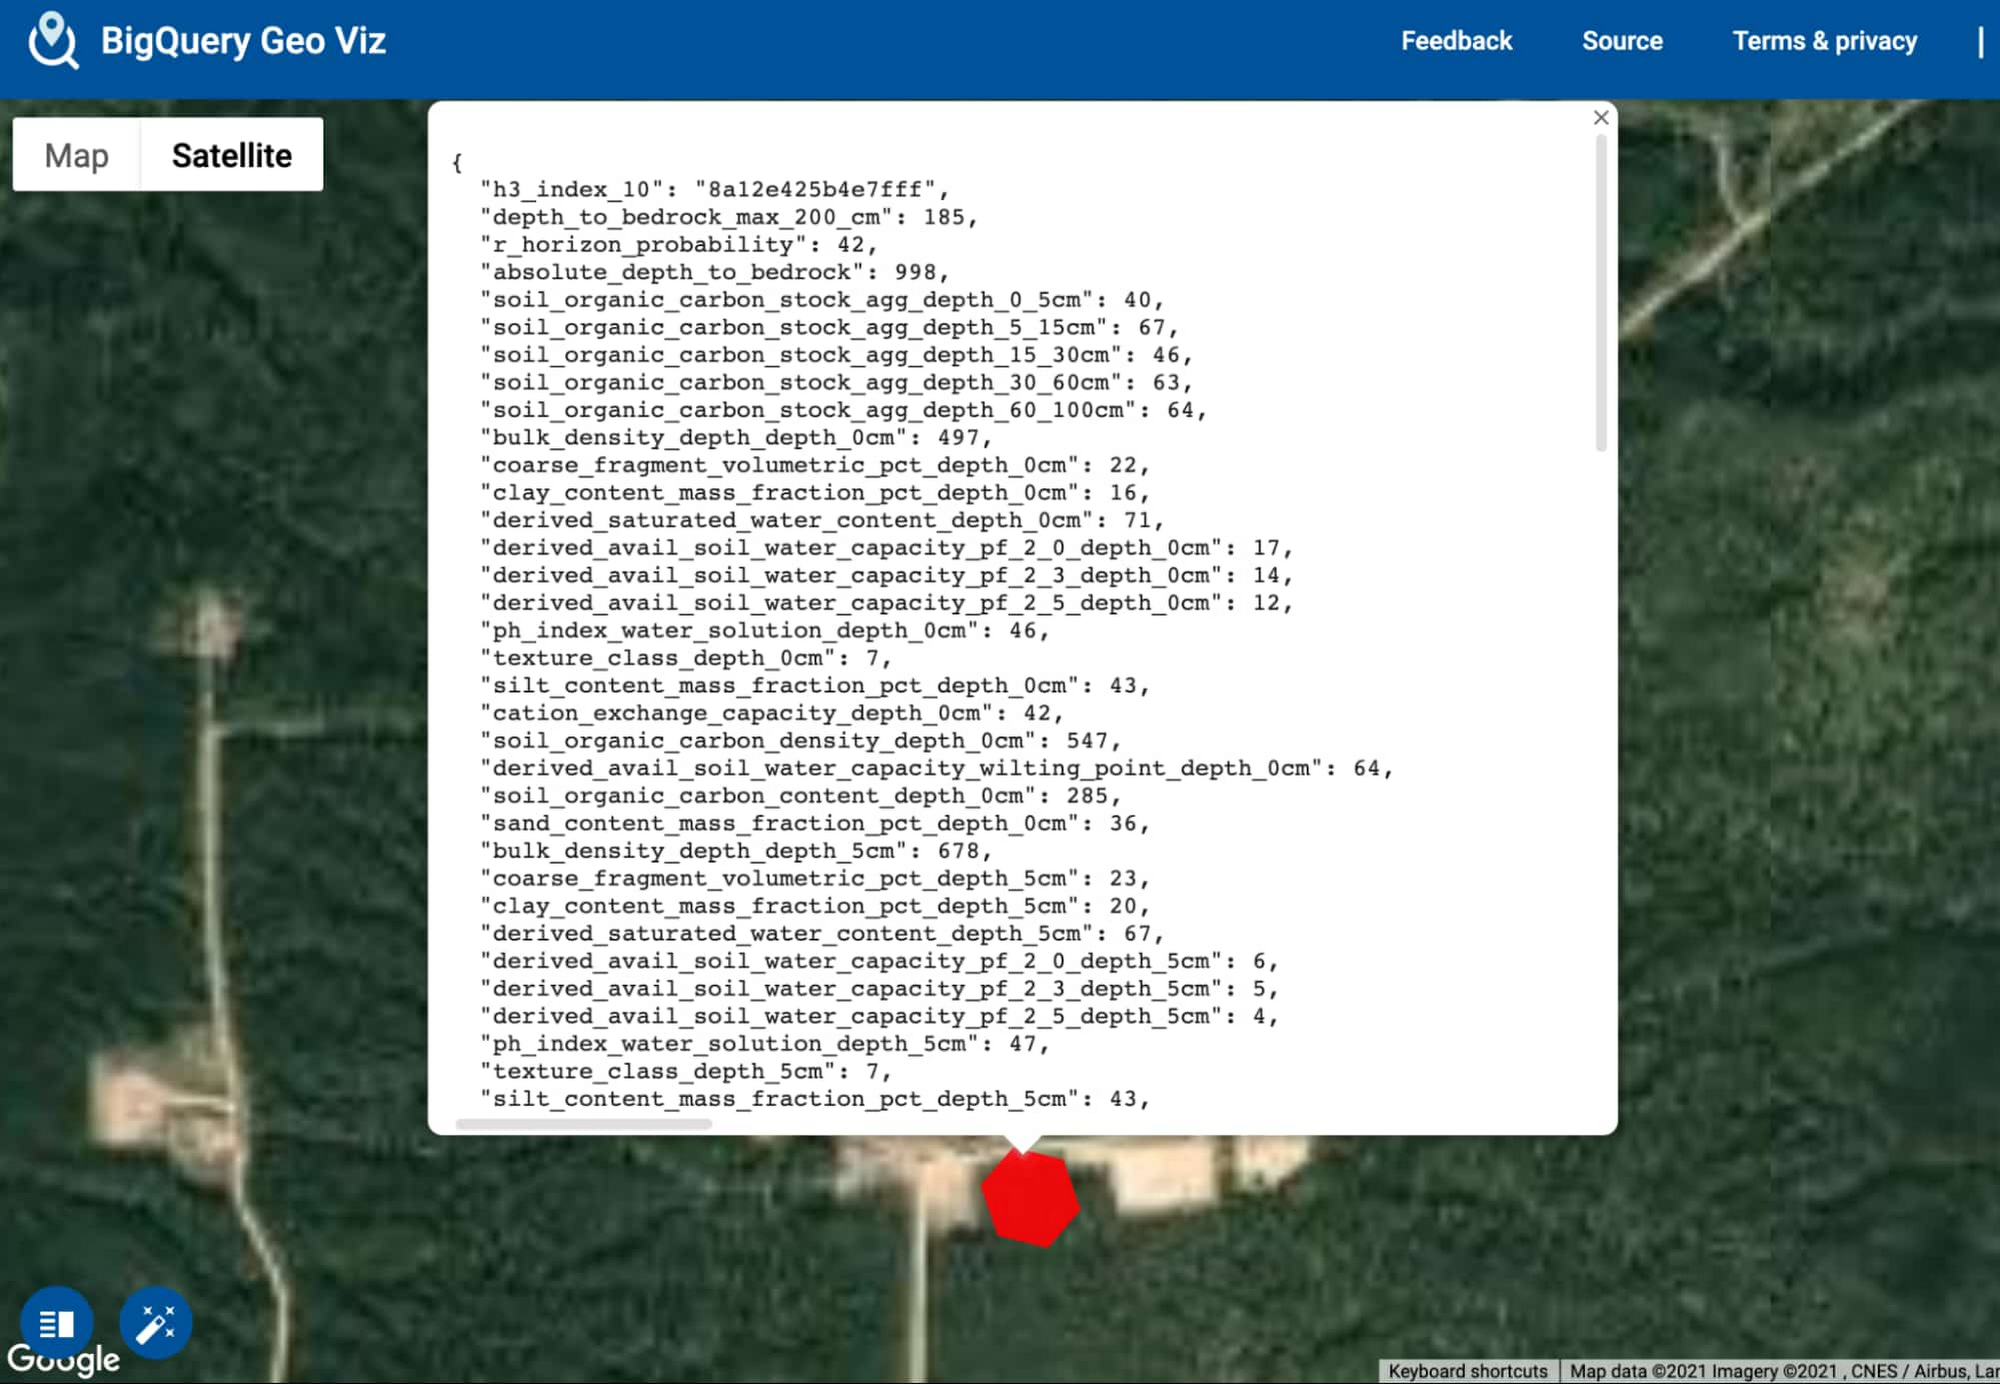
Once the data is loaded into BigQuery, Bayer uses BigQuery GIS and the h3 indexes computed by geobeam to join the data across multiple tables and create a single view of all of their soil layers. From this single view, Bayer can analyze the combined data, visualize all the layers at once using BigQuery GeoViz, and apply machine learning models to look for patterns that humans might not see
Using geospatial insights to improve the business
The soil grid data is essential to help characterize the soil characteristics of the crop growth environments experienced by Bayer’s customers. Bayer can compute soil environmental scenarios for global crop lands to better understand what their customers experience in order to aid in testing network optimization, product characterization, and precision product design. It also impacts Bayer's real-world objectives by enabling them to characterize the soil properties of their internal testing network fields to help establish a global testing network and enable environmental similarity calculations and historical modeling.
It’s easy to see why developing spatial insights for planting crops is game-changing for Bayer Crop Sciences, and these same strategies and tools can be used across a variety of industries and businesses.
Google’s mission is to organize the world’s information and make it universally accessible and useful, and we’re excited to work with customers like Bayer Crop Sciences who want to harness their data to build products that are beneficial to their customers and the environment. To get started building amazing geospatial applications for your business, check out our reference guide to learn more about geospatial capabilities in Google Cloud, and open BigQuery in the Google Cloud console to get started using BigQuery and geobeam for your geospatial workloads.