Export Google Cloud data into Elastic Stack with Dataflow templates
Roy Arsan
Cloud Solutions Architect, Google
Brendan Foley
Customer Engineer
At Google Cloud, we’re focused on solving customer problems while supporting a thriving partner ecosystem. Many of you use third-party monitoring solutions to keep a tab on your multi-cloud or hybrid cloud environments, be it for IT operations, security operations, application performance monitoring, or cost analysis. At the same time, you’re looking for a cloud-native way to reliably export your Google Cloud logs, events, and alerts at scale.
As part of our efforts to expand the set of purpose-built Dataflow templates for these common data movement operations, we launched three Dataflow templates to export Google Cloud data into your Elastic Cloud or your self-managed Elasticsearch deployment: Pub/Sub to Elasticsearch (streaming), Cloud Storage to Elasticsearch (batch) and BigQuery to Elasticsearch (batch).
In this blog post, we’ll show you how to set up a streaming pipeline to export your Google Cloud logs to Elastic Cloud using the Pub/Sub to Elasticsearch Dataflow template. Using this Dataflow template, you can forward to Elasticsearch any message that can be delivered to a Pub/Sub topic, including logs from Cloud Logging or events such as security findings from Cloud Security Command Center.
The step-by-step walkthrough covers the entire setup, from configuring the originating log sinks in Cloud Logging, to setting up Elastic integration with GCP in Kibana UI, to visualizing GCP audit logs in a Kibana dashboard.
Push vs. Pull
Traditionally, Elasticsearch users have the option to pull logs from Pub/Sub topics into Elasticsearch via Logstash or Beats as a data collector. This documented solution works well, but it does include tradeoffs that need to be taken into account:
Requires managing one or more data collectors with added operational complexity for high availability and scale-out with increased log volume
Requires external resource access to Google Cloud by giving permissions to aforementioned data collectors to establish subscription and pull data from one or more Pub/Sub topics.
We’ve heard from you that you need a more cloud-native approach that streams logs directly into your Elasticsearch deployment without the need to manage an intermediary fleet of data collectors. This is where the managed Cloud Dataflow service comes into play: A Dataflow job can automatically pull logs from a Pub/Sub topic, parse payloads and extract fields, apply an optional JavaScript user-defined function (UDF) to transform or redact the logs, then finally forward to the Elasticsearch cluster.
Set up logging export to Elasticsearch
This is how the end-to-end logging export looks:
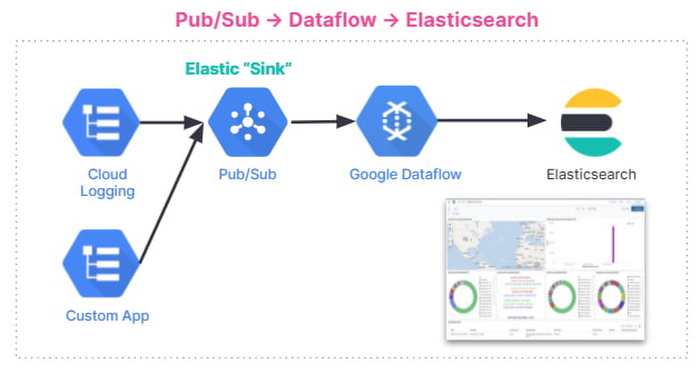

Below are the steps that we’ll walk through:
Set up Pub/Sub topics and subscriptions
Set up a log sink
Set IAM policy for Pub/Sub topic
Install Elastic GCP integration
Create API key for Elasticsearch
Deploy Pub/Sub to the Elastic Dataflow template
View and analyze GCP logs in Kibana
Set up Pub/Sub topics and subscriptions
First, set up a Pub/Sub topic that will receive your exported logs, and a Pub/Sub subscription that the Dataflow job can later pull logs from. You can do so via the Cloud Console or via CLI using gcloud. For example, using gcloud looks like this:
Note: It is important to create the subscription before setting up the Cloud Logging sink to avoid losing any data added to the topic prior to the subscription getting created.
Repeat the same steps for the Pub/Sub deadletter topic that holds any undeliverable message, due to pipeline misconfigurations (e.g. wrong API key) or inability to connect to Elasticsearch cluster:
Set up a Cloud Logging sink
Create a log sink with the previously created Pub/Sub topic as destination. Again, you can do so via the Logs Viewer, or via CLI using gcloud logging. For example, to capture all logs in your current Google Cloud project (replace [MY_PROJECT]), use this code:
Note: To export logs from all projects or folders in your Google Cloud organization, refer to aggregated exports for examples of “gcloud logging sink” commands. For example, provided you have the right permissions, you may choose to export Cloud Audit Logs from all projects into one Pub/Sub topic to be later forwarded to Elasticsearch.
The output of this last command is similar to this:
Take note of the service account [LOG_SINK_SERVICE_ACCOUNT] returned. It typically ends with @gcp-sa-logging.iam.gserviceaccount.com.
Set IAM policy for Pub/Sub topic
For the sink export to work, you need to grant the returned sink service account a Cloud IAM role so it has permission to publish logs to the Pub/Sub topic:
If you created the log sink using the Cloud Console, it will automatically grant the new service account permission to write to its export destinations, provided you own the destination. In this case, it’s Pub/Sub topic my-logs.
Install Elastic GCP integration
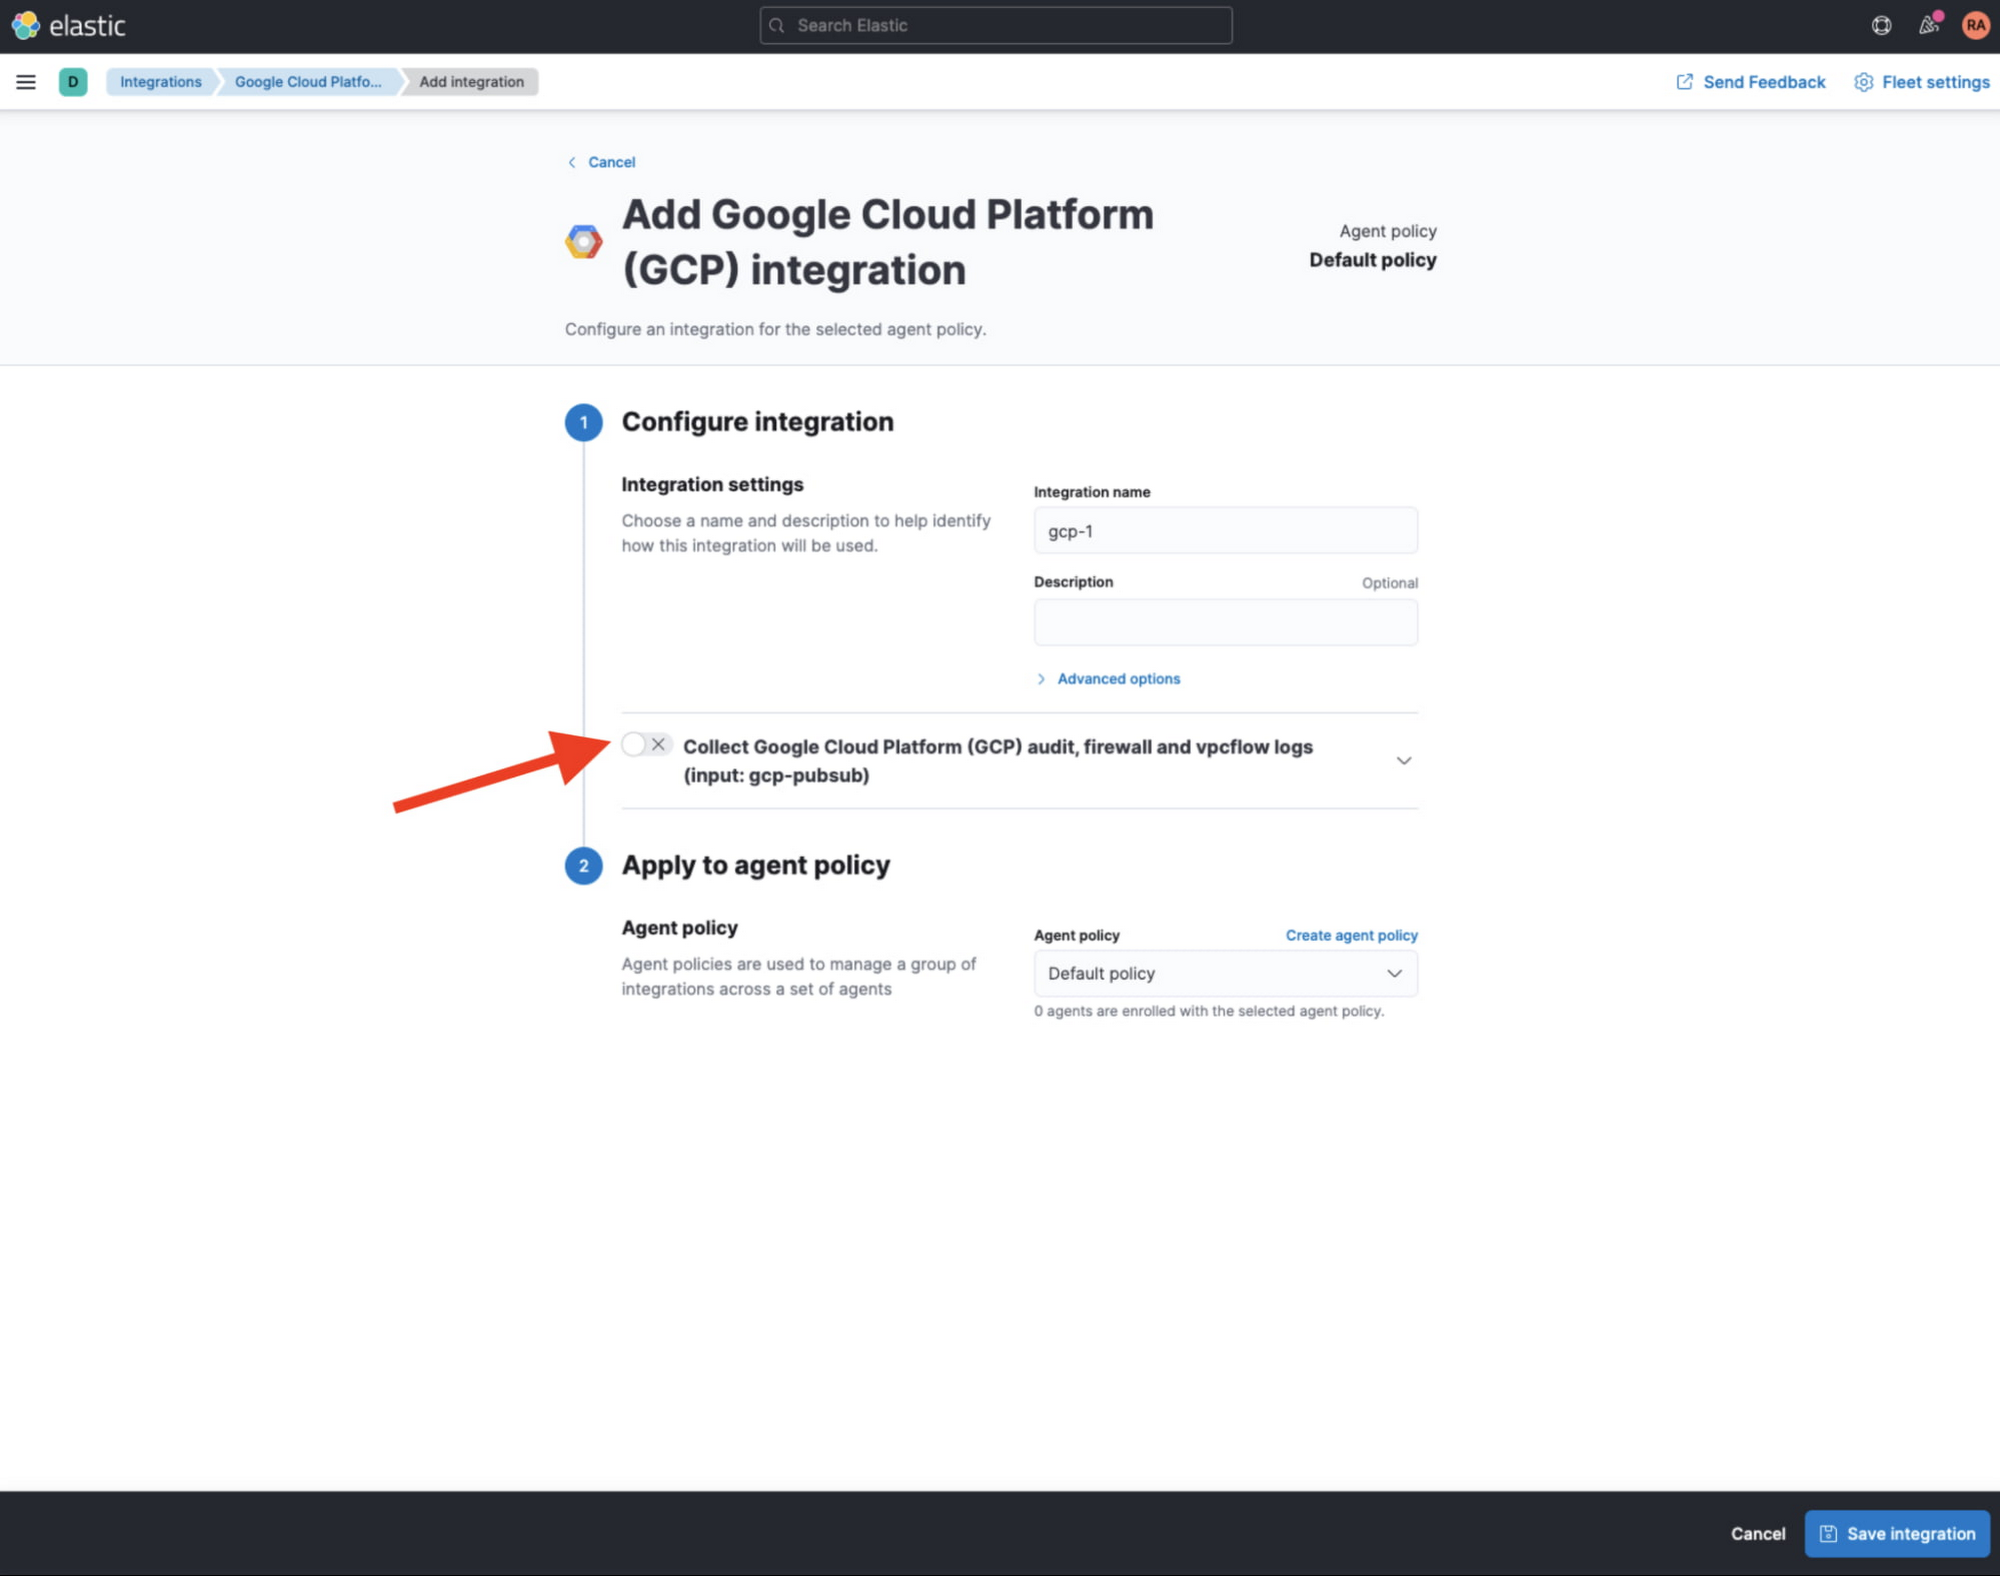
From Kibana web UI, navigate to ‘Integrations’ and search for GCP. Select ‘Google Cloud Platform (GCP)’ integration, then click on ‘Add Google Cloud Platform (GCP)’.
In the following screen, make sure to uncheck ‘Collect Google Cloud Platform (GCP) … (input: gcp-pubsub)’ since we will not rely on pollers to pull data from Pub/Sub topic, and rather on Dataflow pipeline to stream that data in.

Create API key for Elasticsearch
If you don’t already have an API key for Elasticsearch, navigate to ‘Stack Management’ > ‘API keys’ to create an API key from Kibana web UI. Refer to Elastic docs for more details on Elasticsearch API keys. Take note of the base64-encoded API key which will be used later by your Dataflow pipeline to authenticate with Elasticsearch.
Before proceeding, take also note of your Cloud ID which can be found from Elastic Cloud UI under ‘Cloud’ > ‘ Deployments’.
Deploy Pub/Sub to Elastic Dataflow pipeline
The Pub/Sub to Elastic pipeline can be executed either from the Console, gcloud CLI, or via a REST API call (more detail here). Using the Console as example, navigate to the Dataflow Jobs page, click ‘Create Job from Template’ then select “Cloud Pub/Sub to Elasticsearch” template from the dropdown menu. After filling out all required parameters, the form should look similar to this:
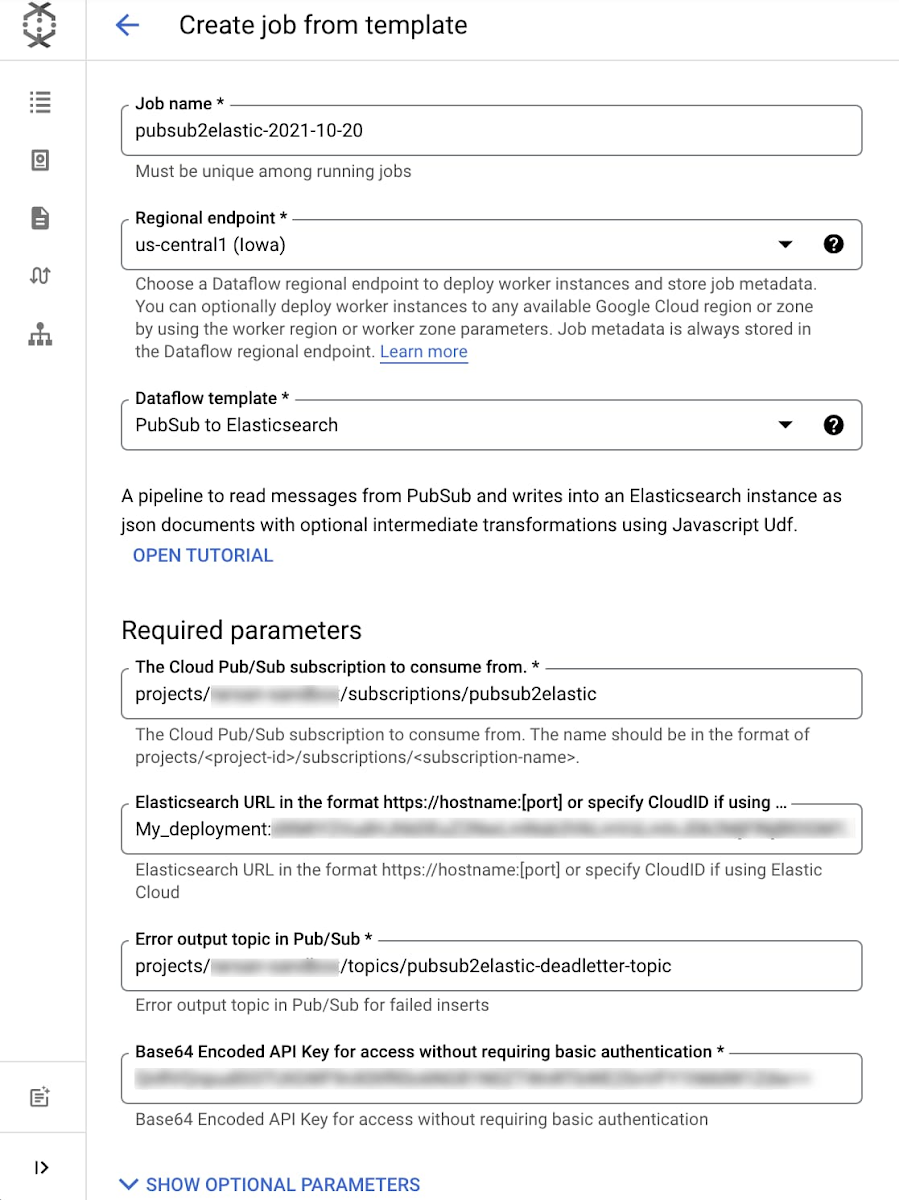

Click on ‘Show Optional Parameters’ to expand the list of optional parameters.
Enter ‘audit’ for ‘The type of logs…’ parameter to specify the type of dataset we’re sending in order to populate the corresponding GCP audit dashboard available in the GCP integration you enabled previously in Kibana:
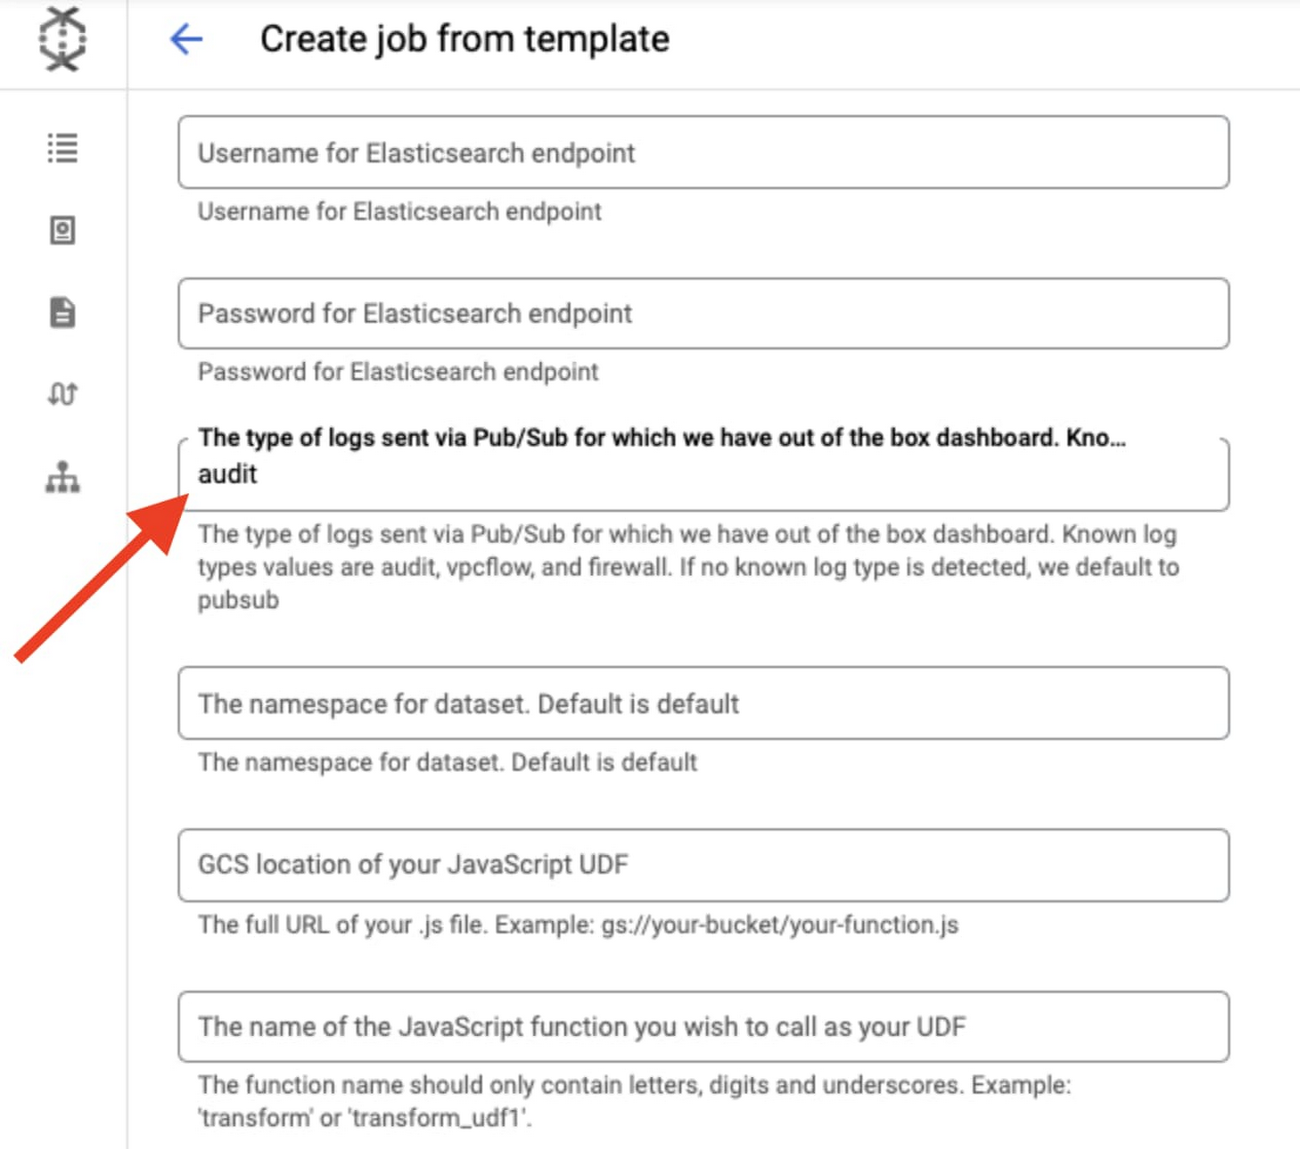

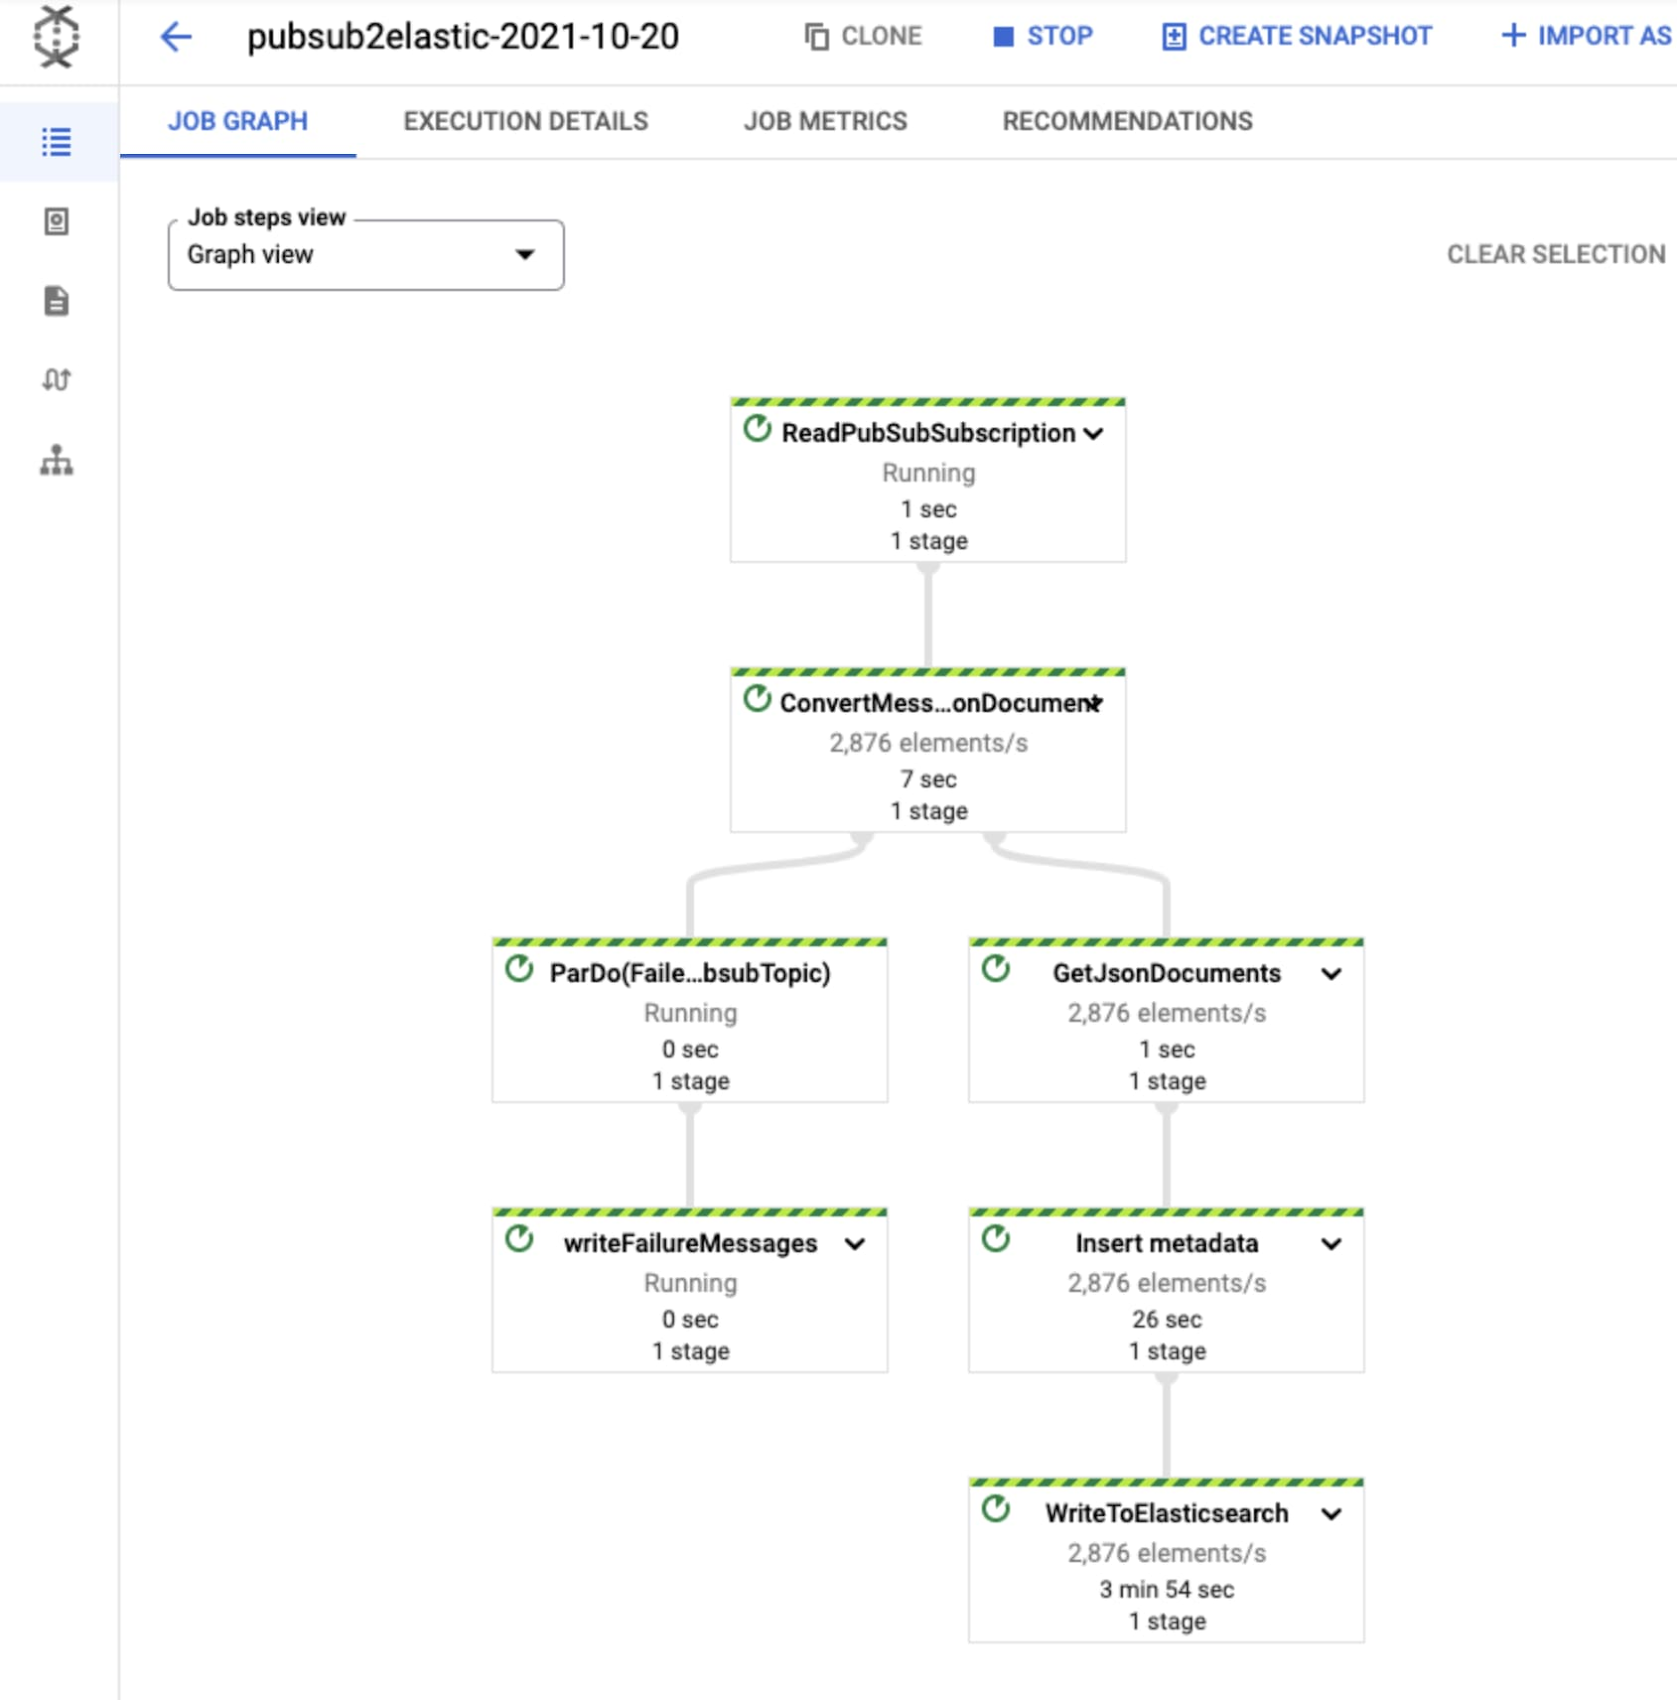
Once you click “Run job”, the pipeline will start streaming events to Elastic Cloud after a few minutes. You can visually check correct operation by clicking on the Dataflow job and selecting the “Job Graph” tab, which should look as below. In our test project, the Dataflow step WriteToElasticsearch is sending a little over 2,800 elements per second at that point in time:

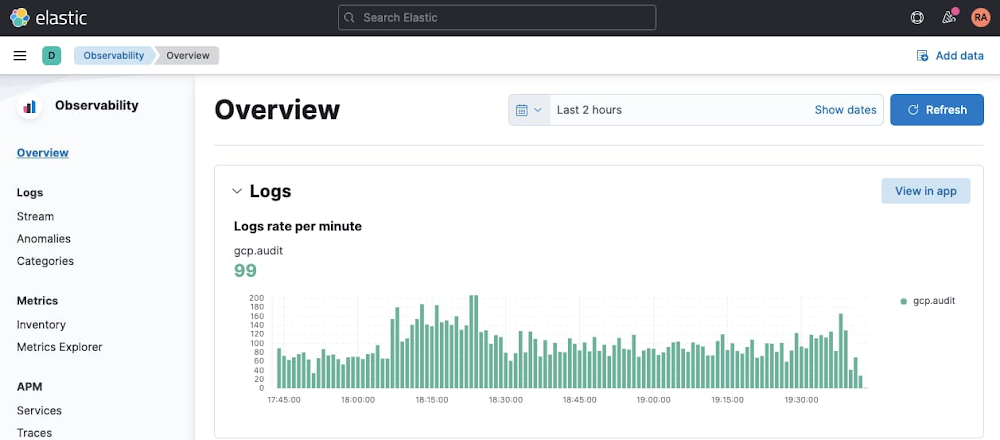
Now head over to Kibana UI, and navigate under ‘Observability’ > ‘Overview’ to quickly inspect that your GCP audit logs are being ingested in Elasticsearch:

Visualize GCP Audit logs in Kibana
You can now view Google Cloud audit logs from your Kibana UI search interface. Navigate to either ‘Observability’ > ‘Logs’ > ‘Stream’ or ‘Analytics’ > ‘ Discover’, and type the following simple query in KQL to filter for GCP audit logs only:
data_stream.dataset:”gcp.audit”
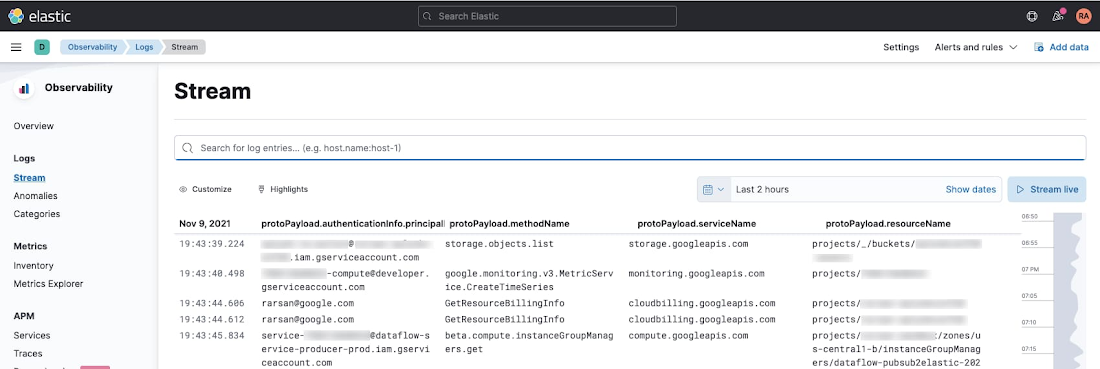

The above table was produced after selecting the following fields as columns in order to highlight who did what to which resource:
protoPayload.authenticationInfo.principalEmail- WhoprotoPayload.methodName- WhatprotoPayload.serviceName- Which (service)protoPayload.resourceName- Which (resource)
Open GCP Audit dashboard in Kibana
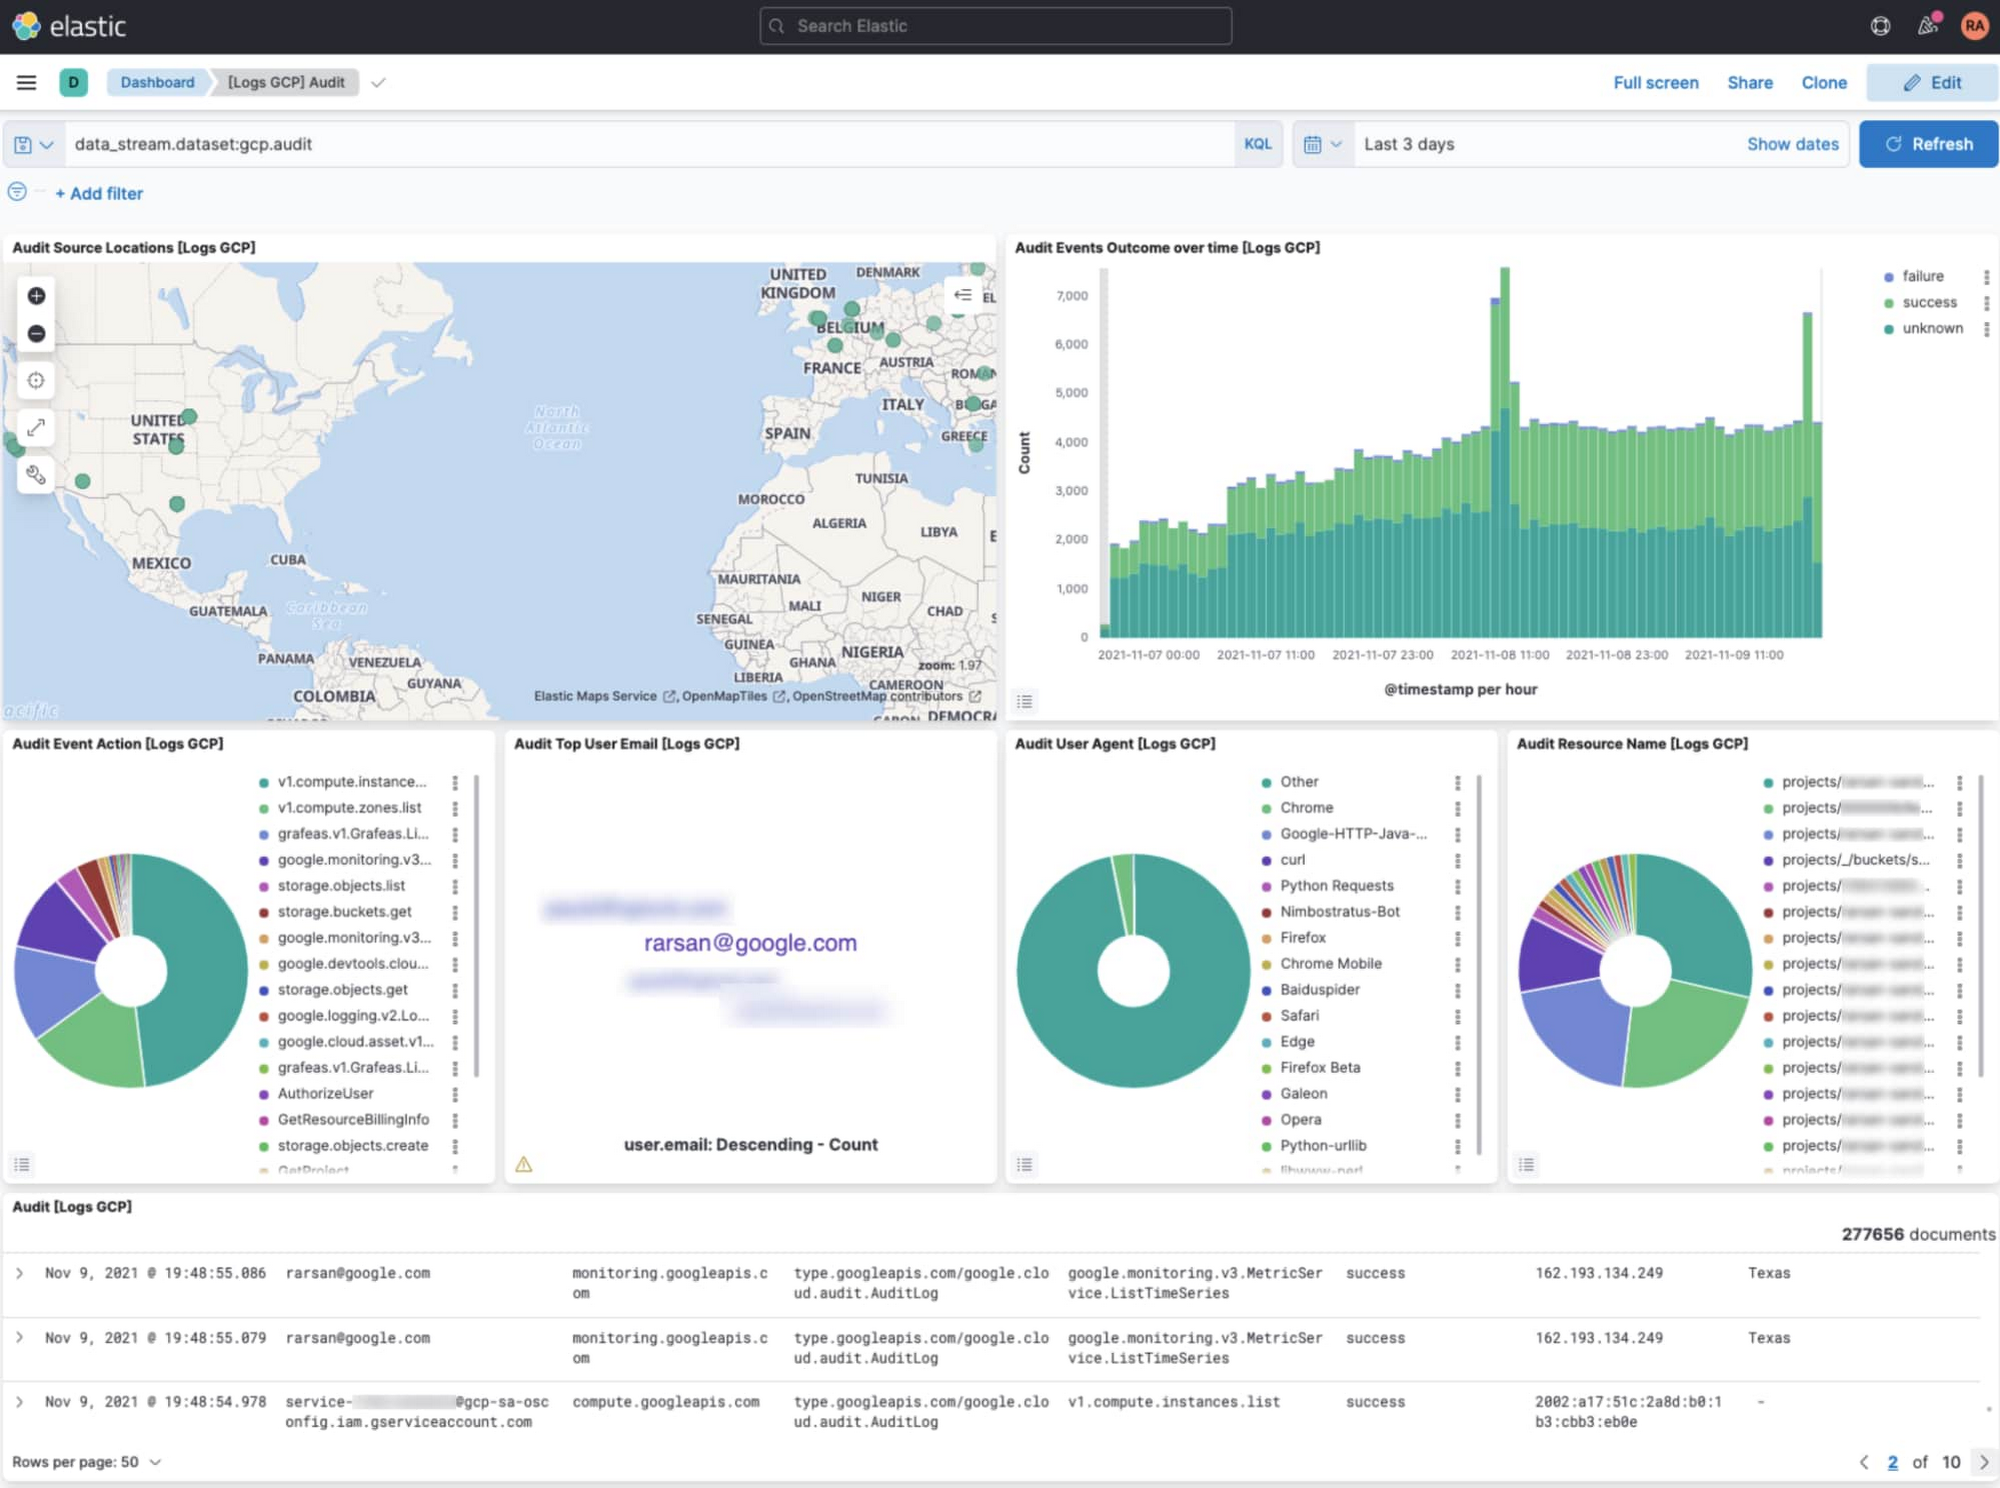
Navigate to ‘Analytics’ > ‘Dashboards’, and search for ‘GCP’. Select ‘[Logs GCP] Audit’ dashboard to visualize your GCP audit logs. Among other things, this dashboard displays a map view of where your cloud activity is coming from, a timechart of activity volume, and a breakdown of top actions and resources acted on.

But wait, there’s more!
Pub/Sub to Elasticsearch Dataflow template is meant to abstract away the heavy-lifting when it comes to reliably collecting voluminous logs in near real-time. At the same time, it offers advanced customizations to tune the pipeline to your own requirements with optional parameters such as delivery batch size (in number of messages or bytes) for throughput, retry settings (in number of attempts or duration) for fault tolerance, and a custom user-defined function (UDF) to transform the output messages before delivery to Elasticsearch. To learn more about Dataflow UDFs along with specific examples, see Extend your Dataflow templates with UDFs.
In addition to Pub/Sub to Elasticsearch Dataflow template, there are two new Dataflow templates to export to Elasticsearch depending on your use case:
Cloud Storage to Elasticsearch: Use this Dataflow template to export rows from CSV files in Cloud Storage into Elasticsearch as JSON documents.
BigQuery to Elasticsearch: Use this Dataflow template to export rows from a BigQuery table (or results from a SQL query) into Elasticsearch. This is particularly handy to forward billing data by Cloud Billing or assets metadata snapshots by Cloud Asset Inventory, both of which can be natively exported to BigQuery.
What’s next?
Refer to our user docs for the latest reference material on all Google-provided Dataflow templates including the Elastic Dataflow ones described above. We’d like to hear your feedback and feature requests. You can create an issue directly in the corresponding GitHub repo, or create a support case directly from your Cloud Console, or ask questions in our Stack Overflow forum.
To get started with Elastic Cloud on Google Cloud, you can subscribe via Google Cloud Marketplace and start creating your own Elasticsearch cluster on Google Cloud within minutes. Refer to Elastic getting started guide for step by step instructions.
Acknowledgements
We’d like to thank several contributors within and outside Google for making these Elastic Dataflow templates available for our joint customers:
Prathap Kumar Parvathareddy, Strategic Cloud Engineer, Google
Michael Yang, Product Manager, Elastic

