DeNA Sports Business: Combating COVID-19 by analyzing device data with Google Cloud
Makoto Kimura
General Manager System Dept. Sports Business Div
Yusuke Muto
Software Engineer System Dept. Sports Business Div
Editor’s note: Today we’re hearing from Makoto Kimura, General Manager System Dept. Sports Business Div; and Yusuke Muto, Software Engineer System Dept. Sports Business Div at DeNA Sports. They share how Google Cloud has helped them to keep their events going while also keeping their visitors safe during the pandemic.
The pandemic is forcing the cancelation or postponement of events in Japan and elsewhere - and requiring the organizers of events that do proceed to implement strict measures to protect attendees against infection. At DeNA Co. Ltd’s Sports Business Division, we aim to help visitors experience entertainment during the crisis while enjoying peace of mind.
To support this objective, we have developed and released an operational status visualization system that checks whether Japan’s coronavirus contact tracing app COCOA is installed on smartphones used by event attendees. By visualizing the COCOA install rate, we can help event organizers educate those visitors who do not have the app to download and use it.
To achieve the system’s required measurement capabilities, we turned to BigQuery, Google Cloud’s analytics data warehouse. We found BigQuery:
Delivers fast write times even when processing large volumes of data
Provides the flexibility to enable a range of query types; and
Supports visualization through business intelligence tools such as Looker and Data Studio.
BigQuery enabled us to expedite creation of an analytical environment so we could shift our focus quickly to developing sensor devices, while using a simple configuration to write data directly from each device using open source data collection software Fluentd. BigQuery’s pricing structure also meant we could scale cost-effectively.
In addition, BigQuery empowered us to quickly build systems to obtain insights from data derived from the positioning and beacon technology we had researched and developed in-house for a long time.
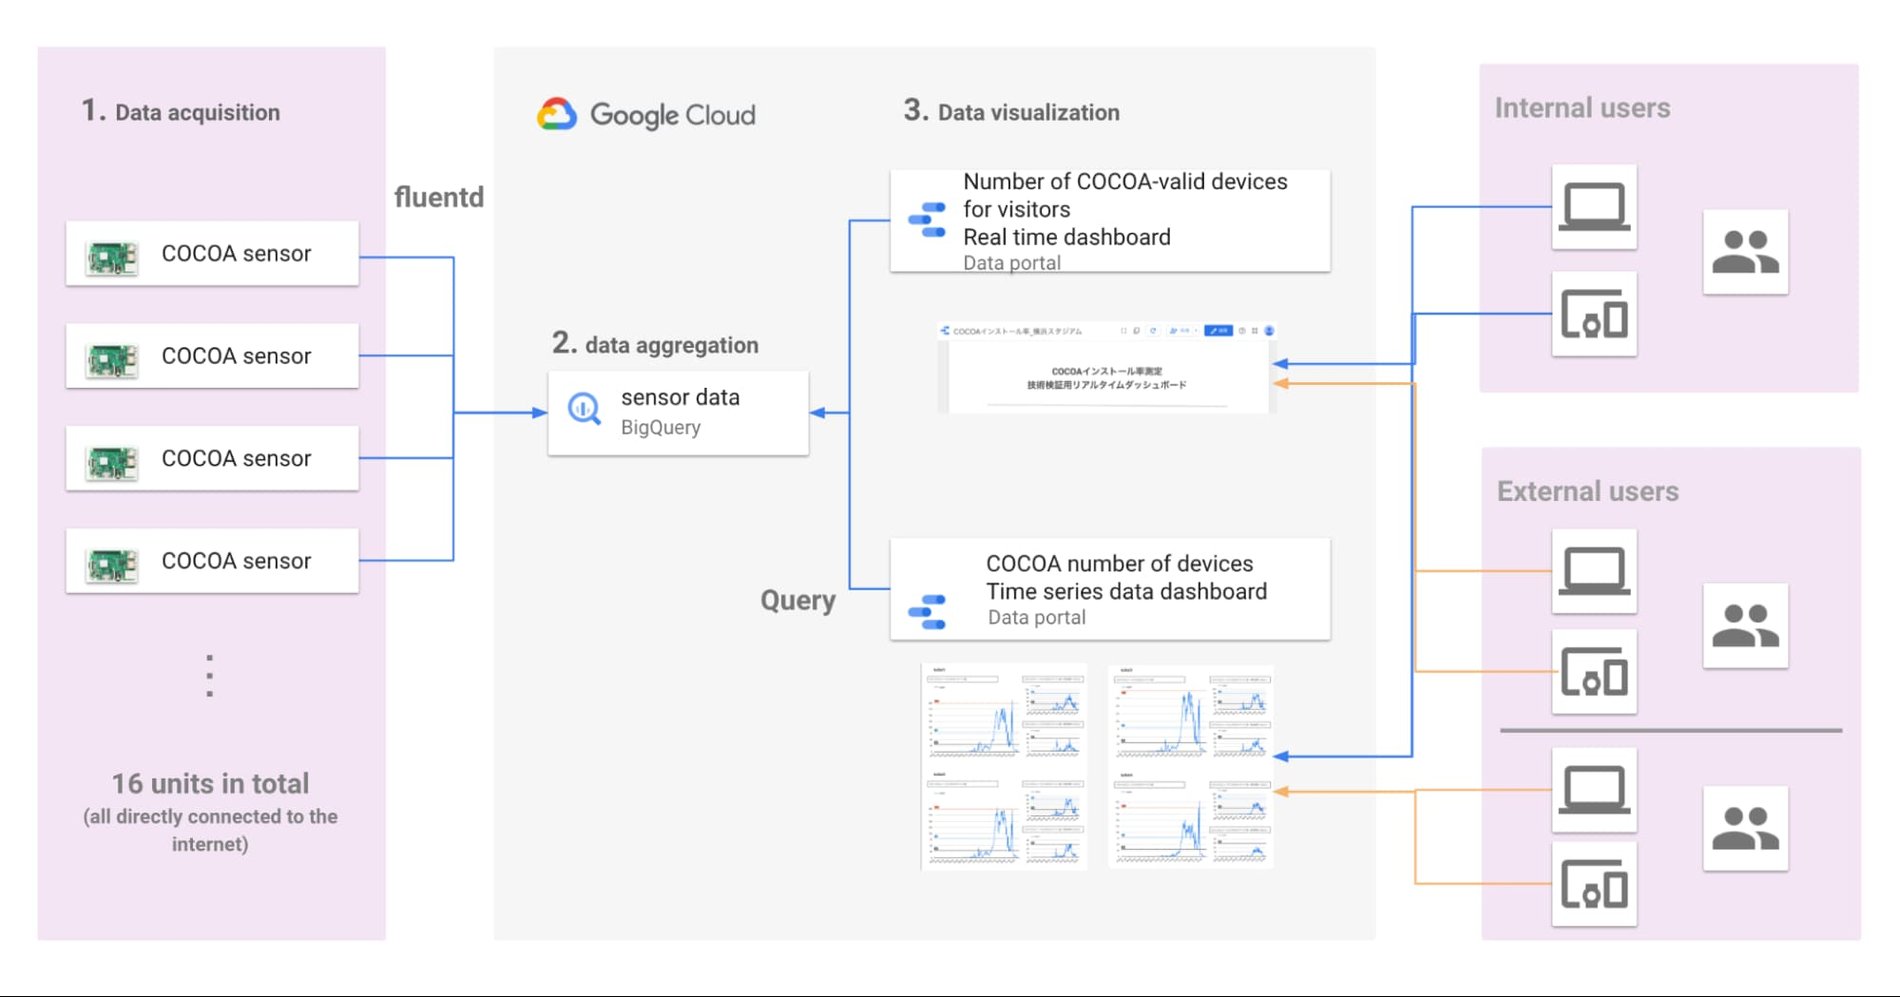
Our visualization system consists of three data functions:
Acquisition through sensor devices
Aggregation with BigQuery, and
Visualization through Data Studio.
The sensor device used to determine whether COCOA is installed on a smartphone is developed on a single-board computer capable of running the Linux SDK (Software Development Kit) and that can easily connect to WiFi. Each sensor device uses Fluentd to write data directly to BigQuery over the internet. Direct connection of each device to the internet means if one device fails, the remaining devices are unaffected.
Data collected by each sensor device is aggregated into BigQuery - minus personally identifiable information - and visualized through Data Studio, with a dashboard made available to event organizers. Users can gain real-time insights into the number of COCOA-enabled devices, the number of COCOA devices in chronological order, and other important information.
Real-time visualization of the number of COCOA-enabled devices is based on the aggregation and counting of COCOA installation information that has passed through two sensor devices - an approach that prevents one sensor device picking up distant radio waves and counting one piece of COCOA installation information as multiple items. Meanwhile, visualizing the number of COCOA devices in chronological order enables monitoring of the behavior of visitors from before an event starts to after it ends.
Here is a diagram of the DeNA Sports Business operational status visualization system:
We now plan to use various technologies to step up measures against the coronavirus, including IoT to aggregate various types of data into BigQuery and deliver visualizations through Data Studio. In the future, we would like to make the visualization system a tool for holding events in the post-coronavirus era and look forward to working with Google Cloud to make that happen.