How to monitor and optimize BigQuery performance and cost
Matt Olivo
Looker Solutions Engineer, Google Cloud
Try Google Cloud
Start building on Google Cloud with $300 in free credits and 20+ always free products.
Free trialDatabase performance and user experience across an organization are impacted by many factors: concurrency, query size and complexity, computing resource allocation and schema structure are just a few. BigQuery’s fully managed, cost-effective architecture handles a significant portion of the performance optimization workload natively. It even automatically allocates the optimal computing resources for each query. However, an effective database administrator can still monitor trends in usage and performance across the organization, and take action to optimize the user experience and improve query times for maximum cost-efficiency and performance. Provided they have the right information, of course.
BigQuery recently released the Information Schema to natively provide that information for administrators, and Looker has built a Block on top of that schema that can be used to monitor usage and optimize your investment in BigQuery. The BigQuery Performance Monitoring Block (available in the Looker Marketplace) provides BigQuery administrators with real time insights into slot capacity optimization, query processing volumes, user experience, and more to get the most out of BigQuery’s powerful architecture. The ReadMe file contained in the Block provides detailed information on all of the metrics used and their significance.
The Block — monitoring the Information Schema
The Block provides you with tools for both real-time alerting and investigation, as well as high-level BigQuery query performance and health checks. Since the Information Schema is consistent for all BigQuery customers, this Block requires very little configuration and performs a lot of the complicated analyses for you.
The Block is composed of two main dashboards (Time Window Investigation and Performance Summary), as well as a Job Look-Up Dashboard, all designed to help you optimize as much as possible. The Time Window Investigation dashboard is an in-depth look at slot usage against capacity across the entire organization, over any 6 hour window in the past 6 months. The Performance Summary dashboard provides a high-level overview of the health and efficiency of your BigQuery organization, identifying trends and anomalies over longer time windows that require a deeper investigation.
How to use these dashboards to optimize your BigQuery investment
As a Database Administrator, you have a lot on your plate. Adding a new set of dashboards to check regularly may not seem feasible. The good news: after you install the Block, you can set up alerts so that you get automatically notified when important changes occur. This way, you can take a more hands-off approach to monitoring without missing anything important in your BigQuery query performance. For example, you could set an alert from the Time Window Investigation dashboard so that you get an email if your organization’s slot consumption reaches a certain threshold.
By clicking on the link in the email you can check the Issue Investigation dashboard to see the organization’s slot usage against capacity in real time, over 5 minute intervals. Drilling into any five minute window will show you the individual projects and queries that are generating that increase in consumption; maybe the Supply Chain team is running a set of warehouse maintenance queries before Black Friday and needs a lot of slot resources to run their analyses. By heading over to the GCP console, you can add additional Flex Slot Commitments, giving 60-second bursts of additional computing power to that project to finish their queries quickly and efficiently.
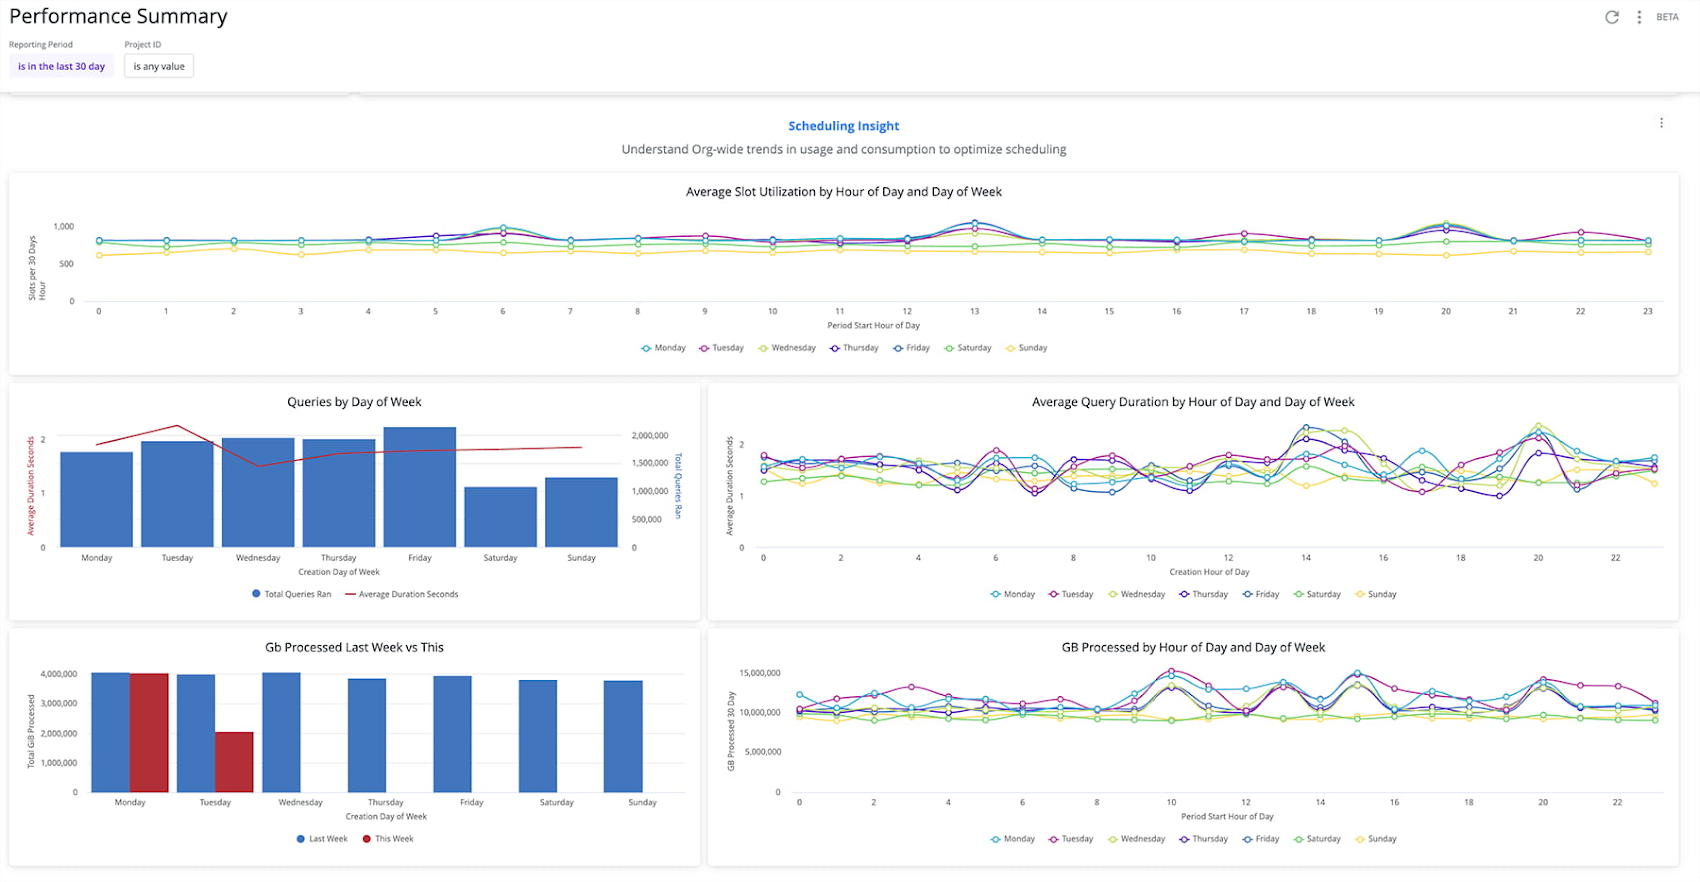
We recommend checking the Performance Summary dashboard on a regular cadence (weekly or monthly) to maintain a high-level overview of the entire BigQuery environment and identify trends in usage across projects. You can set an alert so that Looker sends the dashboard to your inbox on a regular basis to monitor BigQuery query performance. This dashboard can be used to understand what hours of the day and days of the week frequently experience high usage, allowing for an optimal deployment of scheduled queries and ad-hoc analysis across time to ensure the most efficient consumption of your investment in BigQuery slots.
Installing the Block and setting up a few key alerts will have you well on your way to providing a better user experience, faster query times, and maximizing the cost-efficiency and performance of your BigQuery deployment — with a relatively low time investment on your part. Check out the BigQuery Performance Monitoring Block in the Looker Marketplace today.