BigQuery live monitoring with Looker
Austin Assavavallop
Sr. Consultant, Slalom
Try Google Cloud
Start building on Google Cloud with $300 in free credits and 20+ always free products.
Free trialAs enterprises struggle to keep pace with the exponential growth of data, the cloud naturally enters the conversation. Mature, on-premise data warehouse technologies can handle massive volumes of data while being performant, but cloud technologies are not bound by the same hardware and infrastructure limitations. Among the cloud options, BigQuery competes with the best. As a managed service, it has the added capability of nearly limitless and seamless scalability with no administrative overhead. And while BigQuery’s automatic optimizations work well, enterprise administrators migrating to BigQuery still expect to be able to monitor and understand their system’s performance.
The building blocks of a monitoring solution
While performance data is available in its raw format, an operational tool to make sense of it — to help mitigate, triage, or preemptively identify issues and potential SLA delays in BigQuery — is sorely needed. The good news is that the pieces are in place. With the advent of the BigQuery Reservations API, Flex Slots, INFORMATION_SCHEMA, and tangentially, the acquisition of Looker, everything you need to monitor BigQuery performance is available.
Nevertheless, the burden remains on you as the consumer of these services to understand how to use those tools to serve your monitoring needs, to integrate them into your workflows, and to dedicate the development time and resources to then build and maintain a solution. Though you may have needs unique to your company, common minimum monitoring requirements can be defined to provide a strong foundation for a versatile monitoring solution.
Introducing Slalom’s pre-built BigQuery monitoring solution
The BigQuery Live Monitor solution was built to augment BigQuery operational monitoring. It bridges the gap between performance and insights to provide the point-in-time status of BigQuery with the ability to drill through and drill down to pinpoint potential issues as they happen.
To start, the solution provides several near real-time dashboards summarizing performance at various levels:
- Organization
- Reservation
- Project
- User
- Job
These dashboards provide insightful visibility to answer questions at each level.
Organization level
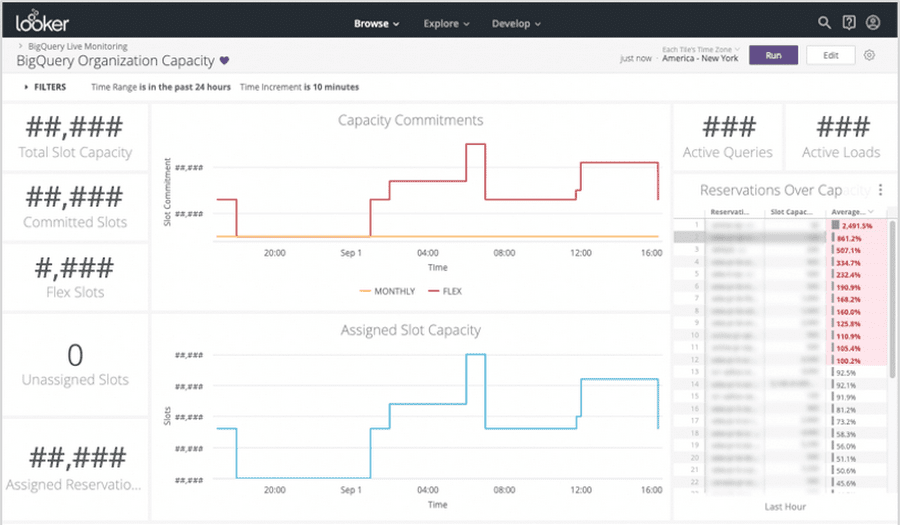
At the organization level, an administrative summary of slot commitments and assignments is shown with a trailing 24-hour period of capacity changes, inclusive of flex slots. This section summarizes the full system capacity and allocations.
BigQuery Organization Capacity dashboard
The information at this level is a starting point for you to answer broad questions like, “What am I working with?” and “How healthy is my system?”

To view further context, you can scroll down for a summary of usage.
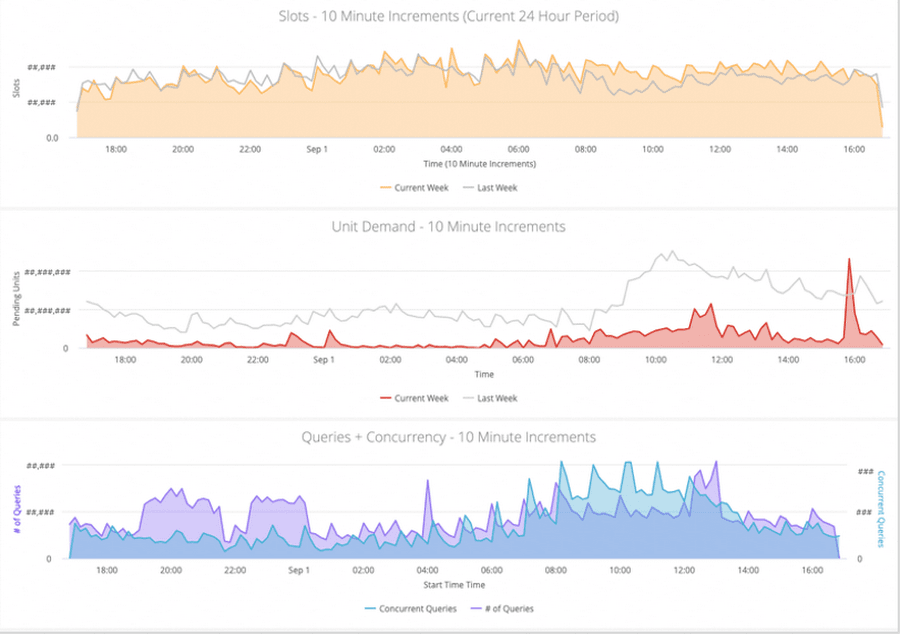

BigQuery Organization Capacity Details dashboard
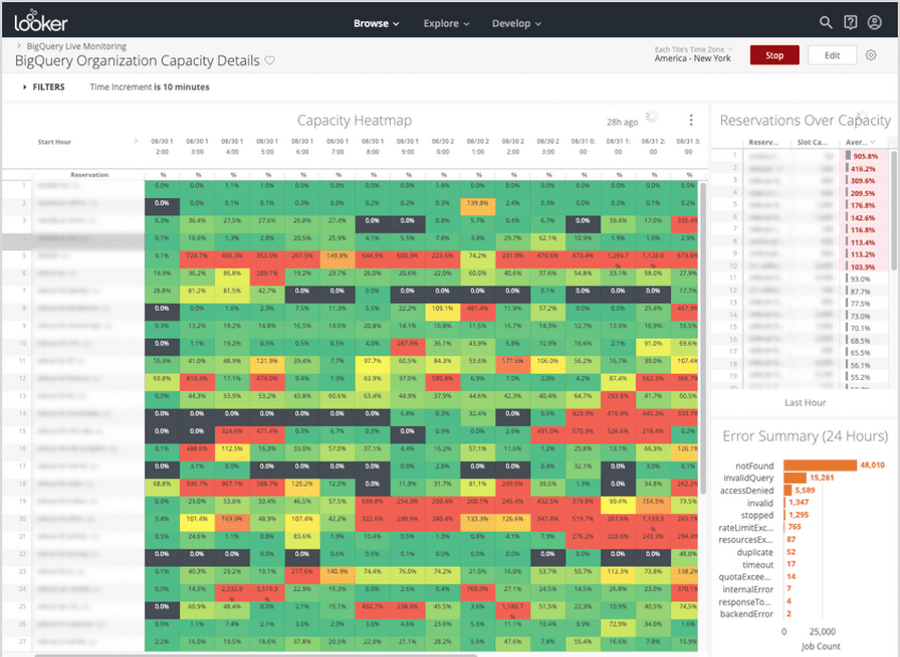
In the next organization-level dashboard, an hourly heatmap is presented, showing usage hotspots per hour by reservation. This helps you answer questions such as, “Are there any worrying usage patterns in a reservation?”

Reservation level
Reservation Capacity dashboard
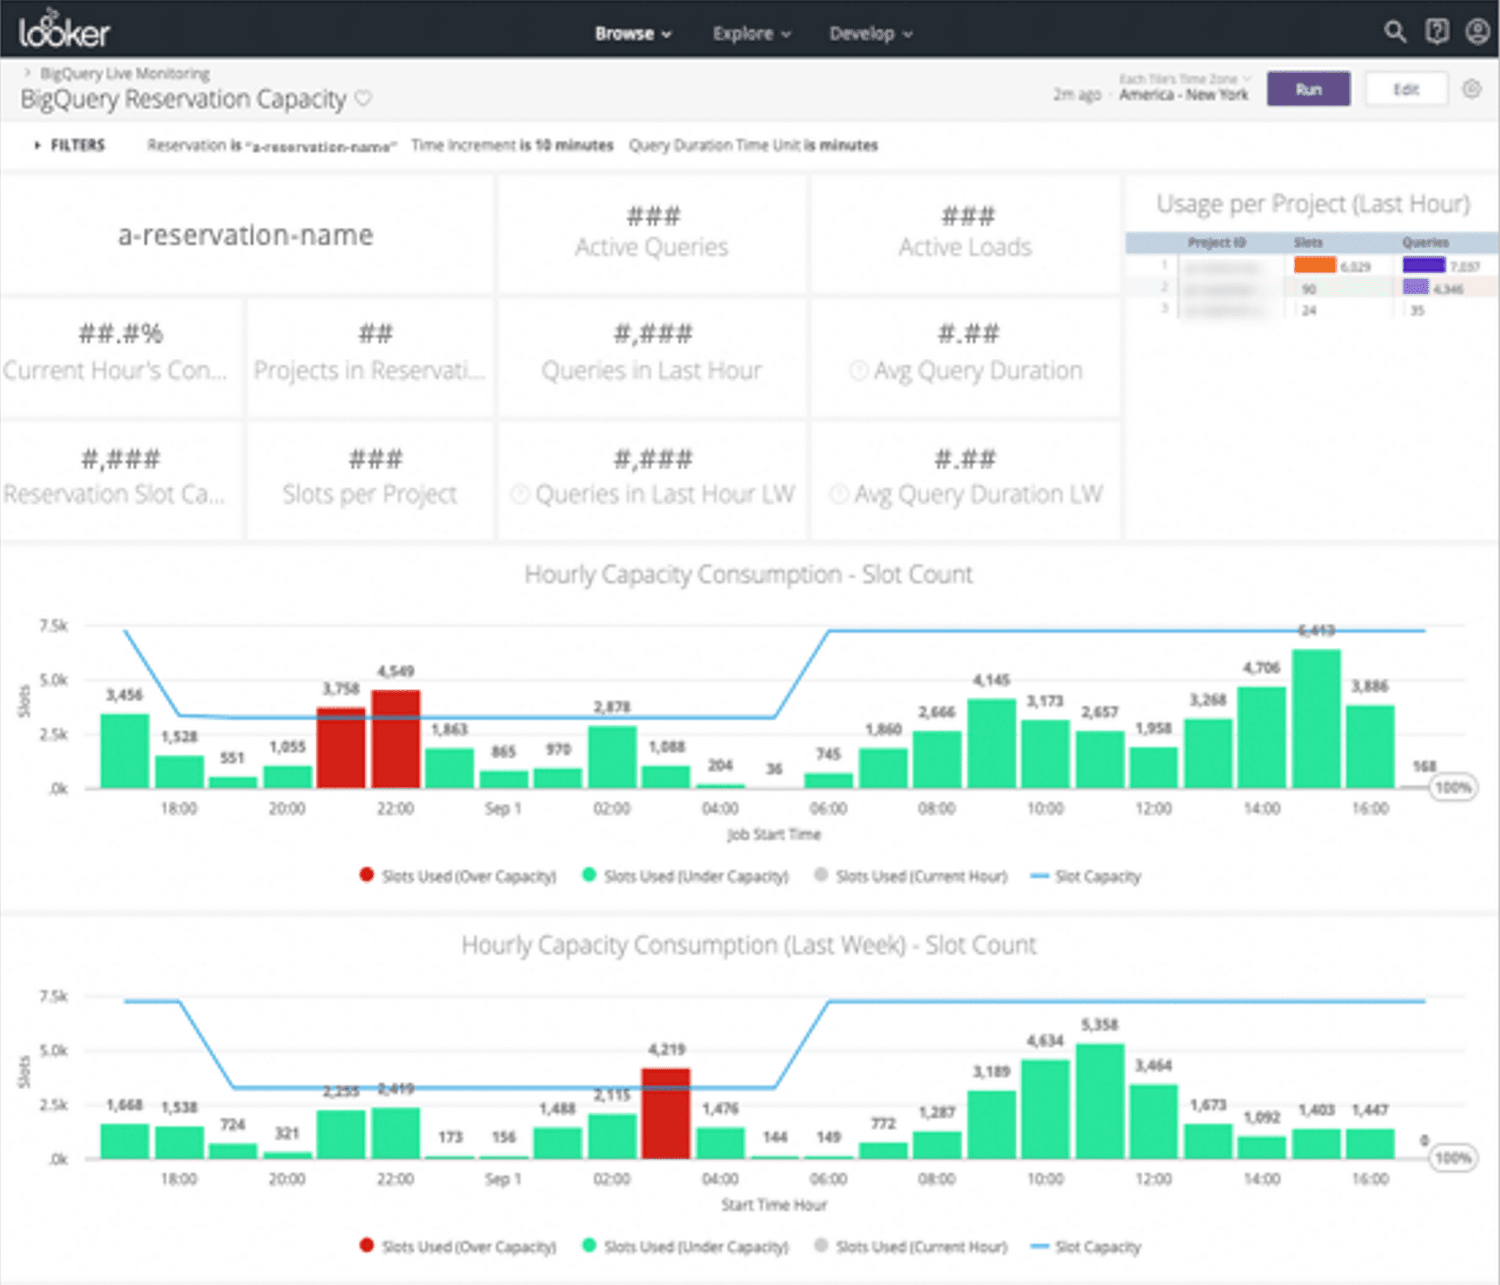
By drilling down into the Reservation Capacity dashboard, you can monitor activity levels to help identify anomalous behavior. Notably, at the reservation level, performance is summarized to a time unit of your choosing (for example, per hour) and compared against a point-in-time reservation capacity to convey a running comparison of usage to capacity.

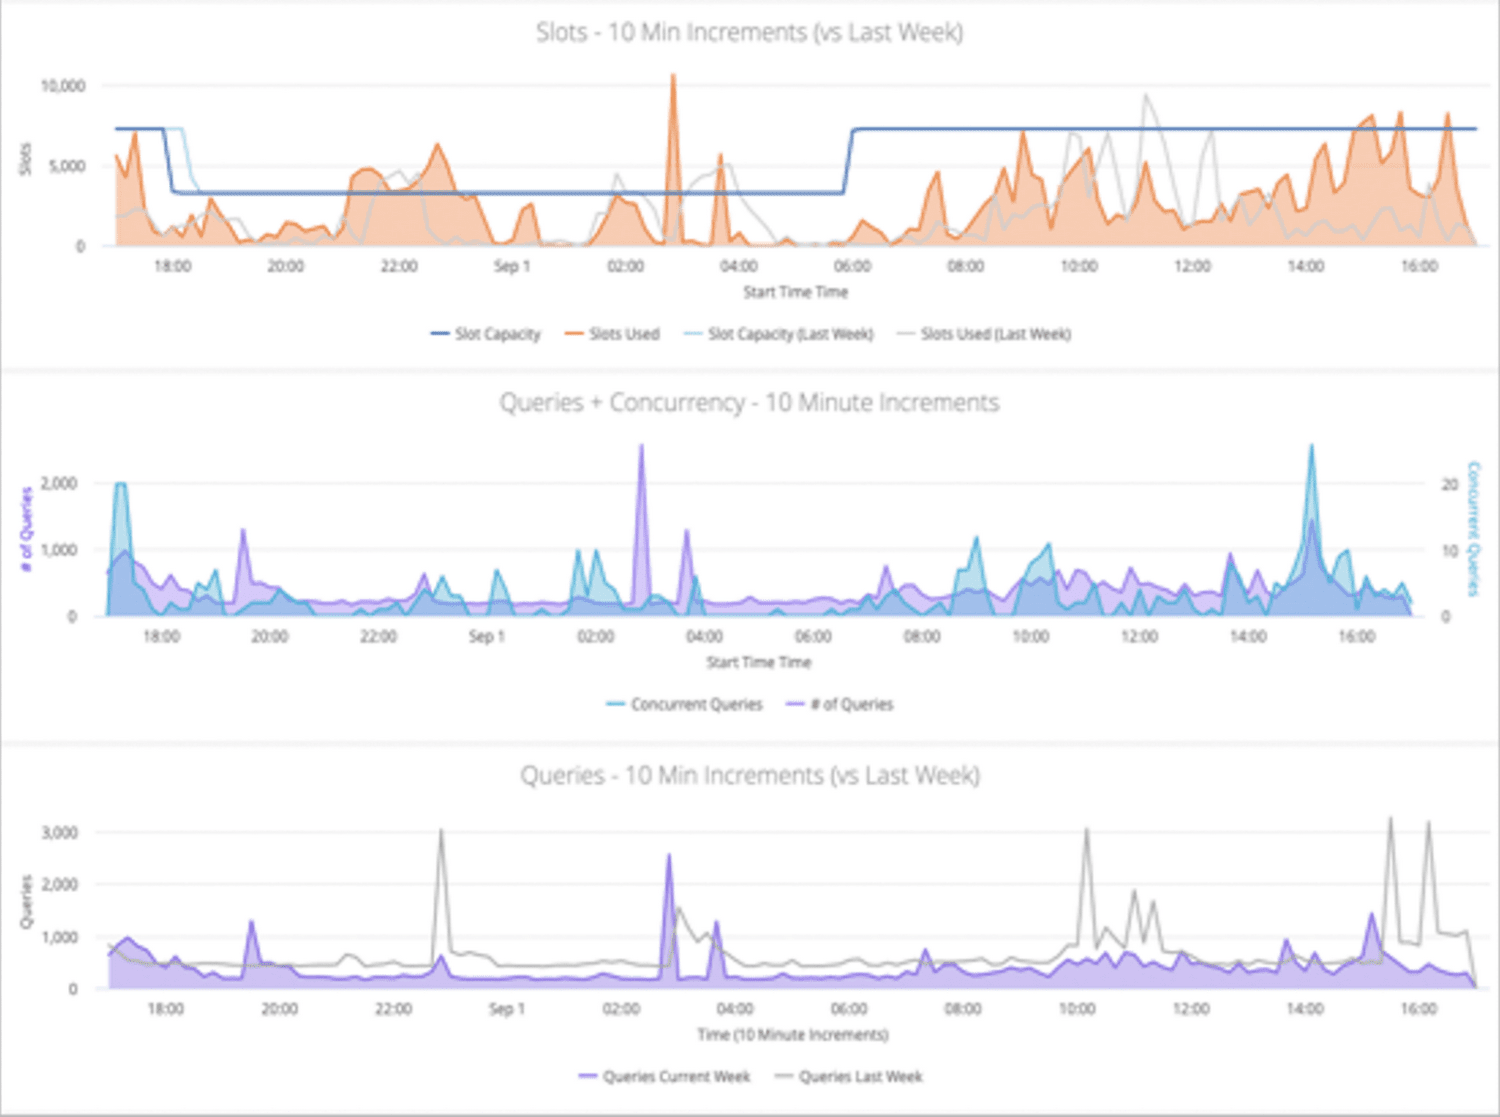
Furthermore, prior period performance is overlaid on slot usage, query count and concurrency, and unit demand charts to provide a frame of reference for cyclical workloads to surface unexpected usage. In this example, workloads are weekly, so you can see how the current week’s performance compares to last week’s.

Reservation Capacity Details dashboard
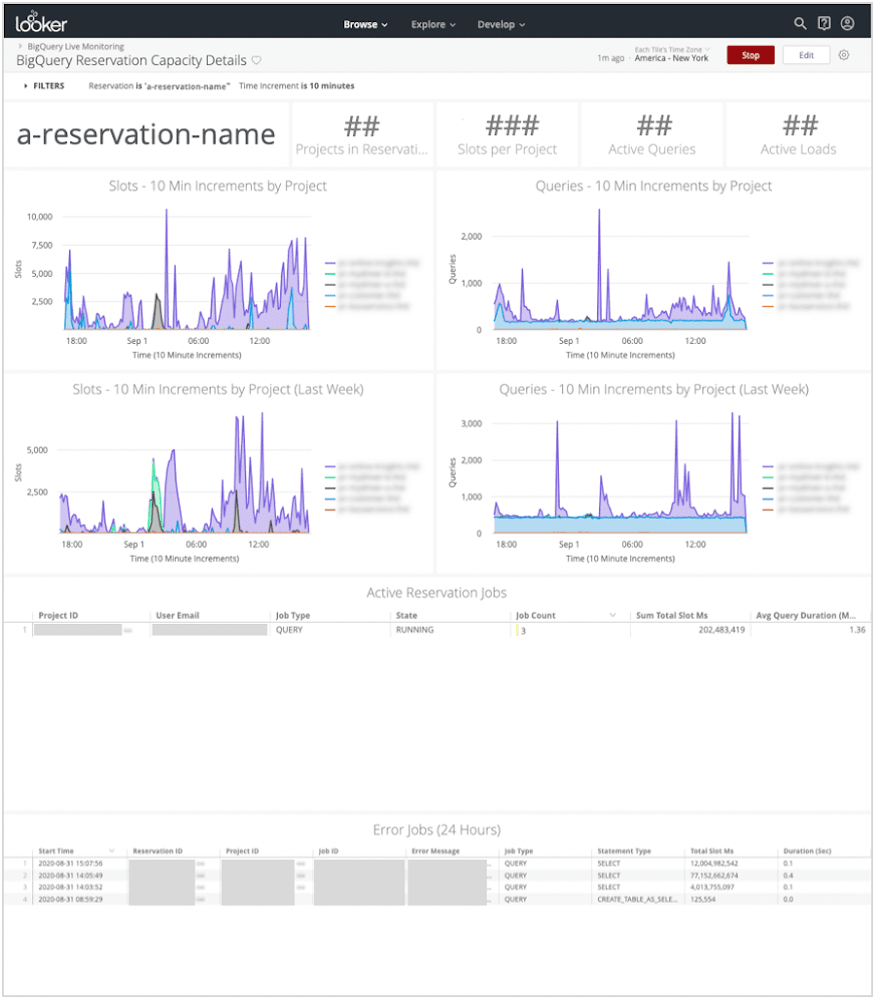
Moving into the Reservation Details dashboard, you can view slot usage and query counts by project. The latter part of the dashboard provides a list summary of your team members with active jobs, while also listing all error jobs for even more context. This lets you see how projects individually impact a reservation.

Project level
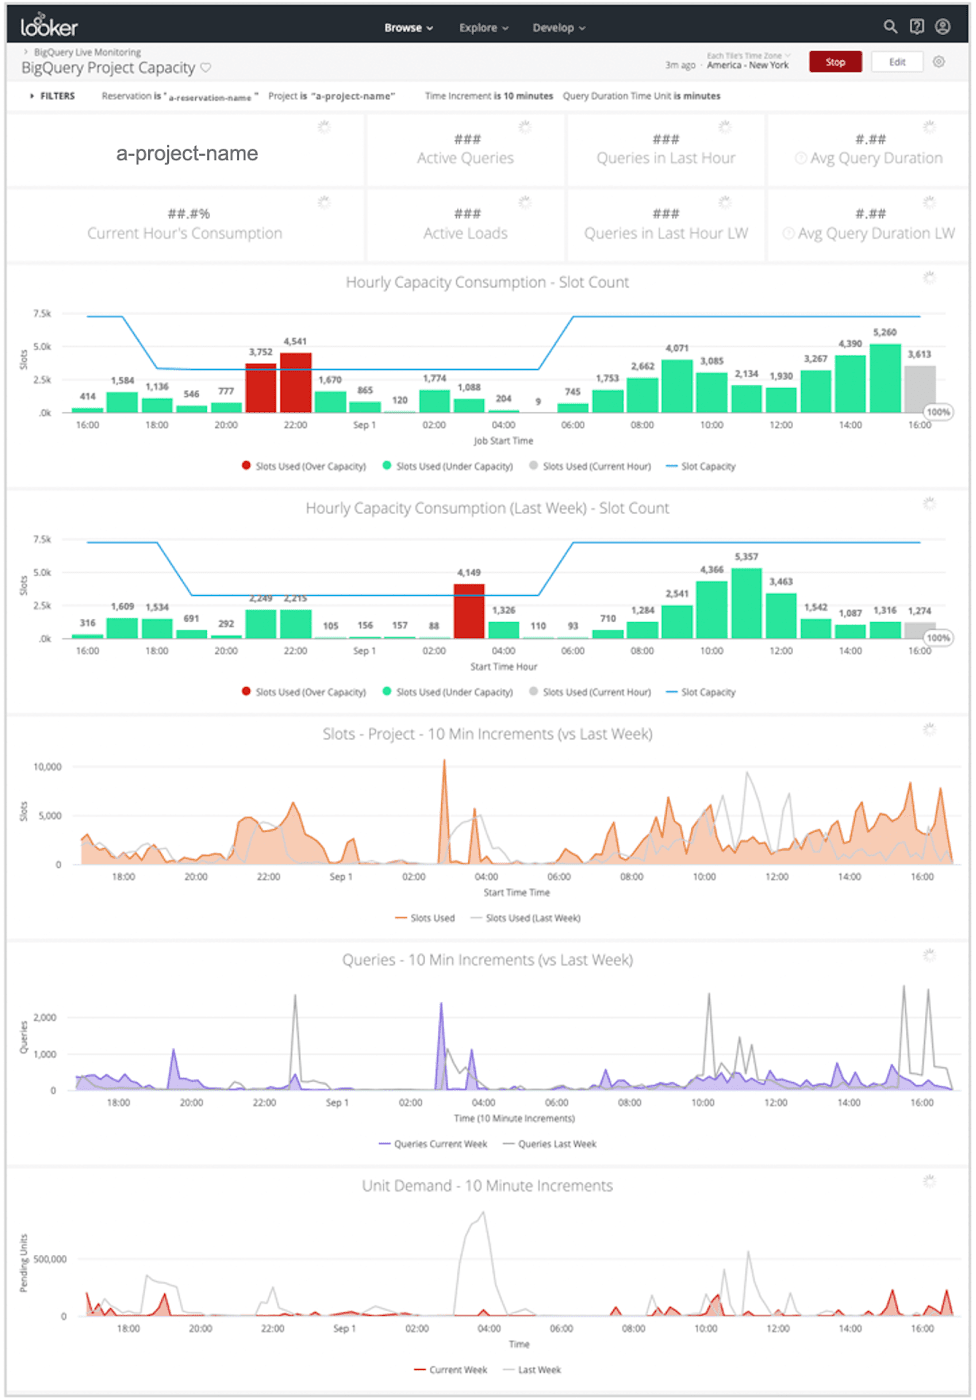
BigQuery Project Capacity dashboard
As you drill down further to the project level on the Project Capacity dashboard, much of the view is similar to the Reservation Capacity dashboard. This dashboard gives you insight into the health of individual projects.

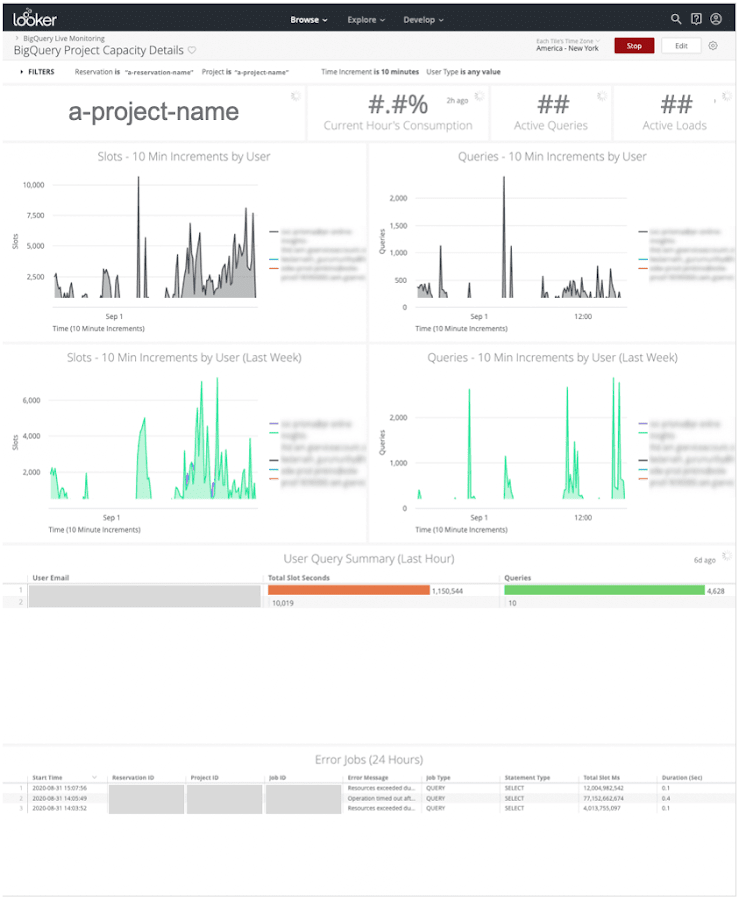
BigQuery Project Capacity Details dashboard
For more details, the Project Details dashboard provides a breakout of usage and query counts by user. This shows you how users are individually impacting a project’s health.

Job level
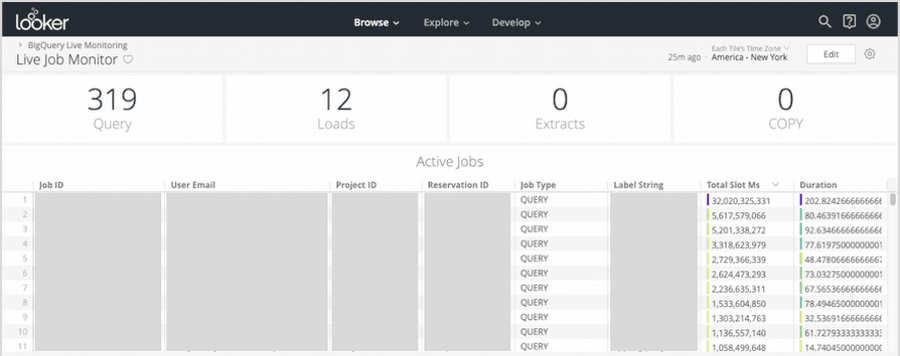
Live Job Monitor dashboard
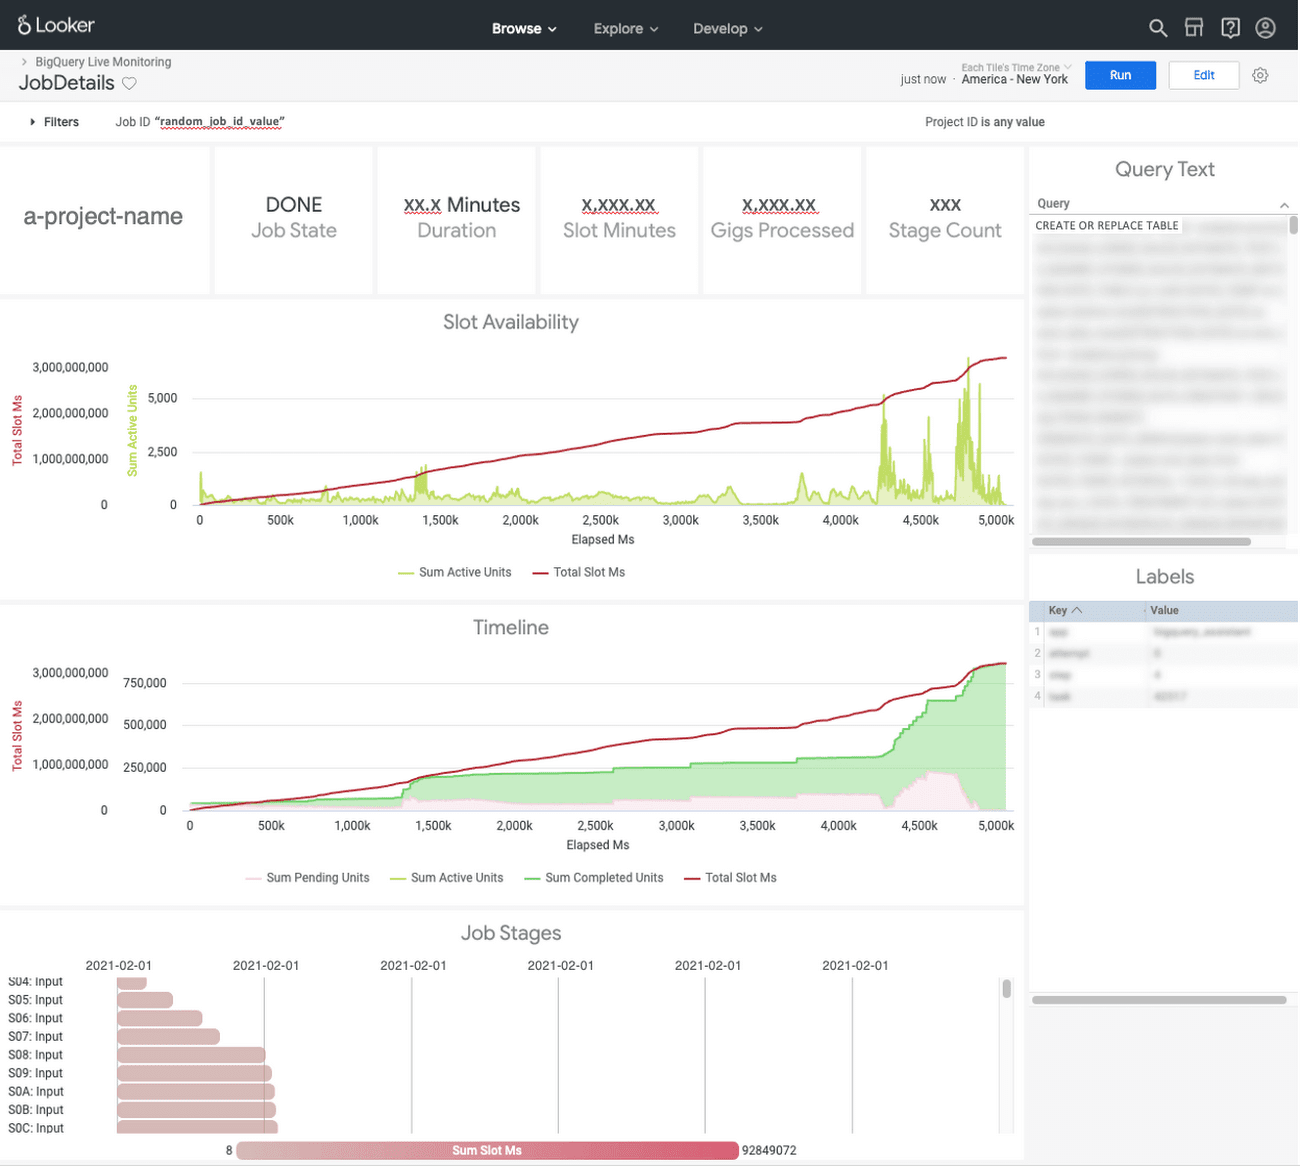
If a scenario you are investigating warrants drilling even further down to the job level, the Live Job Monitor dashboard presents a filterable view of active jobs and relevant metrics. Here you can see what jobs are currently running, as well as how they are performing.

From there, an action can be configured in Looker on the job_id field enabling a custom “Cancel Job” selection (assuming the necessary supporting Looker Action Hub integrations are in place in your instance). To you as a user, this materializes as a menu selection on the field so you can cancel a job directly from the dashboard.
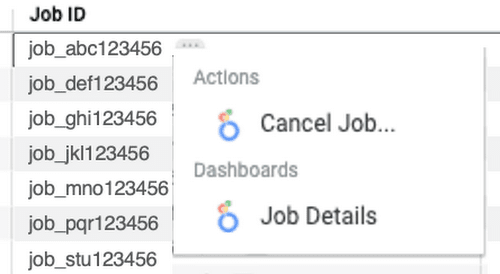

Additionally, from the Job ID menu, you can drill down to an individual job’s details, which can be particularly useful to understand a query’s actual execution plan.

Historic and predictive slot usage insights
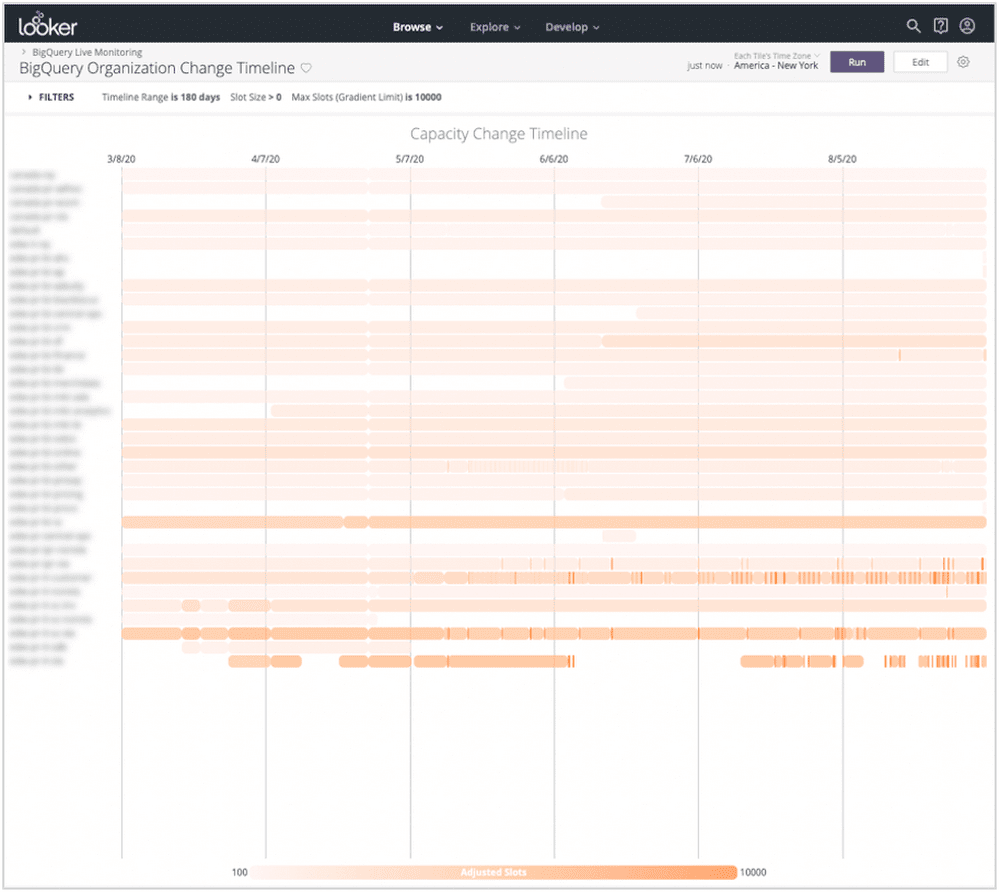
Another dashboard focused more on capacity shape, the Organization Change Timeline visualizes capacity changes to reservations over time.

And finally, broaching predictive analytics, with a view of usage and/or unit demand forecast utilizing BQML’s built-in auto-ARIMA modeling capabilities, you can visualize the forecast in-line with actual usage. Enabling this requires setup on the BigQuery side to deploy and schedule the model(s) to retrain on the latest data regularly to reduce forecast staleness. Slot usage and unit demand are separately maintained models, but the output structure is the same.
What does my future usage potentially look like?


Summary
BigQuery Live Monitoring provides visibility to inefficient usage patterns and empowers you to more easily identify and address them in a timely fashion.
The BigQuery Live Monitor is built using the standard INFORMATION_SCHEMA data and can be deployed to any customer on GCP with a Looker instance. Once this “drop-in” solution is landed in the GCP environment, all components can be tailored to meet the needs of your unique technical landscape.
Slalom’s expertise in slot monitoring and optimization at enterprise scale can help you to manage business costs by right-sizing reservation slot allocation; isolating high-usage projects, users, or queries; building custom actions to manage and optimize BigQuery slot usage; and providing further customization to query usage/demand.
For a BQ Live Monitoring demonstration or questions, contact google@slalom.com.
