Benchmarking your Dataflow jobs for performance, cost and capacity planning
Roy Arsan
Cloud Solutions Architect, Google
Sudesh Amagowni
Solutions Manager, Smart Analytics and AI
Calling all Dataflow developers, operators and users…
So you developed your Dataflow job, and you’re now wondering how exactly will it perform in the wild, in particular:
- How many workers does it need to handle your peak load and is there sufficient capacity (e.g. CPU quota)?
- What is your pipeline’s total cost of ownership (TCO), and is there room to optimize performance/cost ratio?
- Will the pipeline meet your expected service-level objectives (SLOs) e.g. daily volume, event throughput and/or end-to-end latency?
To answer all these questions, you need to performance test your pipeline with real data to measure things like throughput and expected number of workers. Only then can you optimize performance and cost. However, performance testing data pipelines is historically hard as it involves: 1) configuring non-trivial environments including sources & sinks, to 2) staging realistic datasets, to 3) setting up and running a variety of tests including batch and/or streaming, to 4) collecting relevant metrics, to 5) finally analyzing and reporting on all tests’ results.
We’re excited to share that PerfKit Benchmarker (PKB) now supports testing Dataflow jobs! As an open-source benchmarking tool used to measure and compare cloud offerings, PKB takes care of provisioning (and cleaning up) resources in the cloud, selecting and executing benchmark tests, as well as collecting and publishing results for actionable reporting. PKB is a mature toolset that has been around since 2015 with community effort from over 30 industry and academic participants such as Intel, ARM, Canonical, Cisco, Stanford, MIT and many more.


We’ll go over the testing methodology and how to use PKB to benchmark a Dataflow job. As an example, we’ll present sample test results from benchmarking one of the popular Google-provided Dataflow templates, Pub/Sub Subscription to BigQuery template, and how we identified its throughput and optimum worker size. There are no performance or cost guarantees since results presented are specific to this demo use case.
Quantifying pipeline performance
“You can't improve what you don't measure.”
One common way to quantify pipeline performance is to measure its throughput per vCPU core in elements per second (EPS). This throughput value depends on your specific pipeline and your data, such as:
- Pipeline’s data processing steps
- Pipeline’s sources/sinks (and their configurations/limits)
- Worker machine size
- Data element size
It’s important to test your pipeline with your expected real-world data (type and size), and in a testbed that mirrors your actual environment including similarly configured network, sources and sinks. You can then benchmark your pipeline by varying several parameters such as worker machine size. PKB makes it easy to A/B test different machine sizes and determine which one provides the maximum throughput per vCPU.
Note: What about measuring pipeline throughput in MB/s instead of EPS?
While either of these units work, measuring throughput in EPS draws a clear line with:
- underlying performance dependency (i.e. element size in your particular data), and
- target performance requirement (i.e. number of individual elements processed by your pipeline). Similar to how disk performance depends on I/O block size (KB), pipeline throughput depends on element size (KB). With pipelines processing primarily small element sizes (in the order of KBs), EPS is likely the limiting performance factor. The ultimate choice between EPS and MB/s depends on your use case and data.
Note: The approach presented here expands on this prior post from 2020, predicting dataflow cost. However, we also recommend varying worker machine sizes to identify any potential cpu/network/memory bottlenecks, and determine the optimum machine size for your specific job and input profile, rather than assuming default machine size (i.e. n1-standard-2). The same applies to any other relevant pipeline configuration option such as custom parameters.
The following are sample PKB results from benchmarking PubSub Subscription to BigQuery Dataflow template across n1-standard-{2,4,8,16} using the same input data, that is logs with element size of ~1KB. As you can see, while n1-standard-16 offers the maximum throughput at 28.9k EPS, the maximum throughput per vCPU is provided by n1-standard-4 at around 3.8k EPS/core slightly beating n1-standard-2 which is at 3.7k EPS/core, by 2.6%.


Latency & throughput results from PKB testing of Pub/Sub to BigQuery Dataflow template
What about pipeline cost? Which machine size offers the best performance/cost ratio?
Let’s look at resource utilization and total cost to quantify this. After each test run, PKB collects standard Dataflow metrics such as average CPU utilization and calculates the total cost based on reported resources used by the job. In our case, jobs running on n1-standard-4 incurred on average 5.3% more costs than jobs running on n1-standard-2. With an increased performance of only 2.6%, one might argue that from a performance/cost point of view, n1-standard-4 is less optimal than n1-standard-2. However, looking at CPU utilization, n1-standard-2 was highly utilized at > 80% on average, while n1-standard-4 utilization was at a healthy average of 68.57% offering room to respond faster to small load changes, without potentially spinning up a new instance.
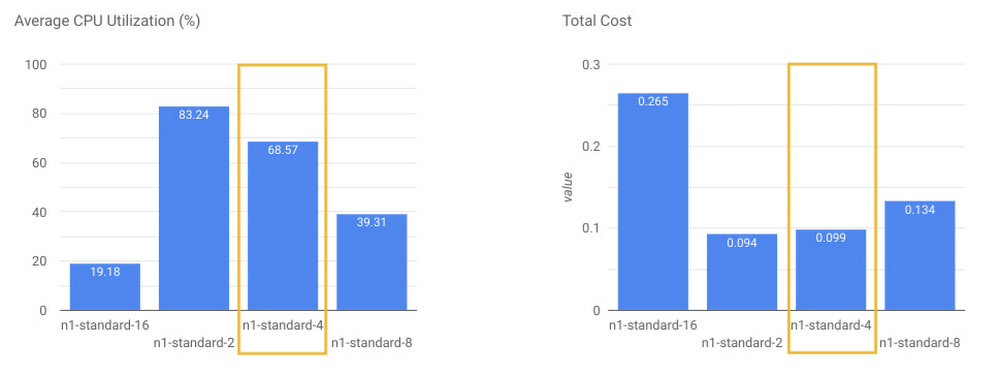

Utilization and cost results from PKB testing of Pub/Sub to BigQuery Dataflow template
Choosing optimum worker size sometimes involves a tradeoff between cost, throughput and freshness of data. The choice depends on your specific workload profile and target requirements namely throughput and event latency. In our case, the extra 5.3% in cost for n1-standard-4 is worth it, given the added performance and responsiveness. Therefore, for our specific use case and input data, we chose n1-standard-4 as the pipeline unit worker size with throughput of 3.8k EPS per vCPU.
Sizing & costing pipelines
“Provision for peak, and pay only for what you need.”
Now that you measured (and hopefully optimized) your pipeline’s throughput per vCPU, you can deduce the pipeline size necessary to process your expected input workload as follows:
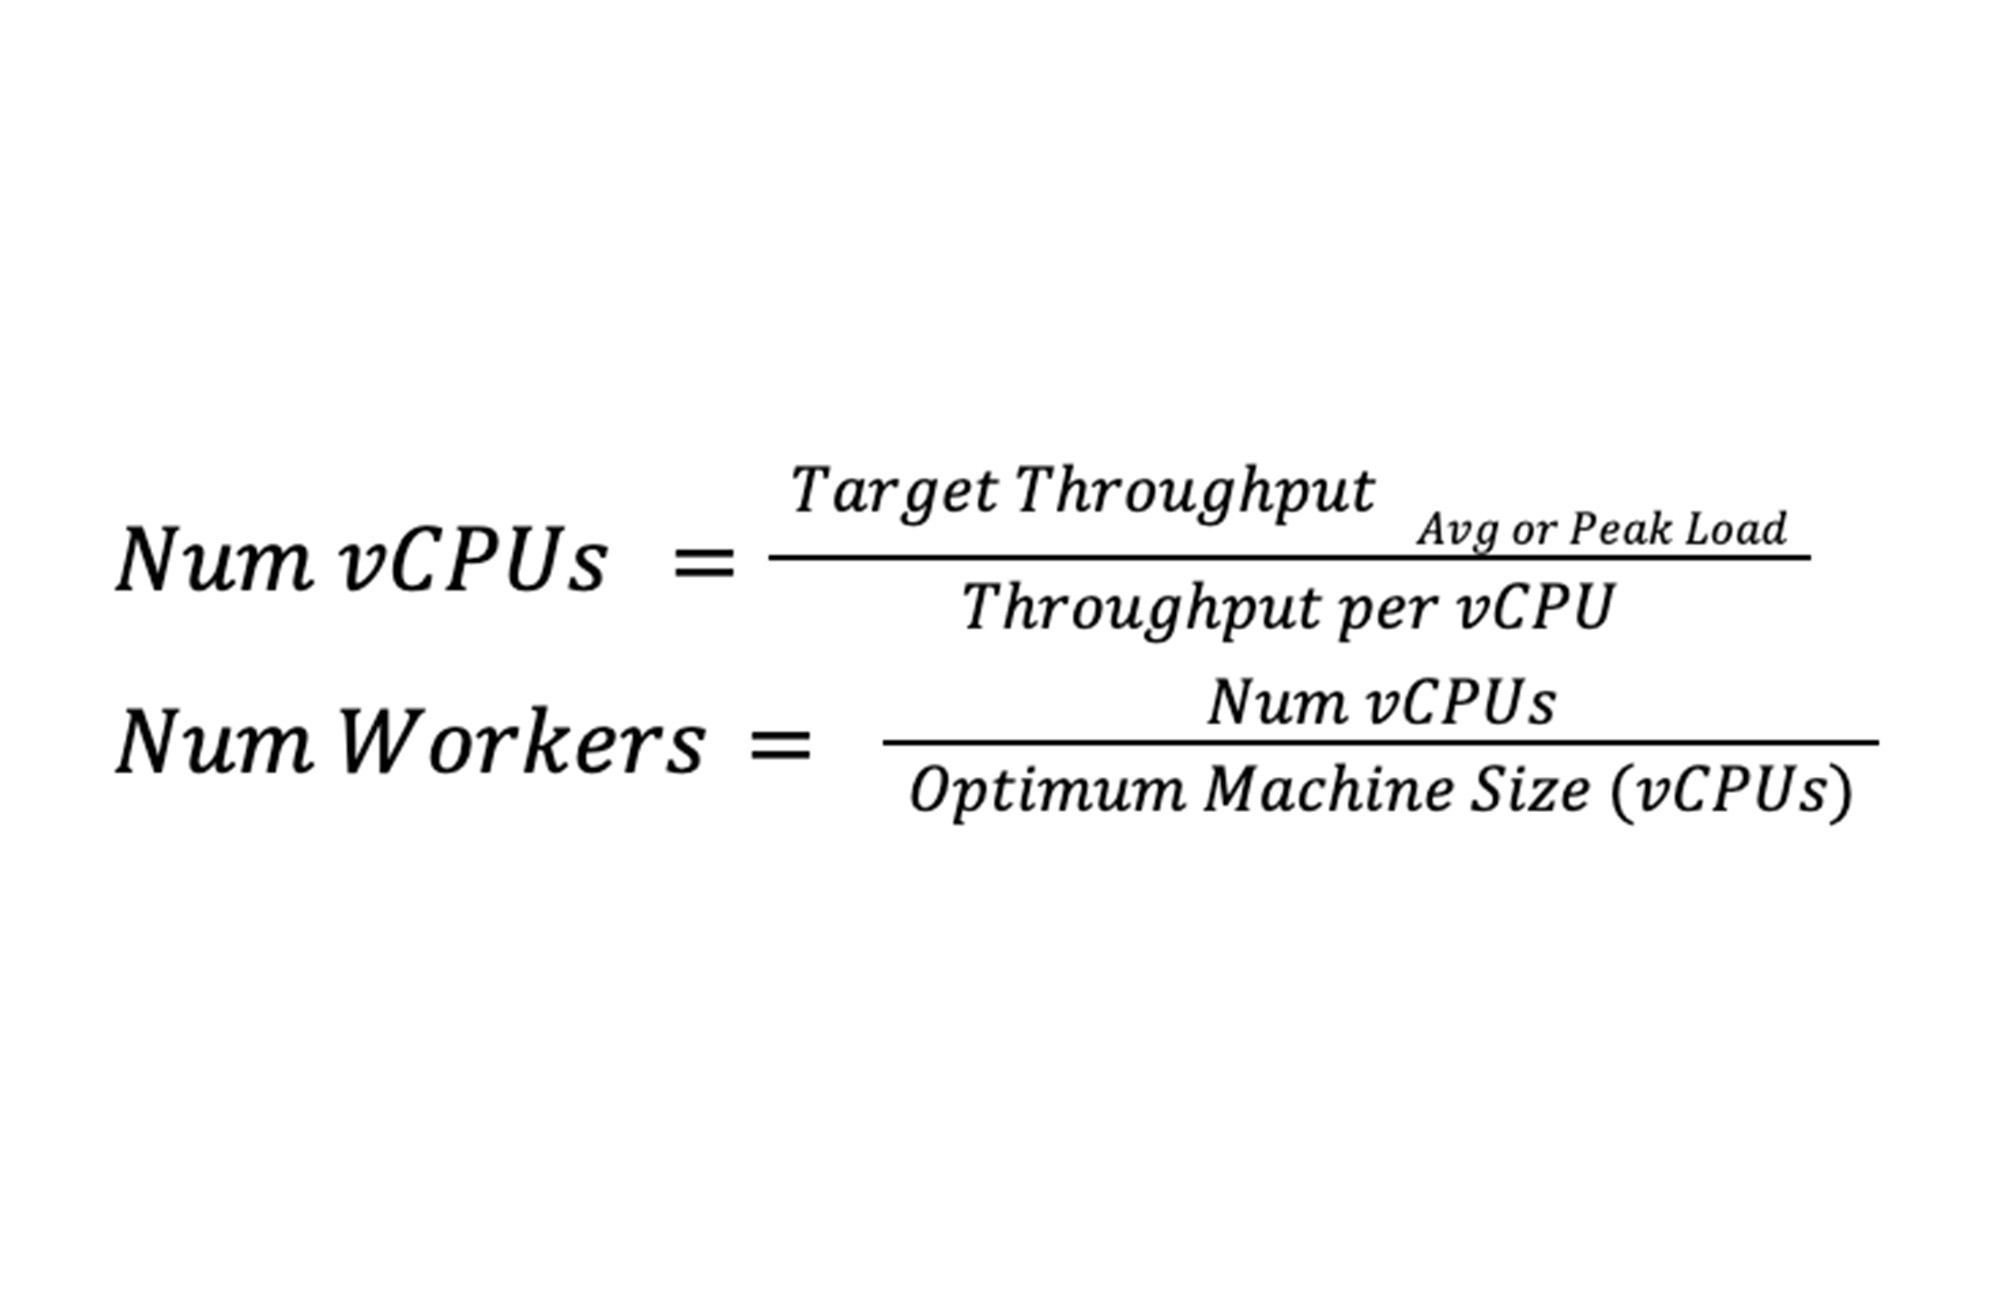

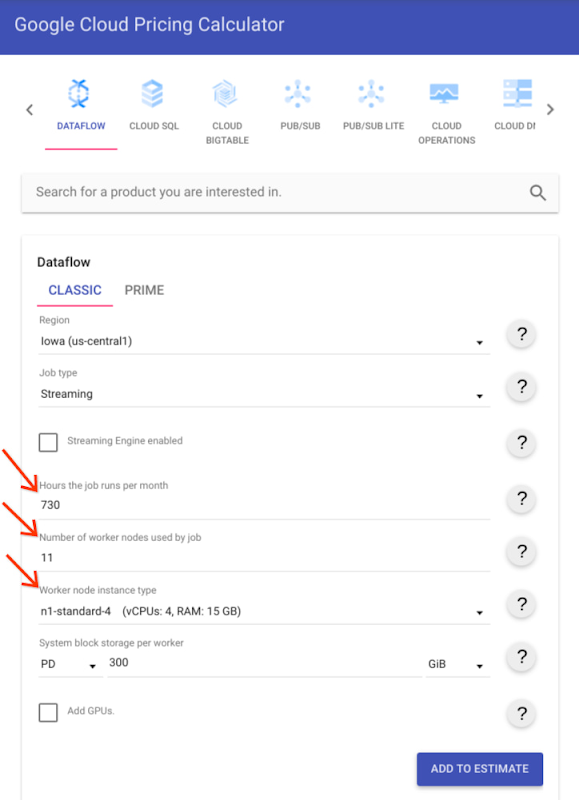
Since your pipeline’s input workload is likely variable, you need to calculate the average and maximum pipeline sizes. Maximum pipeline size helps with capacity planning for peak load. Average pipeline size is necessary for cost estimation: you can now plug in the average number of workers and chosen instance type in the Google Cloud Pricing Calculator to determine TCO.
Let’s go through an example. For our specific use case, let’s assume the following about our input workload profile:
- Daily volume to be processed: 10 TB/day
- Average element size: 1 KB
- Target steady-state throughput: 125k EPS
- Target peak throughput: 500k EPS (or 4x steady-state)
- Peak load occurs 10% of the time
In other words, the average throughput is expected to be around 90% x 125k + 10% x 500k =162.5k (EPS).
Let’s calculate the average pipeline size:
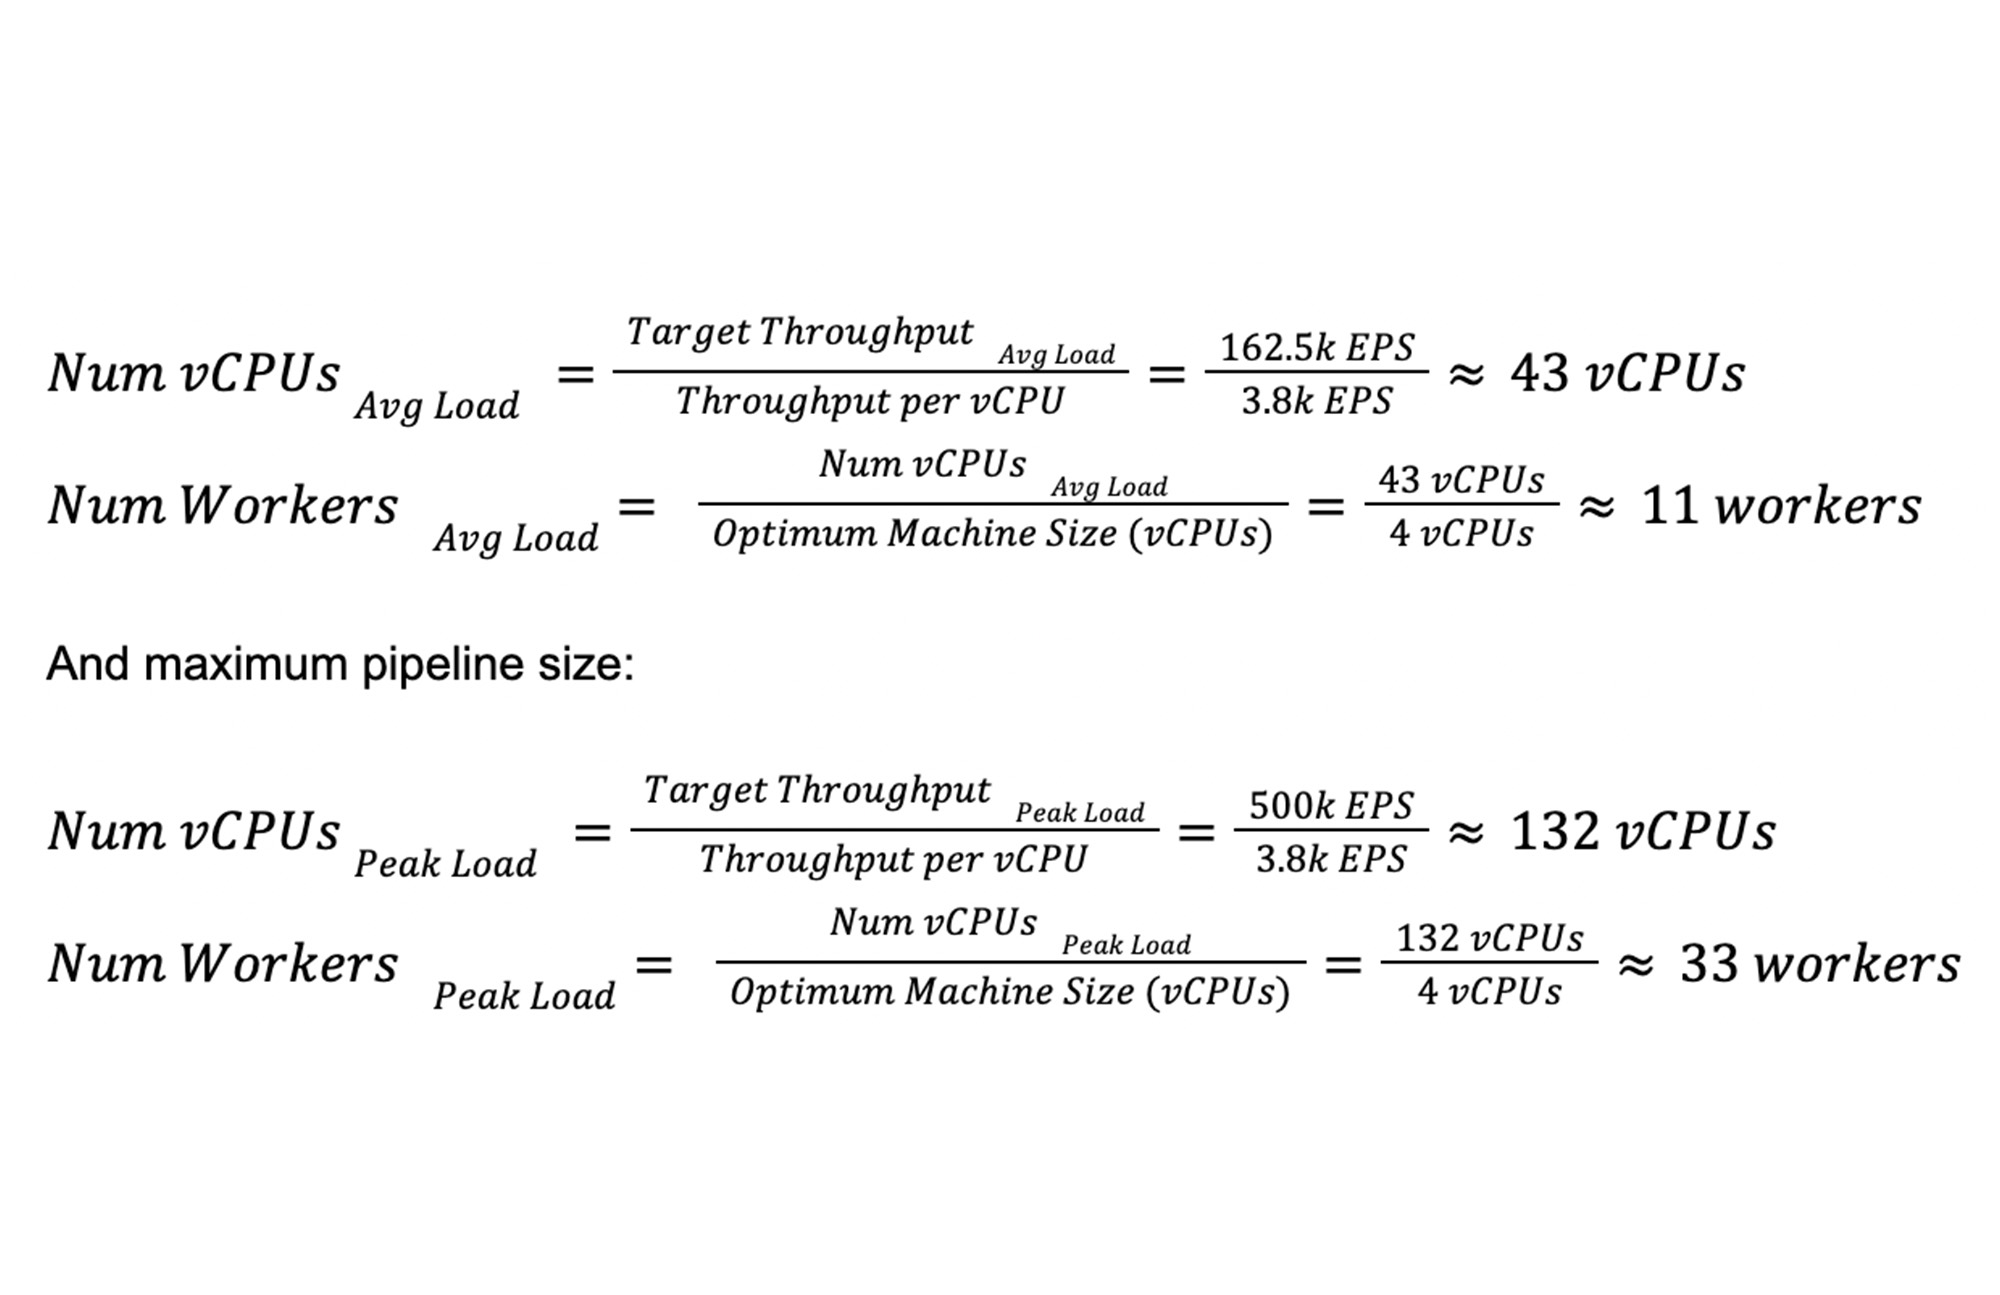

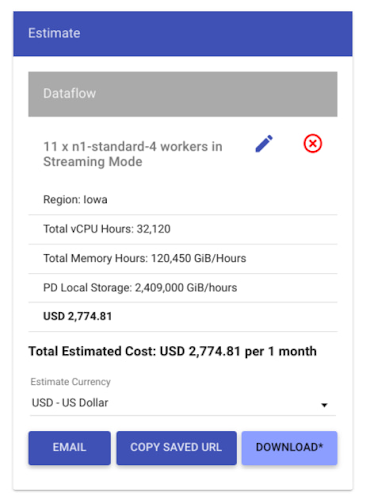
To determine pipeline monthly cost, we can now plug in the average number of workers (11 workers) and instance type (n1-standard-4) into the pricing calculator. Note the number of hours per month (730 on average) given this is a continuously running streaming pipeline:


How to get started
To get up and running with PKB, refer to public PKB docs. If you prefer walkthrough tutorials, check out this beginner lab, which goes over PKB setup, PKB command-line options, and how to visualize test results in Data Studio, similar to how we did above.
The repo includes example PKB config files, including dataflow_template.yaml which you can use to re-run the sequence of tests above. You need to replace all <MY_PROJECT> and <MY_BUCKET> instances with your own GCP project and bucket. You also need to create an input Pub/Sub subscription with your own test data preprovisioned (since test results vary based on your data), and an output BigQuery table with correct schema to receive the test data. The PKB benchmark handles saving and restoring a snapshot of that Pub/Sub subscription for every test run iteration. You can run the entire benchmark directly from PKB root directory:
To benchmark Dataflow jobs from a jar file (instead of a staged Dataflow template), refer to dataflow_wordcount.yaml PKB config file as an example, which you can run as follows:
To publish test results in BigQuery for further analysis, you need to append BigQuery-specific arguments to above commands. For example:
What’s next?
We’ve covered how performance benchmarking can help ensure your pipeline is properly sized and configured, in order to:
A. meet your expected data volumes,
B. without hitting capacity limits, and
C. without breaking your cost budget
In practice, there may be many more parameters that impact your pipeline performance beyond just the machine size, so we encourage you to take advantage of PKB to benchmark different configurations of your pipeline, and help you make data-driven decisions around things like:
- Planned pipeline’s features development
- Default and recommended values for your pipeline parameters. See this sizing guideline for one of Google-provided Dataflow templates as an example of PKB benchmark results synthesized into deployment best practices.
You can also incorporate these performance tests in your pipeline development process to quickly identify and avoid performance regressions. You can automate such pipeline regression testing as part of your CI/CD pipeline - no pun intended.
Finally, there’s a lot of opportunity to further enhance PKB for Dataflow benchmarking, such as collecting more stats and adding more realistic benchmarks that’s in line with your pipeline’s expected input workload. While we have tested here pipeline’s unit performance (max EPS/vCPU) under peak load, you might want to test your pipeline’s auto-scaling and responsiveness (e.g. 95th percentile for event latency) under varying load which could be just as critical for your use case. You can file tickets to suggest features or submit pull requests and join the 100+ PKB developer community.
On that note, we’d like to acknowledge the following individuals who helped make PKB available to Dataflow end-users:
- Diego Orellana, Software Engineer @ Google, PerfKit Benchmarker
- Rodd Zurcher, Cloud Solutions Architect @ Google, App/Infra Modernization
- Pablo Rodriguez Defino, PSO Cloud Consultant @ Google, Data & Analytics
