Analyzing satellite images in Google Earth Engine with BigQuery SQL
Ankur Wahi
Customer Engineer
Chad W. Jennings
Geospatial Lead, Google Cloud
Google Earth Engine (GEE) is a groundbreaking product that has been available for research and government use for more than a decade. Google Cloud recently launched GEE to General Availability for commercial use. This blog post describes a method to utilize GEE from within BigQuery’s SQL allowing SQL speakers to get access to and value from the vast troves of data available within Earth Engine.
We will use Cloud Functions to allow SQL users at your organization to make use of the computation and data catalog superpowers of Google Earth Engine. So, if you are a SQL speaker and you want to understand how to leverage a massive library of earth observation data in your analysis then buckle up and read on.
Before we get started let’s spend thirty seconds on setting geospatial context for our use-case. BigQuery excels at doing operations on vector data. Vector data are things like points, polygons, things that you can fit into a table. We use the PostGIS syntax so users that have used spatial SQL before will feel right at home in BigQuery.
BigQuery has more than 175+ public datasets available within Analytics Hub. After doing analysis in BigQuery users can use tools like GeoViz, Data Studio, Carto and Looker to visualize those insights.
Earth Engine is designed for raster or imagery analysis, particularly satellite imagery. GEE, which holds more than 70PB of satellite imagery, is used to detect changes, map trends, and quantify differences on the Earth's surface. GEE is widely used to extract insights from satellite images to make better use of land, based on its diverse geospatial datasets and easy-to-use application programming interface (API).
By using these two products in conjunction with each other you can expand your analysis to incorporate both vector and raster datasets to combine insights from 70PB of GEE and 175+ datasets from BigQuery. For example, in this blog we’ll create a Cloud Function that pulls temperature and vegetation data from the Landsat satellite imagery within the GEE Catalog and we’ll do it all from SQL in BigQuery. If you are curious about how to move data from BigQuery into Earth Engine you can read about it in this post.
While our example is focused on agriculture this method can apply to any industry that matters to you.
Let’s get started
Agriculture is transforming with the implementation of modern technologies. Technologies such as GPS and satellite image dissemination allow researchers and farmers to gain more information, monitor and manage agricultural resources. Satellite imagery can be a reliable source to track images of how a field is developing.
A common analysis of imagery used in agricultural tools today is Normalized Difference Vegetation Index (NDVI). NDVI is a measurement of plant health that is visually displayed with a legend from -1 to +1. Negative values are indicative of water and moisture. But high NDVI values suggest a dense vegetation canopy. Imagery and yield tend to have a high correlation; thus, it can be used with other data like weather to drive seeding prescriptions.
As an agricultural engineer you are keenly interested in crop health for all the farms and fields that you manage. The healthier the crop the better the yield and the more profit the farm will produce. Let's assume you have mapped all your fields and the coordinates are available in BQ. You now want to calculate the NDVI of every field, along with the average temperature for different months, to ensure the crop is healthy and take necessary action if there is an unexpected fall in NDVI. So the question is how do we pull NDVI and temperature information into BigQuery for the fields by only using SQL?
Using GEE’s ready-to-go Landsat 8 imagery we can calculate NDVI for any given point on the planet. Similarly, we can use the publicly available ERA5 dataset of monthly climate for global terrestrial surfaces to calculate the average temperature for any given point.
Architecture
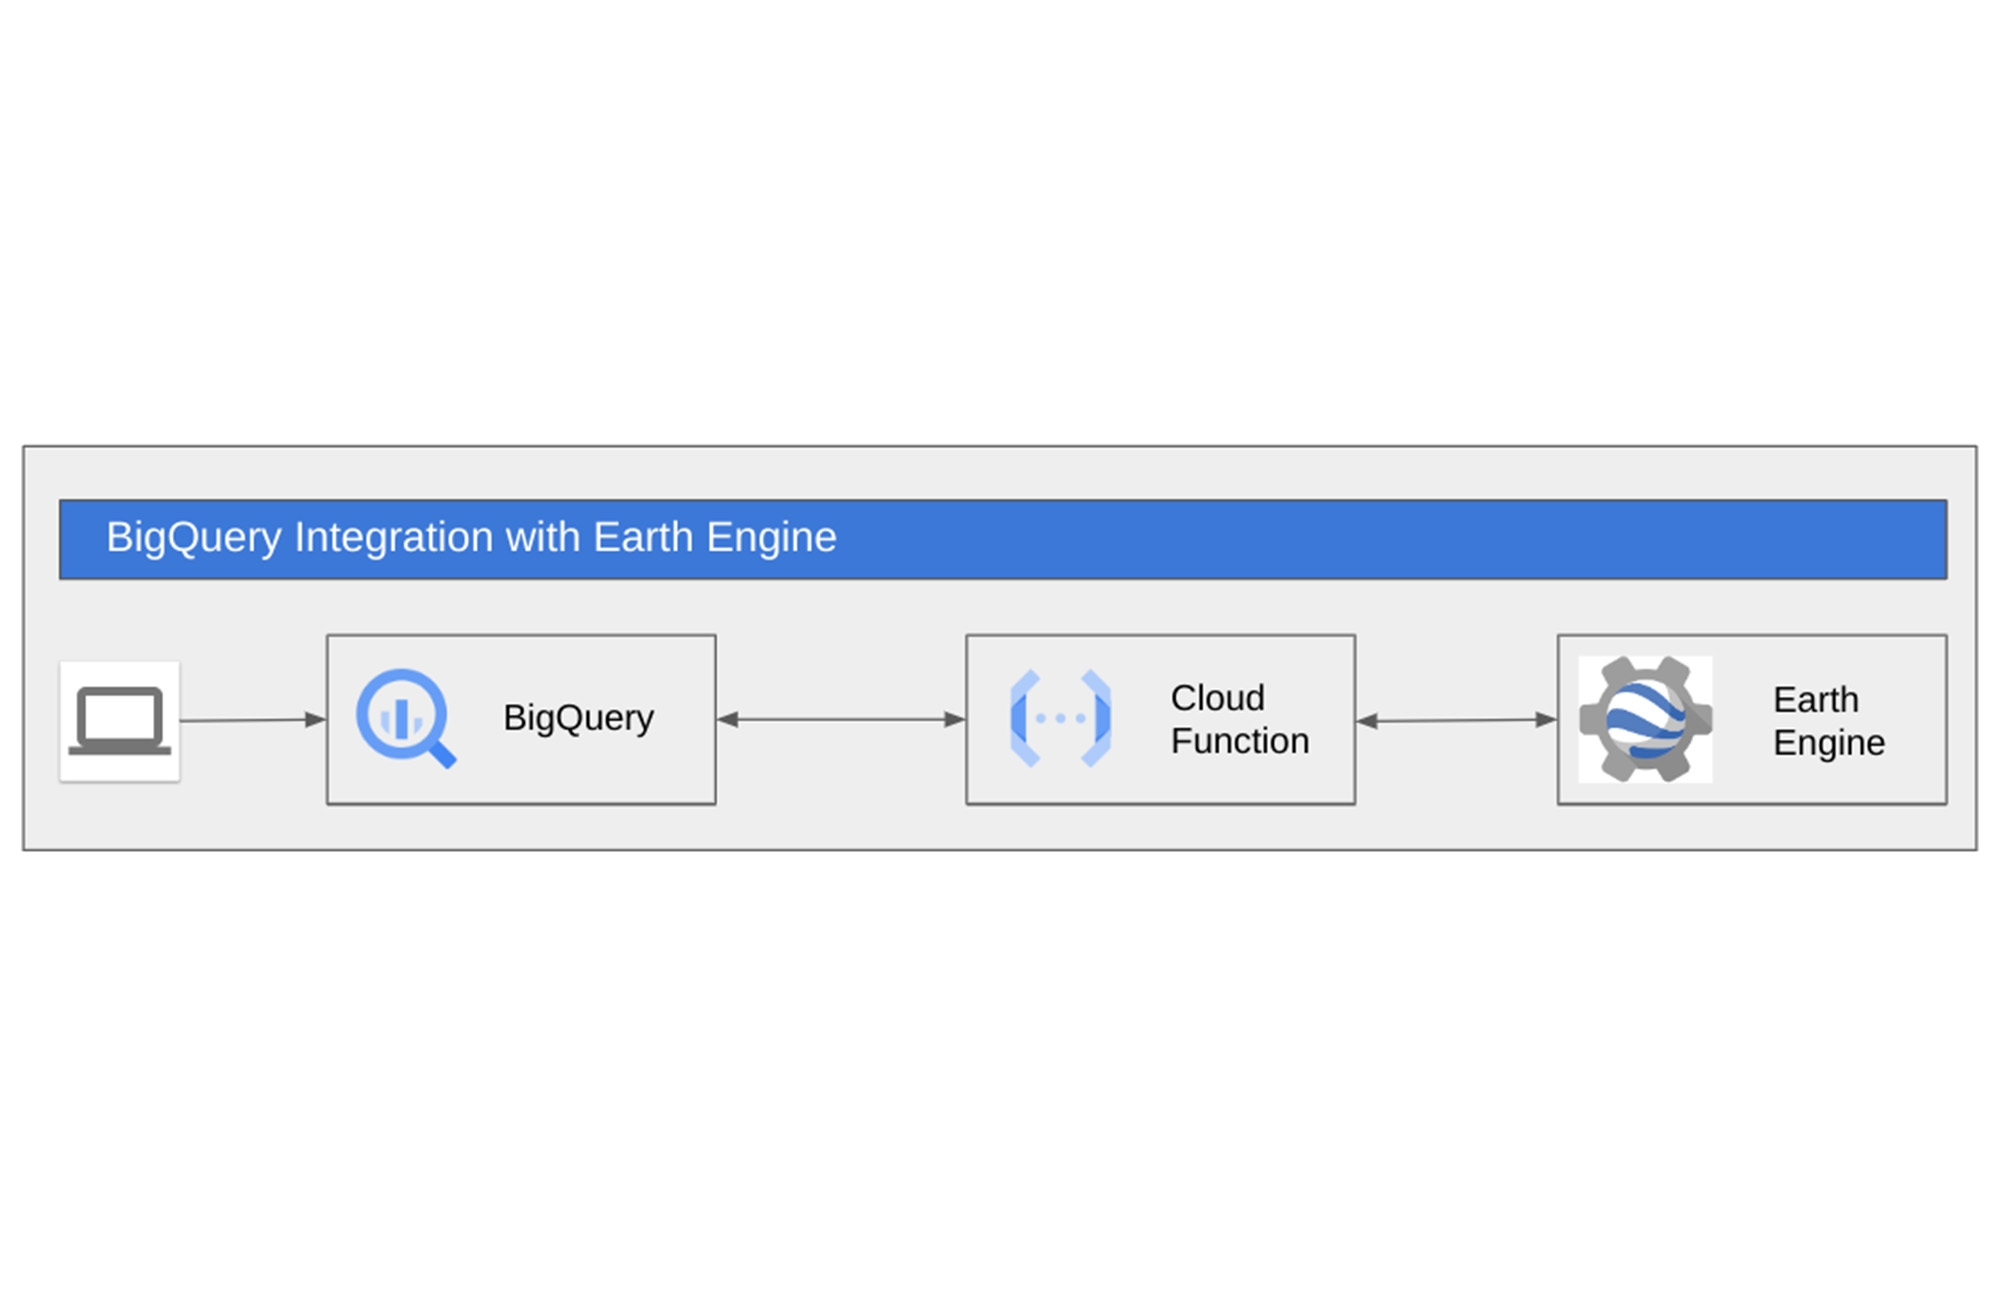
Cloud Functions are a powerful tool to augment the SQL commands in BigQuery. In this case we are going to wrap a GEE script within a Cloud Function and call that function directly from BigQuery’s SQL. Before we start, let's get the environment set up.
Environment setup
Before you proceed we need to get the environment setup:
A Google Cloud project with billing enabled. (Note: this example cannot run within the BigQuery Sandbox as a billing account is required to run Cloud Functions)
Ensure your GCP user has access to Earth Engine, can create Service accounts and assign roles. You can sign up for Earth Engine at Earth Engine Sign Up. Verify if you have access, check if you can view the Earth Engine Code Editor with your GCP user.
At this point Earth Engine and BigQuery are enabled and ready to work for you. Now let’s set up the environment and define the cloud functions.
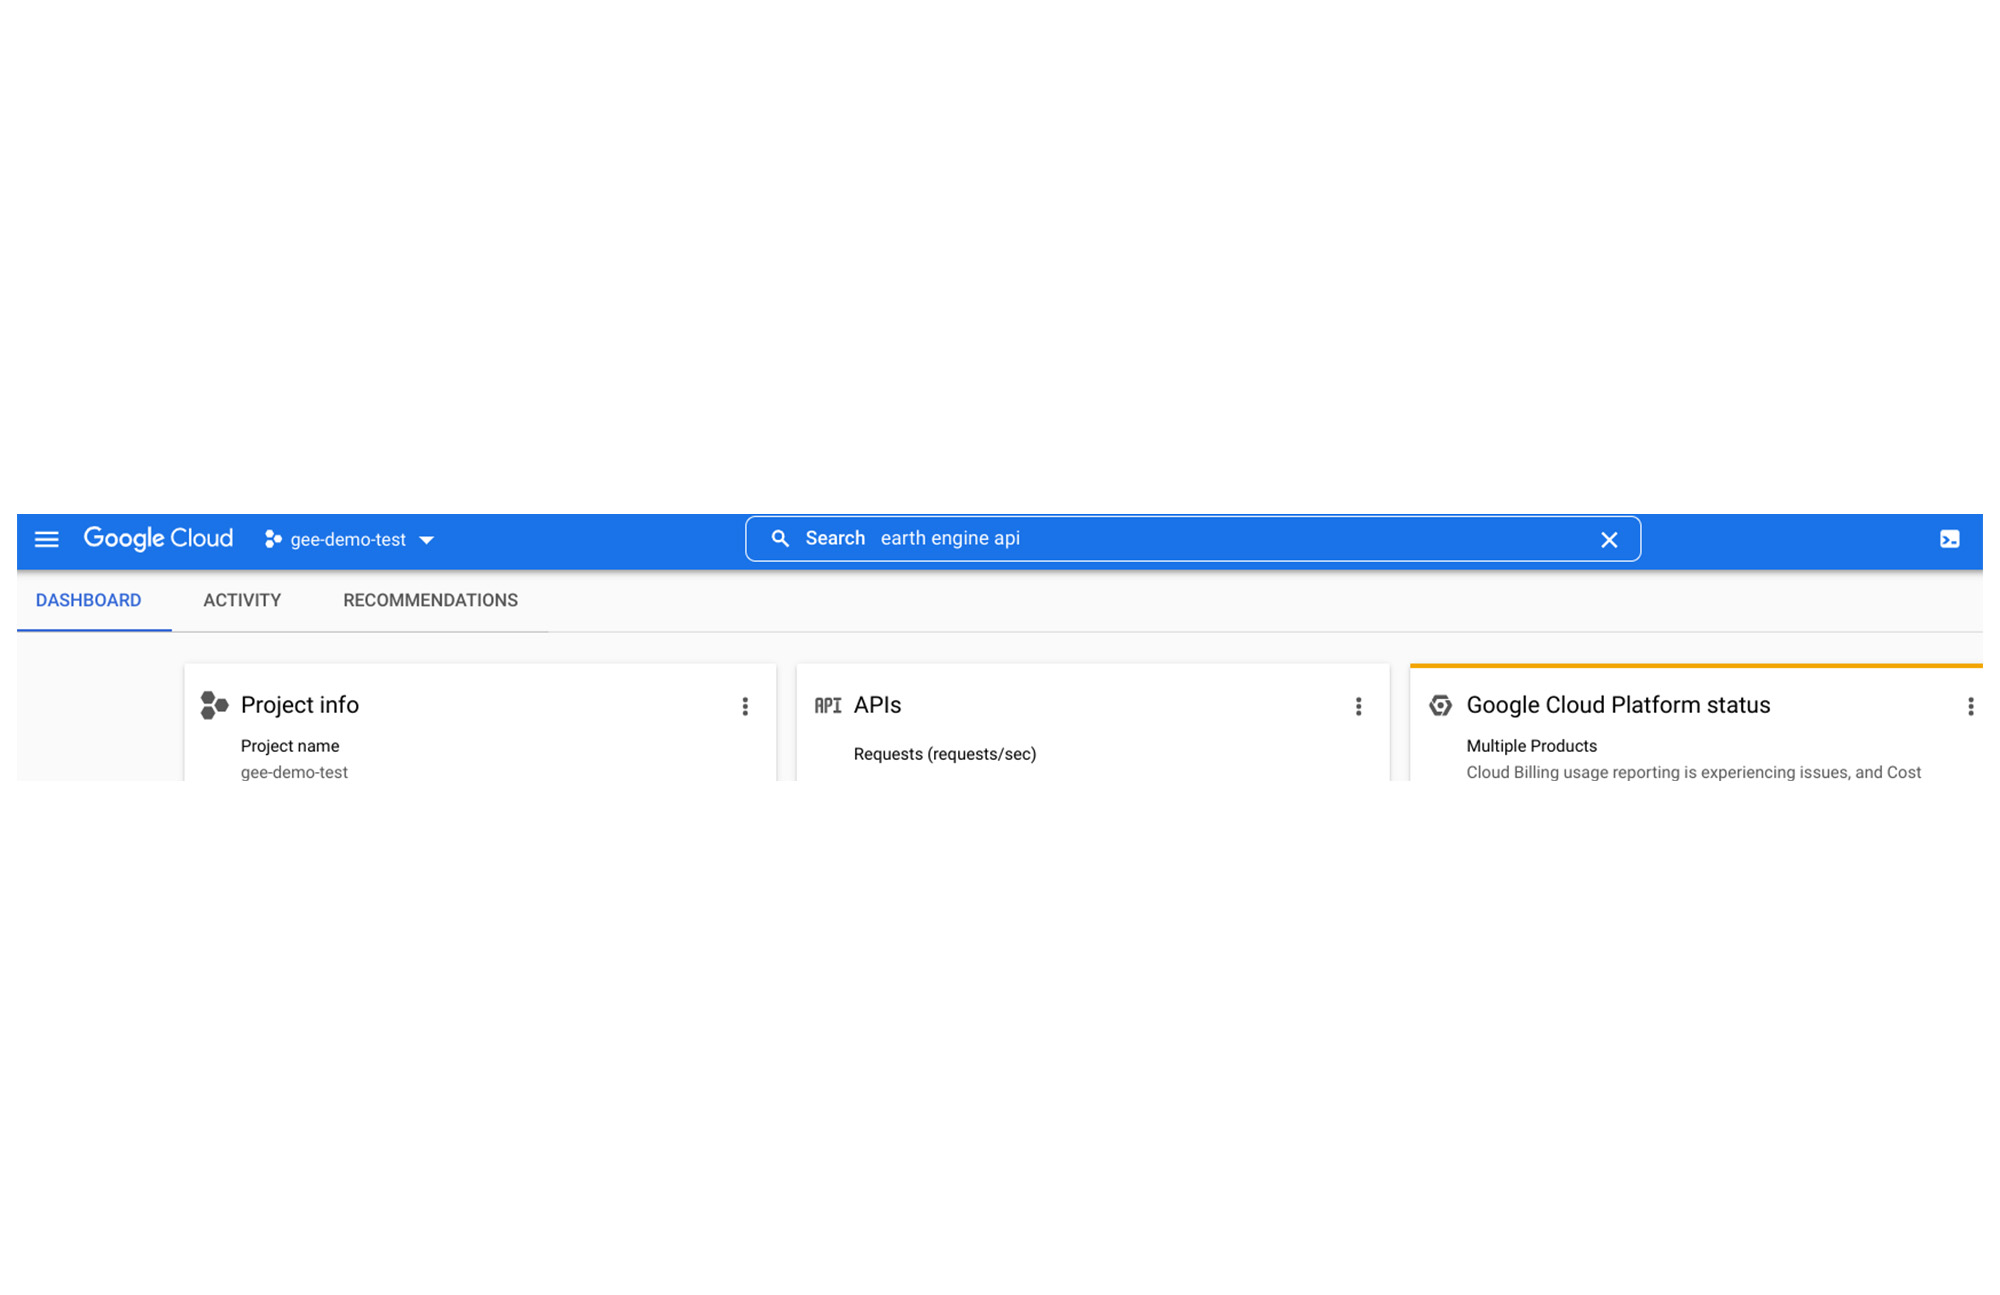
1. Once you have created your project in GCP, select it on the console and click on cloud-shell.
2. On cloud-shell, you will need to clone a git repository which contains the shell script and assets required for this demo. Run the following command on cloud shell,
3. Edit config.sh - In your editor of choice update the variables in config.sh to reflect your GCP project.
4. Execute setup_sa.sh. You will be prompted to authenticate and you can choose “n” to use your existing auth.
4. If the shell script has executed successfully, you should now have a new Service Account created, as shown in the image below
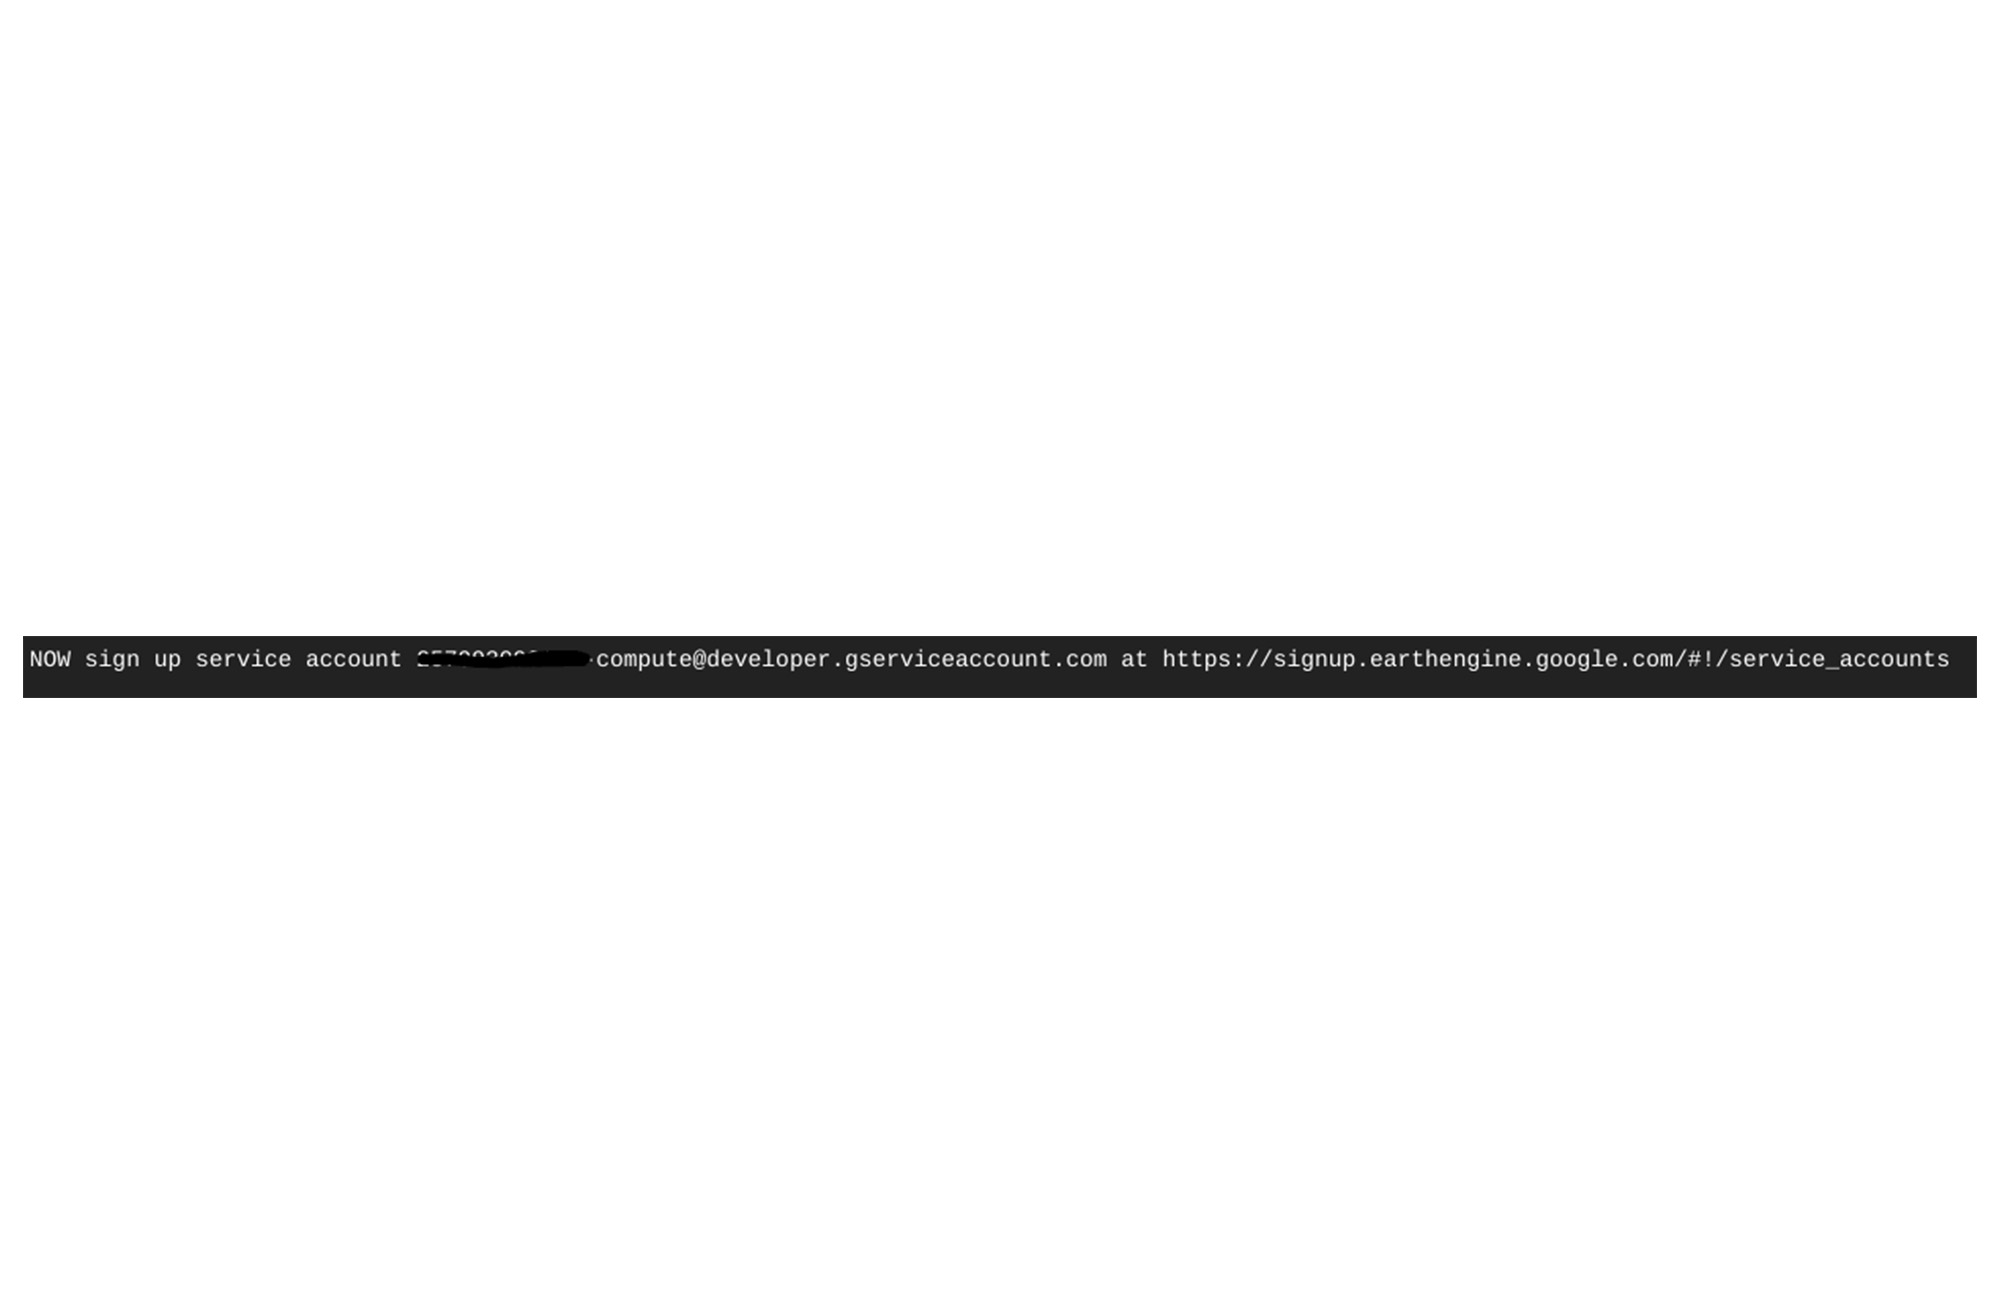
5. A Service Account(SA) in format <PROJECT_NUMBER>-compute@developer.gserviceaccount.com was created in the previous step, you need to sign up this SA for Earth Engine at EE SA signup. Check out the last line of the screenshot above it will list out SA name
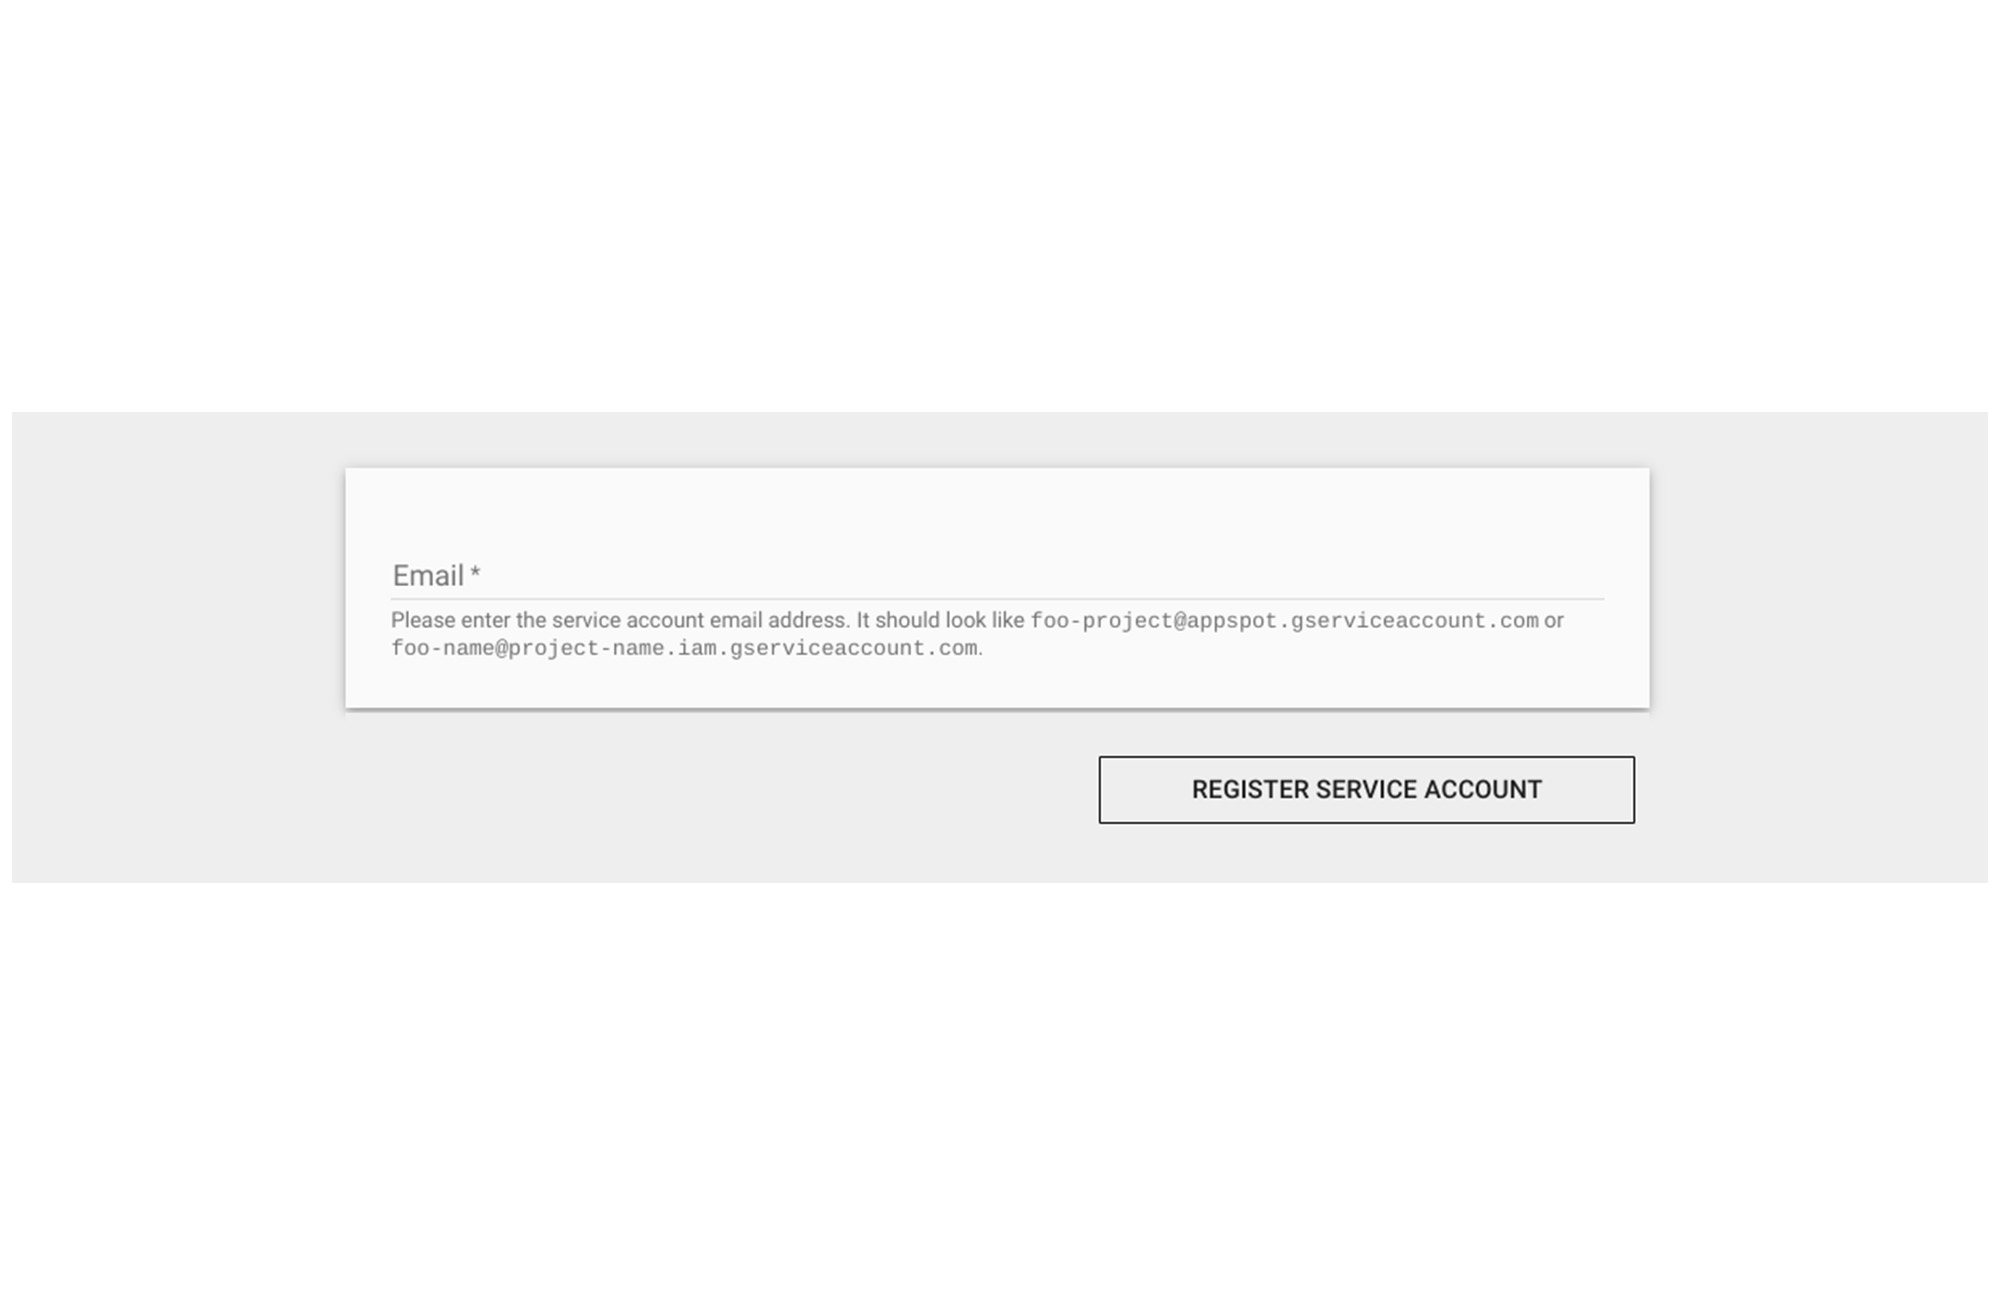
The screenshot below shows how the signup process looks for registering your SA.
6. Execute deploy_cf.sh, it should take around 10 minutes for the deployment to complete.
You should now have a dataset named gee and table land_coords under your project in BigQuery along with the functions get_poly_ndvi_month and get_poly_temp_month.
You will also see a sample query output on the Cloud shell, as shown below
7. Now execute the command below in Cloudshell
and you should see something like this
If you are able to get a similar output to one shown above, then you have successfully executed SQL over Landsat imagery.
Now navigate to the BigQuery console and your screen should look something like this: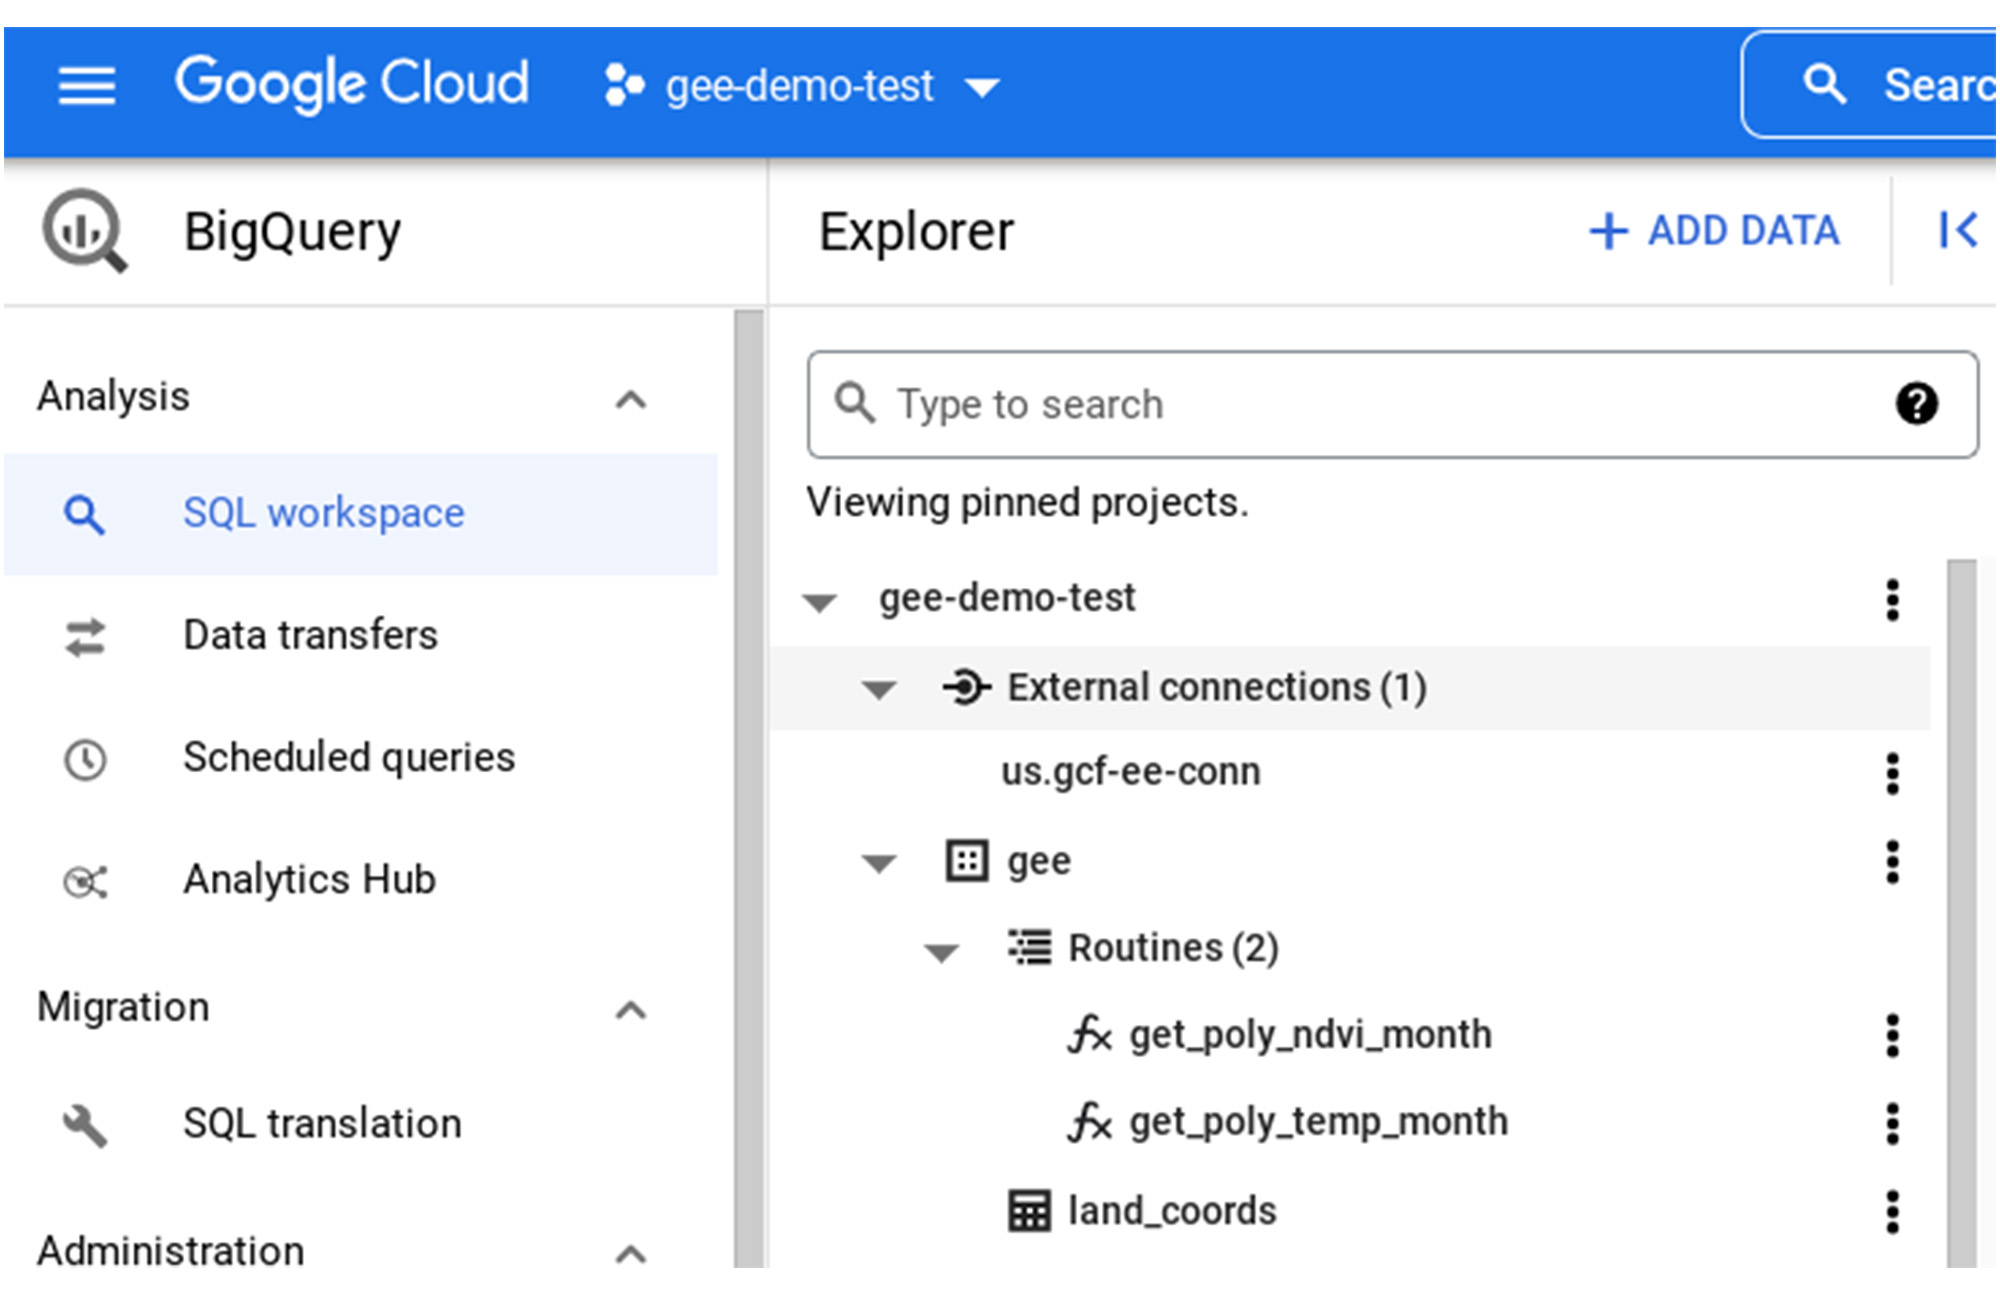
You should see a new external connection us.gcf-ee-conn, two external routines called get_poly_ndvi_month, get_poly_temp_month and a new table land_coords.
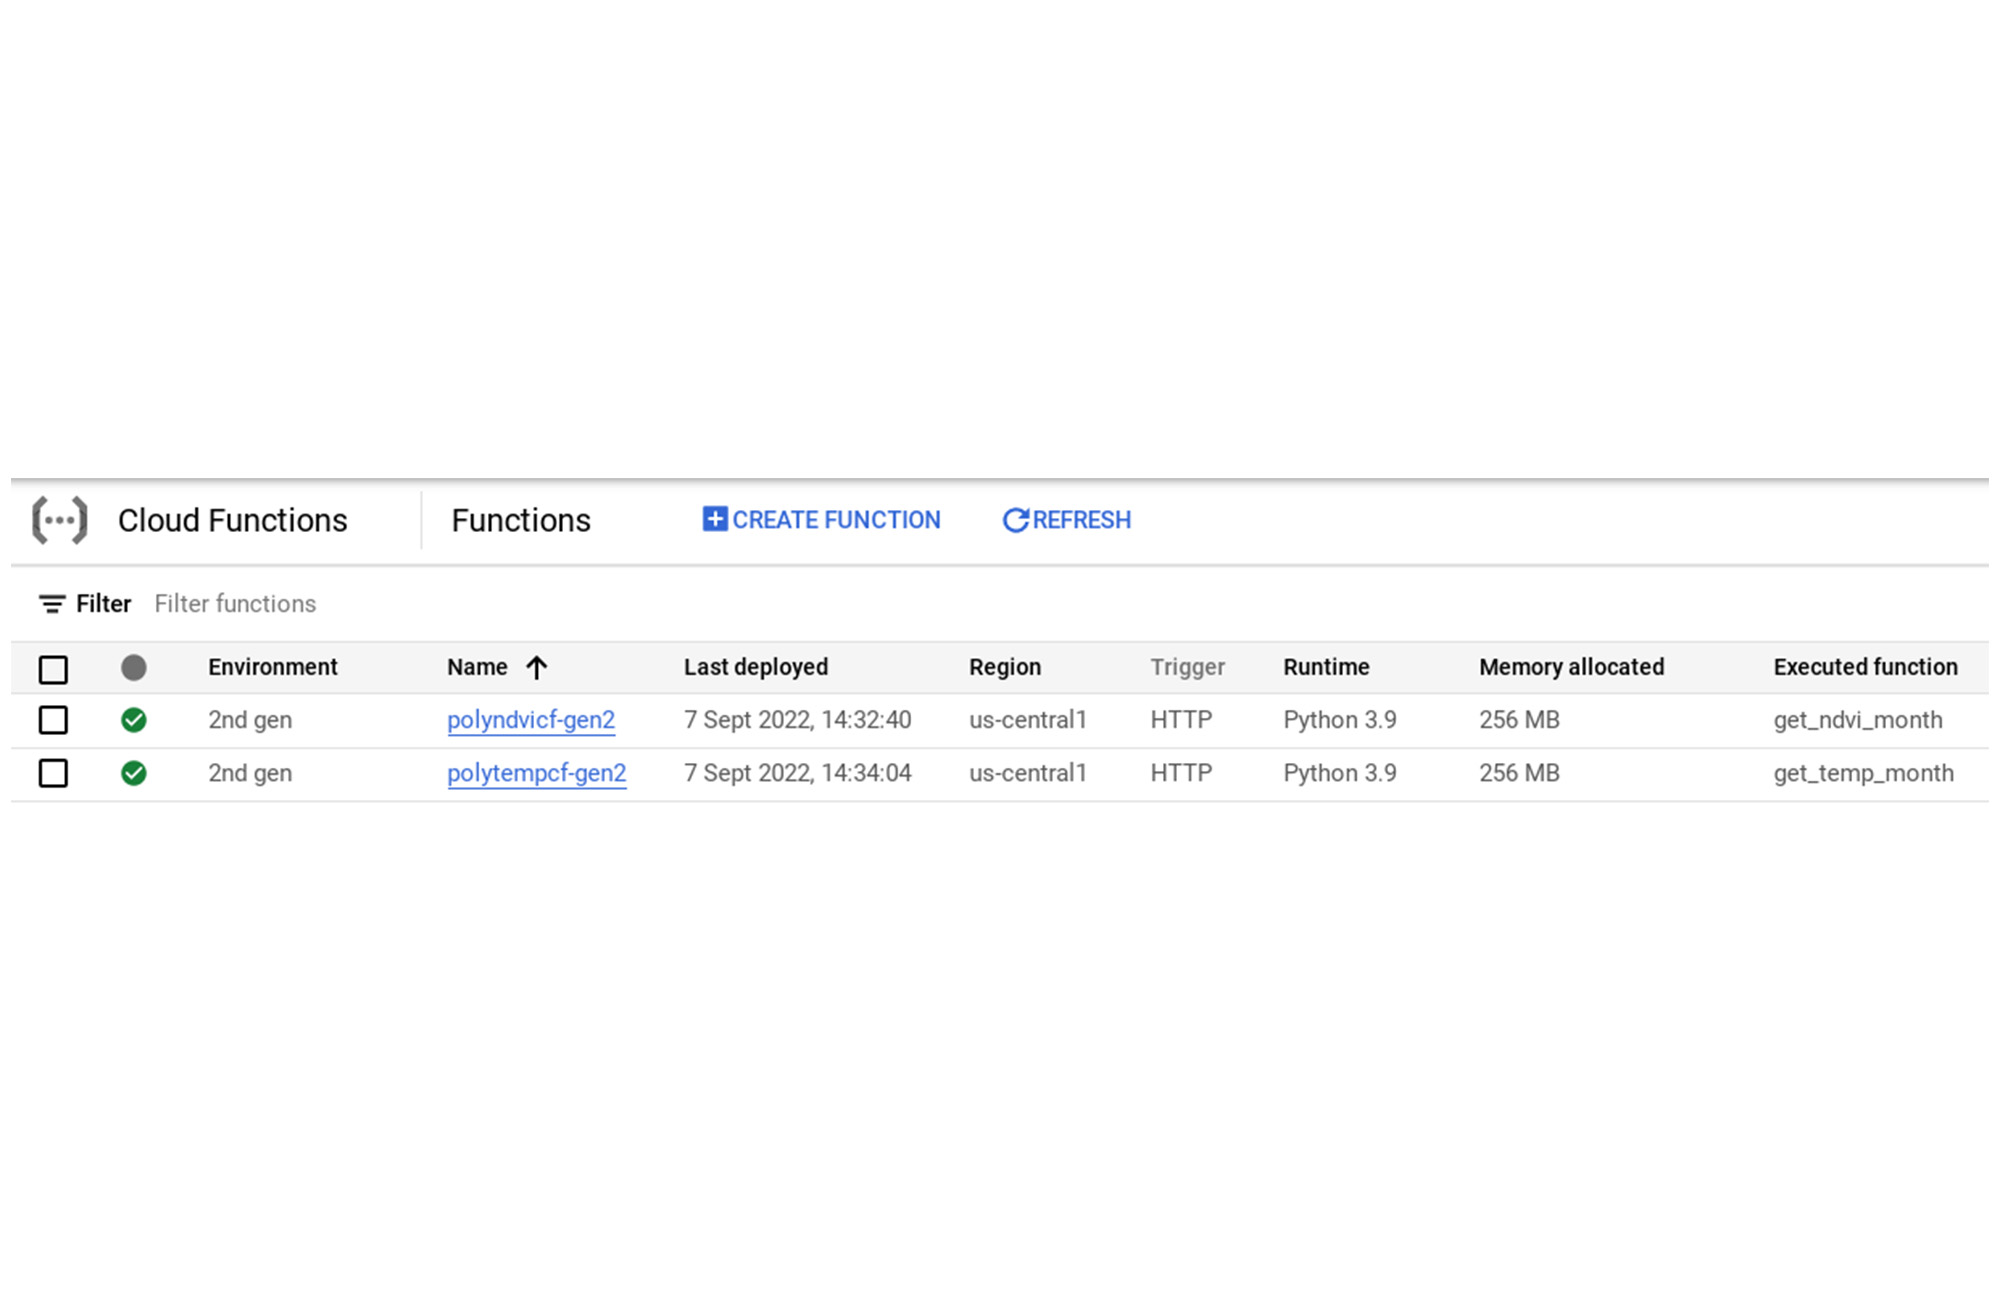
Next navigate to the Cloud functions console and you should see two new functions polyndvicf-gen2 and polytempcf-gen2 as shown below.
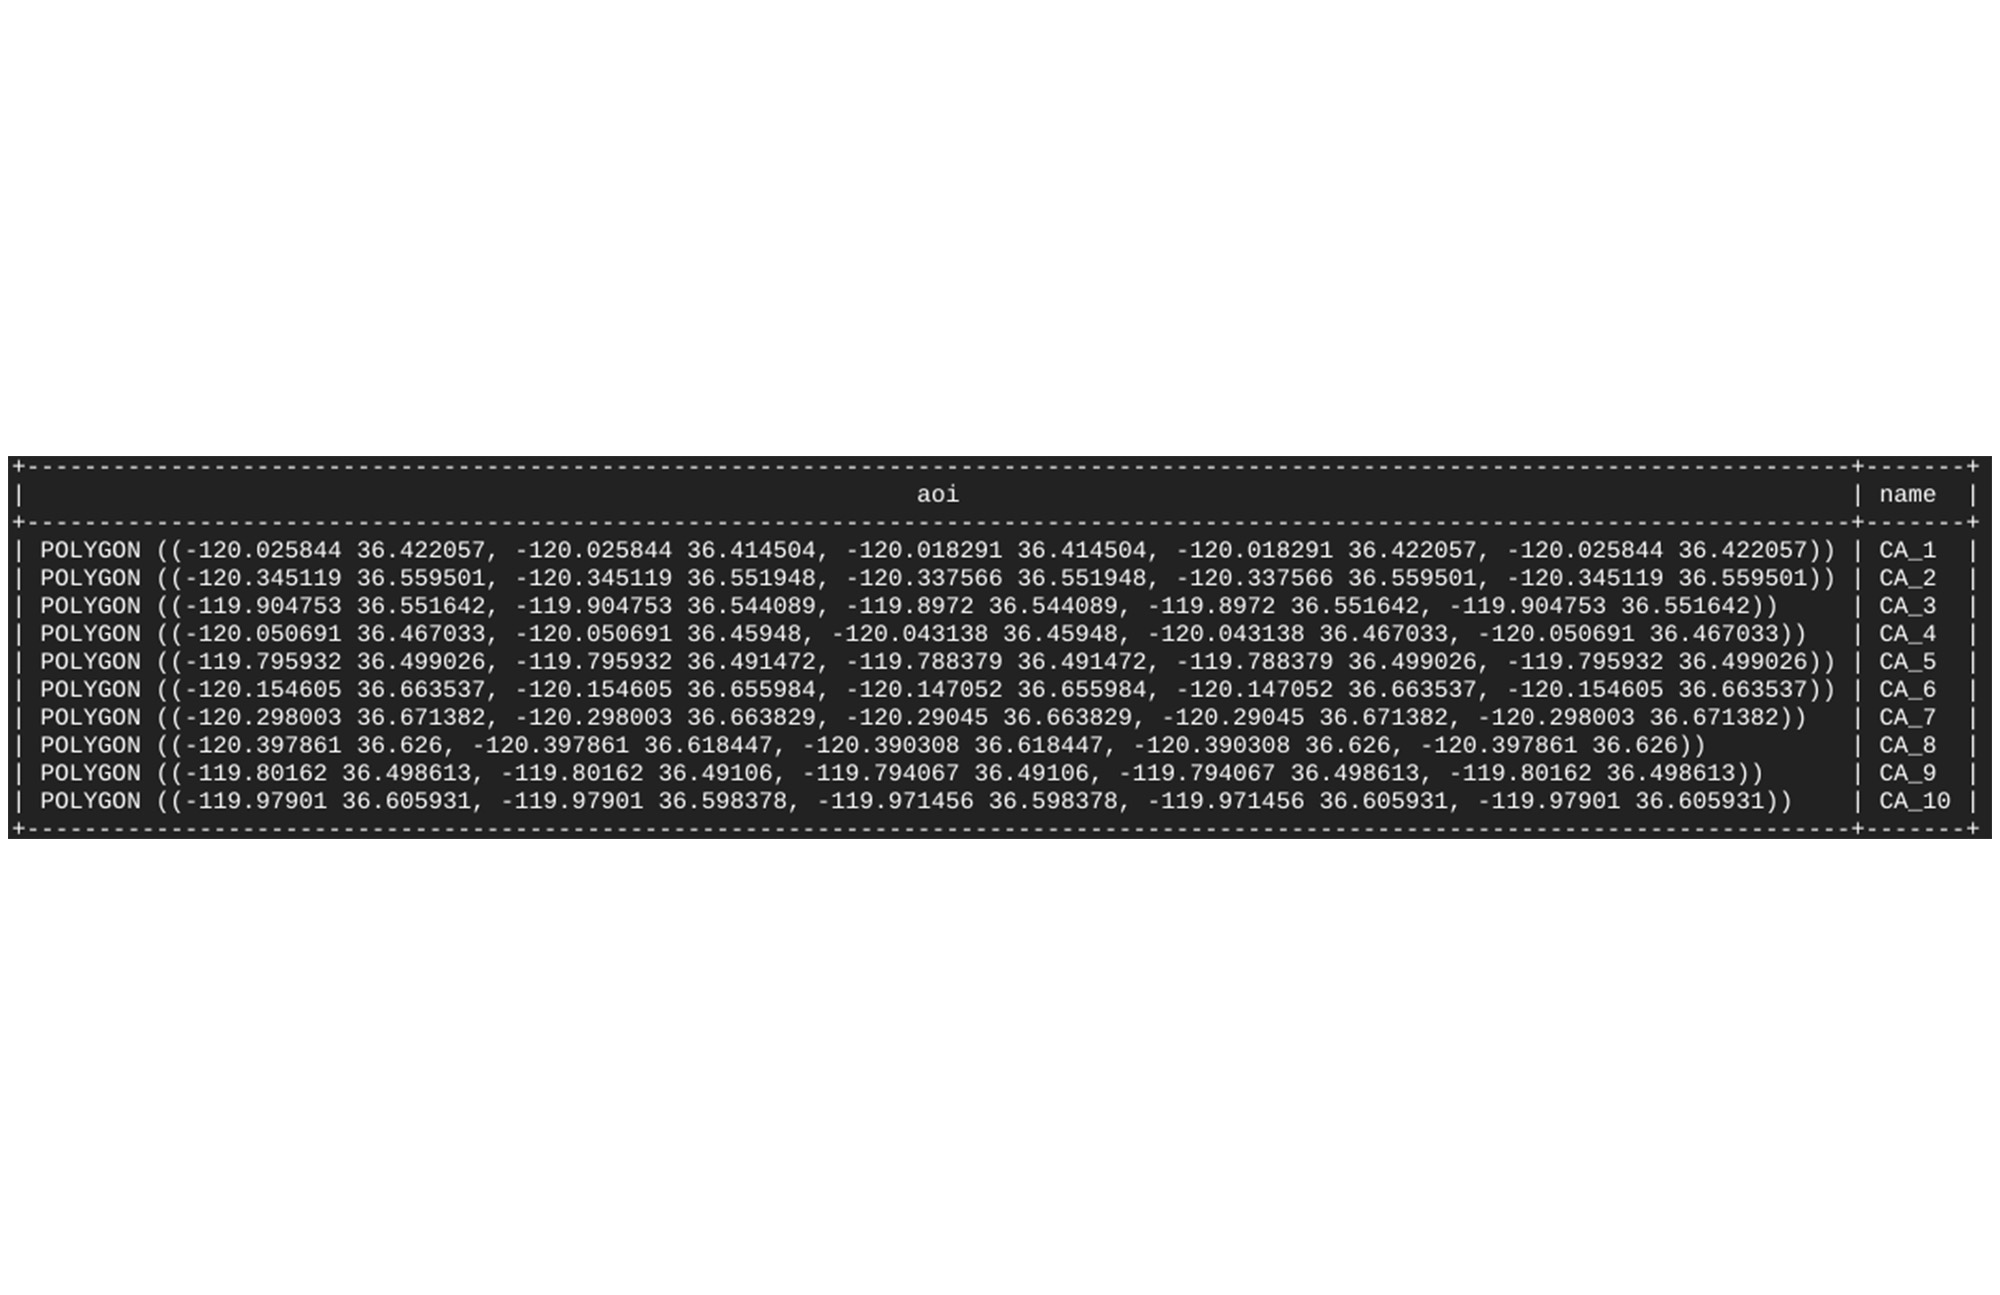
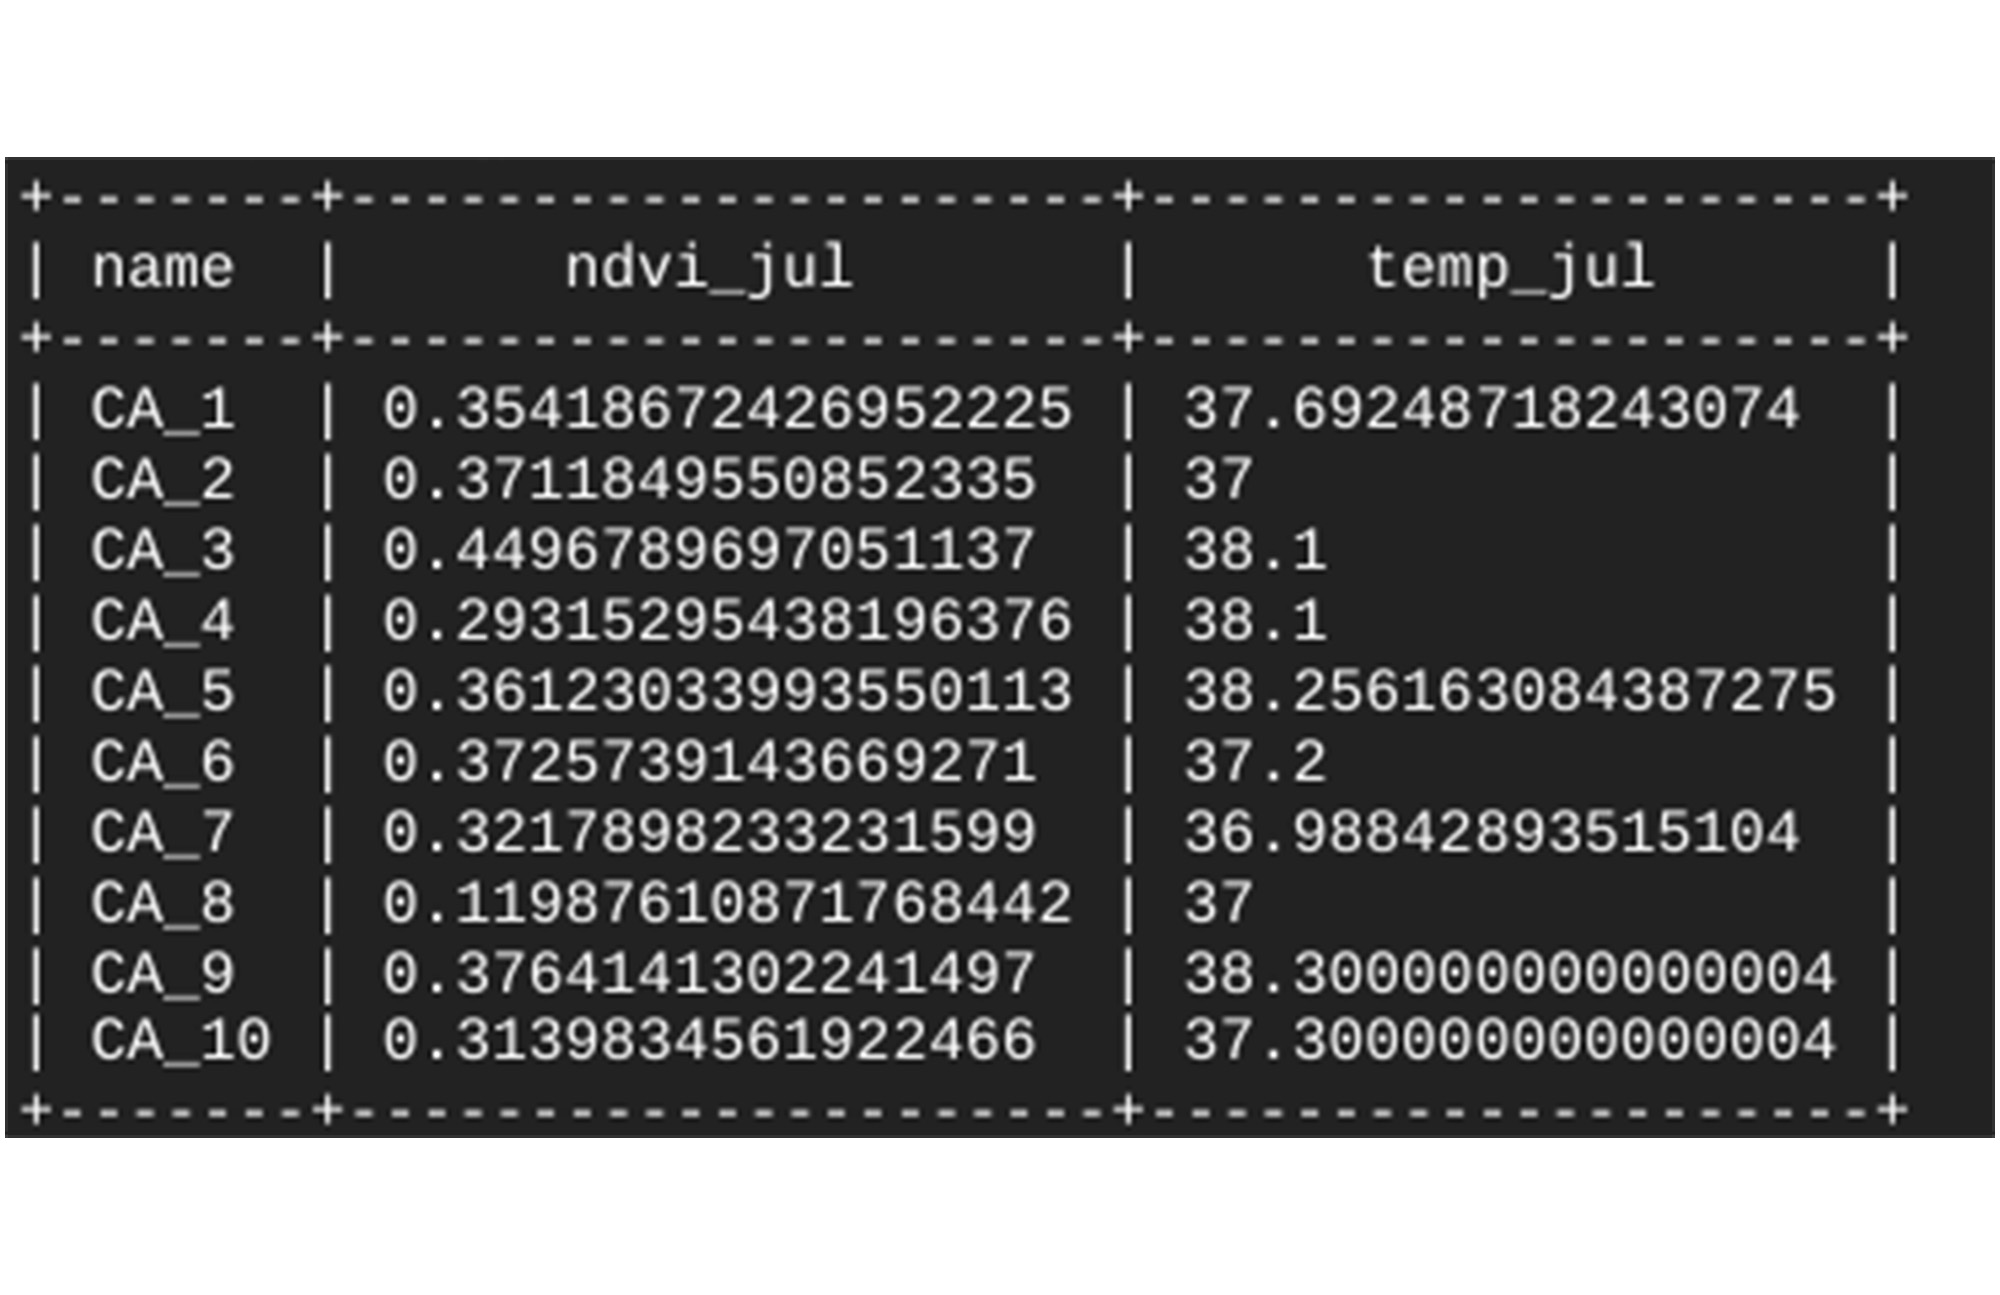
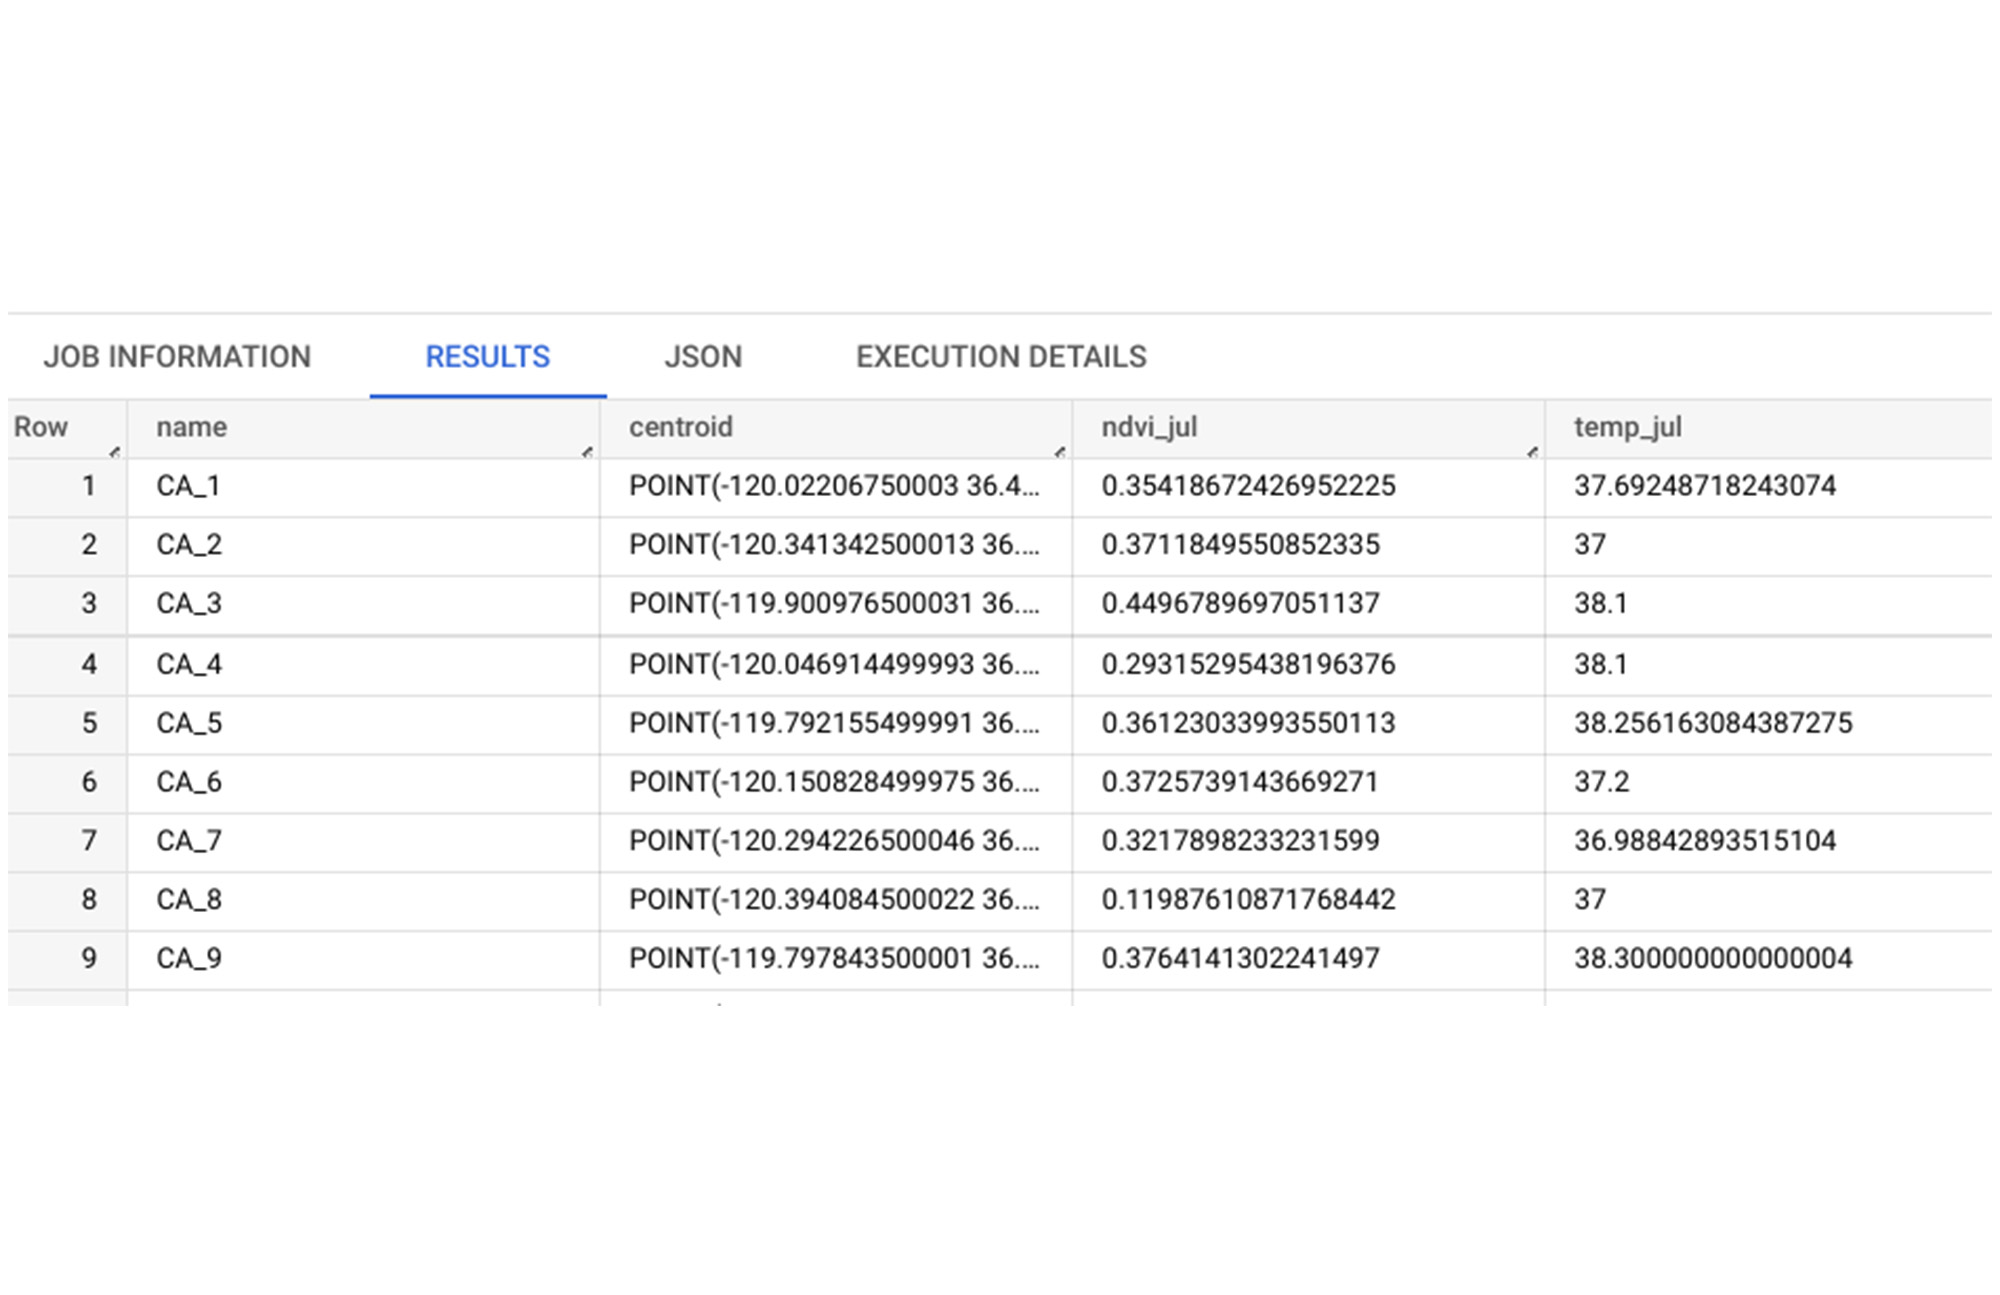
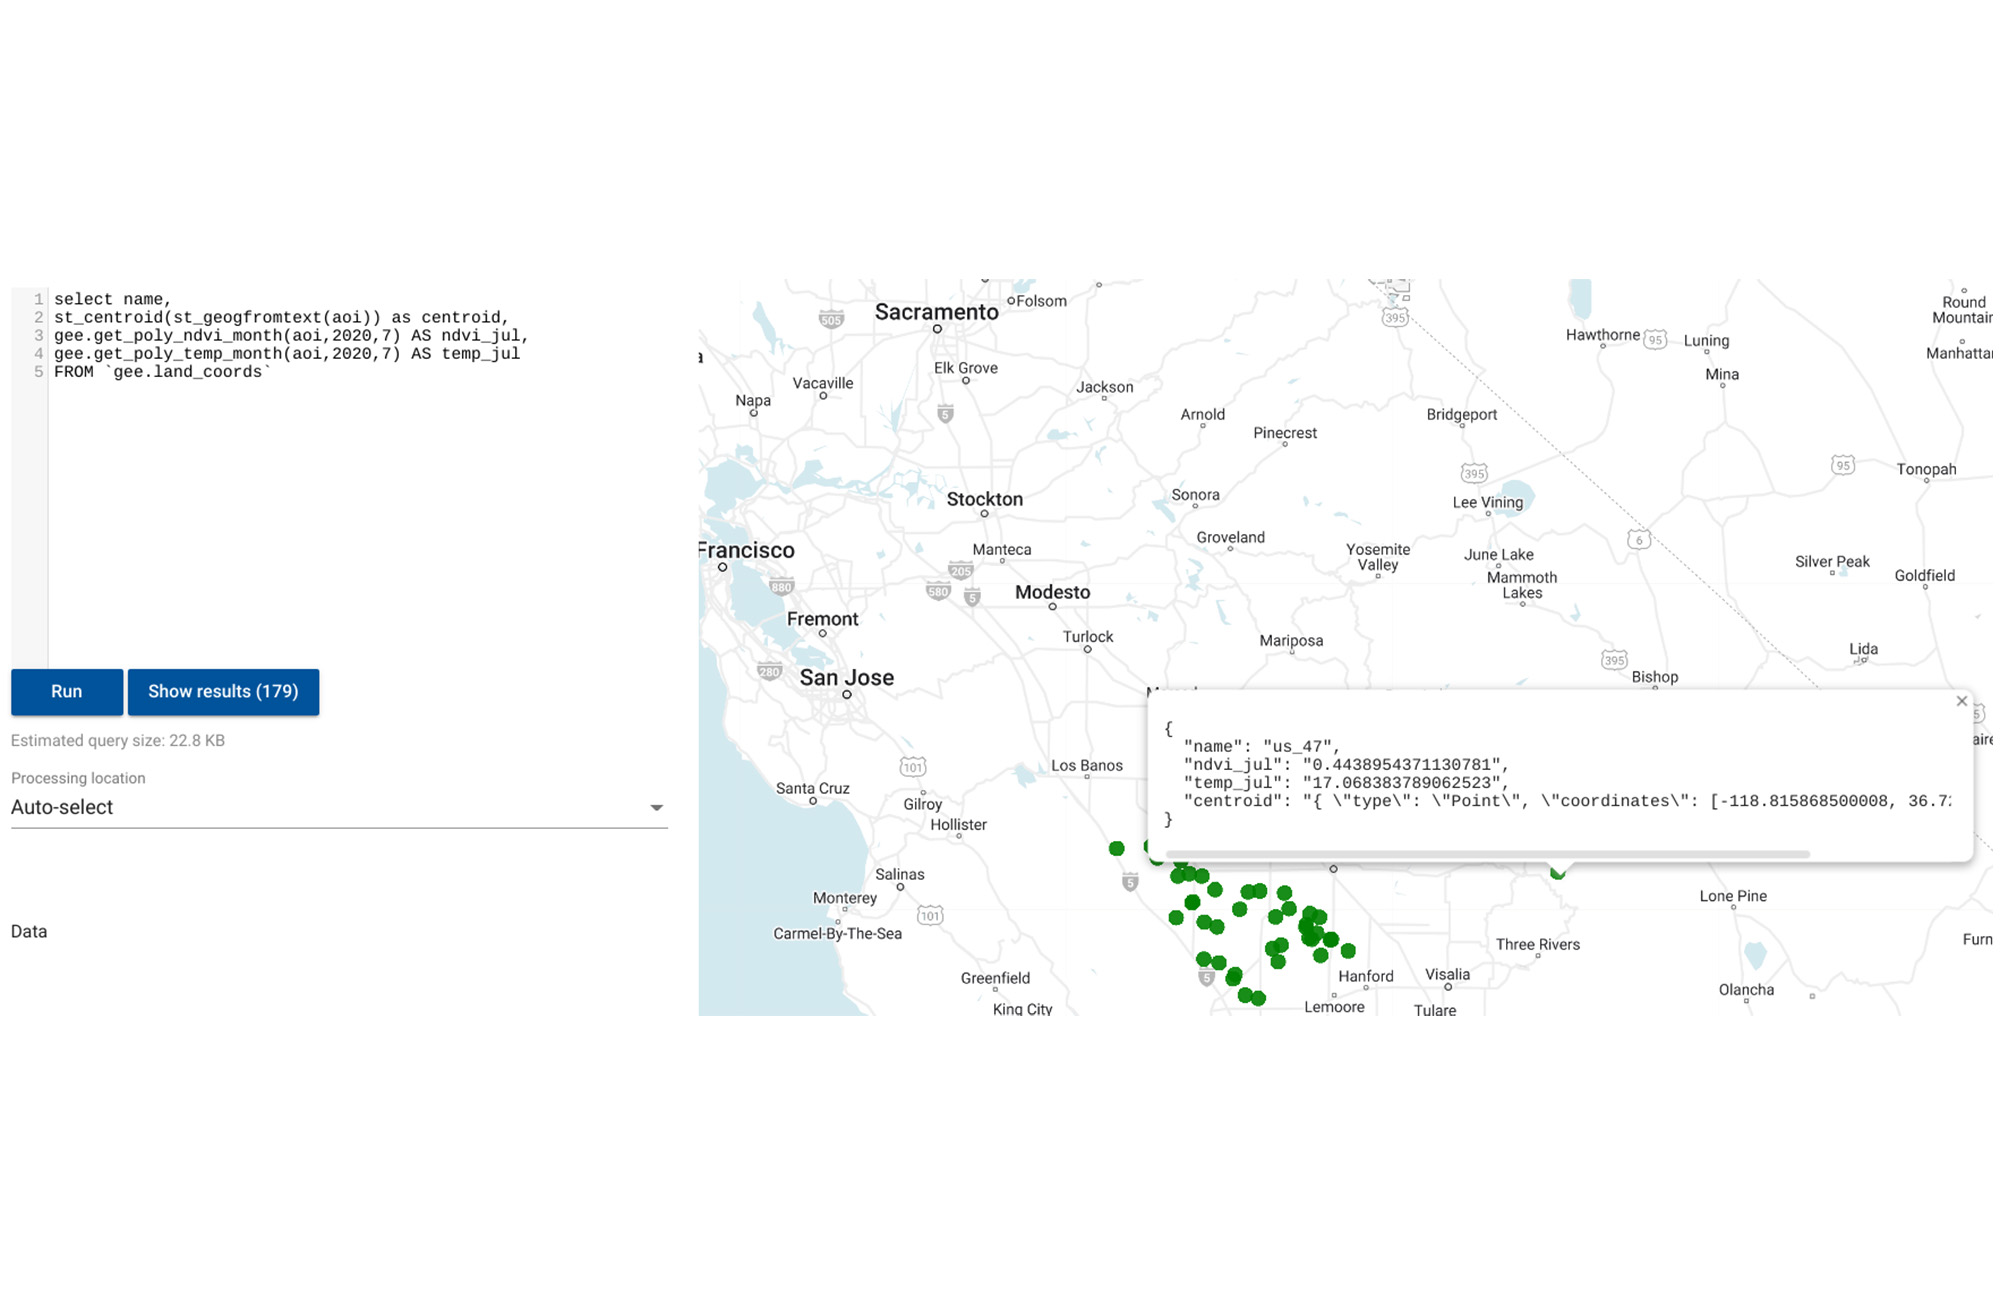
At this stage your environment is ready. Now you can go to the BQ console and execute queries. The query below calculates the NDVI and temperature for July 2020 for all the field polygons stored in the table land_coords
The output should look something like this:
When the user executes the query in BQ, the function get_poly_ndvi_month and get_poly_temp_month trigger remote calls to the cloud functions polyndvicf-gen2 and polytempcf-gen2 which would initiate the script on GEE. The results from GEE are streamed back to the BQ console and shown to the user.
What’s Next?
You can now plot this data on a map in Data Studio or Geoviz and publish it to your users
Now that your data is within BigQuery, you can join this data with your private datasets or other public datasets within BigQuery and build ML models using BigQuery ML to predict crop yields, seed prescriptions.
Summary
The example above demonstrates how users can wrap GEE functionality within Cloud Functions so that GEE can be executed exclusively within SQL. The method we have described requires someone who can write GEE scripts. The advantage is that once the script is built, all of your SQL-speaking data analysts-scientists-engineers can do calculations on vast troves of satellite imagery in GEE directly from the BigQuery UI or API.
Once the data and results are in BigQuery you can join the data with other tables in BigQuery or with the data available through Analytics Hub. Additionally with this method, users can combine GEE data with other functionality such as geospatial functions or BQML. In future we’ll expand our examples to include these other BigQuery capabilities.
Thanks for reading, and remember, if you are interested in learning more about how to move data from BigQuery to Earth Engine together, check out this blog post. The post outlines a solution for a sustainable sourcing use case for a fictional consumer packaged goods company trying to understand their palm oil supply chain which is primarily located in Indonesia.
Acknowledgements: Shout out to David Gibson and Chao Shen for valuable feedback.