Save on GPUs: Smarter autoscaling for your GKE inferencing workloads
Anna Pendleton
Software Engineer
Luiz Oliveira
GKE Software Engineer
Try Gemini 3.1 Pro
Our most intelligent model available yet for complex tasks on Gemini Enterprise and Vertex AI
Try nowWhile LLM models deliver immense value for an increasing number of use cases, running LLM inference workloads can be costly. If you’re taking advantage of the latest open models and infrastructure, autoscaling can help you optimize your costs — ensuring you’re meeting customer demand while only paying for the AI accelerators you need.
As a managed container orchestration service, Google Kubernetes Engine (GKE) makes it easy to deploy, manage, and scale your LLM inference workloads. When you set up your inference workloads on GKE, consider using Horizontal Pod Autoscaler (HPA), an efficient and simple way to ensure that your model servers scale appropriately with load. By fine-tuning the HPA settings, you can match your provisioned hardware costs to your incoming traffic demands to achieve your desired inference server performance objectives.
Configuring autoscaling for LLM inference workloads can also be challenging, so we've compared multiple metrics for autoscaling on GPUs utilizing ai-on-gke/benchmarks in order to provide best-practices. This setup uses the Text-Generation-Inference (TGI) model server and HPA. Note that these experiments are applicable to other inference servers that implement similar metrics, such as vLLM.
Choosing the right metric
Below, you’ll see some example experiments from our metrics comparison, visualized with Cloud Monitoring dashboards. For each experiment, we ran TGI with Llama 2 7b on a single L4 GPU g2-standard-16 machine with the HPA custom metrics stackdriver adapter and used the ai-on-gke locust-load-generation tool to generate traffic with varying request sizes. We used the same traffic load on each experiment displayed below. The thresholds below were identified experimentally.
Note that the mean-time-per-token graph is TGI's metric for the combined duration of prefill and decode divided by the number of generated output tokens per request. This metric enables us to compare how autoscaling with different metrics impacts latency.
GPU utilization
The default metrics for autoscaling are CPU or memory utilization. This works well for workloads that run on CPUs. However, for inference servers, these metrics are no longer a good sole indicator of job resource utilization because inference servers primarily rely on GPUs. An equivalent metric for GPUs is GPU utilization. GPU utilization represents the GPU duty cycle, which is the amount of time that the GPU is active.
The graphs below show HPA autoscaling on GPU utilization with a target value threshold at 85%.

The GPU utilization graph does not have a clear relationship to the request mean-time-per-token graph. GPU utilization continues to increase even though the request mean-time-per-token is decreasing, causing HPA to continue to scale up. For LLM autoscaling, GPU utilization is not an effective metric. It is difficult to map this metric to the current traffic that the inference server is experiencing. GPU duty cycle metric does not measure the flops utilization, so it does not indicate how much work the accelerator is doing nor when the accelerator is operating at max capacity. GPU utilization tends to overprovision compared to the other metrics below, making it inefficient cost wise.
In short, we do not recommend using GPU utilization for autoscaling inference workloads.
Batch size
Given the limitations of the GPU utilization metric, we also explored the LLM server metrics offered by TGI. The LLM server metrics we explored are already provided by the most popular inference servers.
One of the options we selected was batch size (tgi_batch_current_size), which represents the number of requests processed in each inferencing iteration.
The graphs below show HPA autoscaling on current batch size with a target value threshold at 35.

There is a direct relationship between the current batch size graph and the request mean-time-per-token graph. Smaller batch sizes show smaller latencies. Batch size is a great metric for optimizing for low latency, providing a direct indication of how much traffic the inference server is currently processing. One limitation of the current batch size metric is that it was not easy to trigger scale up when trying to achieve max batch size and thus max throughput, since batch size can vary slightly with diverse incoming request sizes. We had to choose a value slightly lower than the max batch size to ensure that HPA would trigger a scale-up.
We recommend utilizing the current batch size metric if you are looking to target a specific tail latency.
Queue size
The other option from the TGI LLM server metrics we selected was queue size (tgi_queue_size). Queue size represents the number of requests waiting in the inference server queue before they are added to the current batch.
The graphs below show HPA scaling on queue size with a target value threshold of 10.

*Note that the dip in Pod count occurred when the HPA triggered a downscale after the default five minute stabilization period ended. It’s easy to fine tune this stabilization period window, as well as other default HPA configuration options, to meet your traffic demands.
We see that there is a direct relationship between the queue size graph and the request mean-time-per-token graph. Larger queue sizes show higher latencies. We found that queue size was a great metric for autoscaling inference workloads, providing a direct indication of how much traffic the inference server is waiting to process. A growing queue indicates that the batch is full. Since queue size is only related to the number of requests sitting in the queue, rather than the number of requests currently being processed, autoscaling on queue size can not achieve latencies as low as batch size can.
We recommend utilizing queue size if you are looking to maximize throughput while controlling tail latency.
Identifying target value thresholds
To further showcase the power of the queue and batch size metrics, we used the profile-generator in ai-on-gke/benchmarks to identify what thresholds to use for these experiments. We chose our thresholds accordingly:
-
To represent an optimal throughput workload, we identified the queue size at the point where throughput was no longer growing, and only latency was growing.
-
To represent a latency-sensitive workload, we chose to autoscale on a batch size at a latency threshold of ~80% of the optimal throughput.
Below is the throughput vs. latency graph that we created using data from the profile-generator in ai-on-gke/benchmarks:
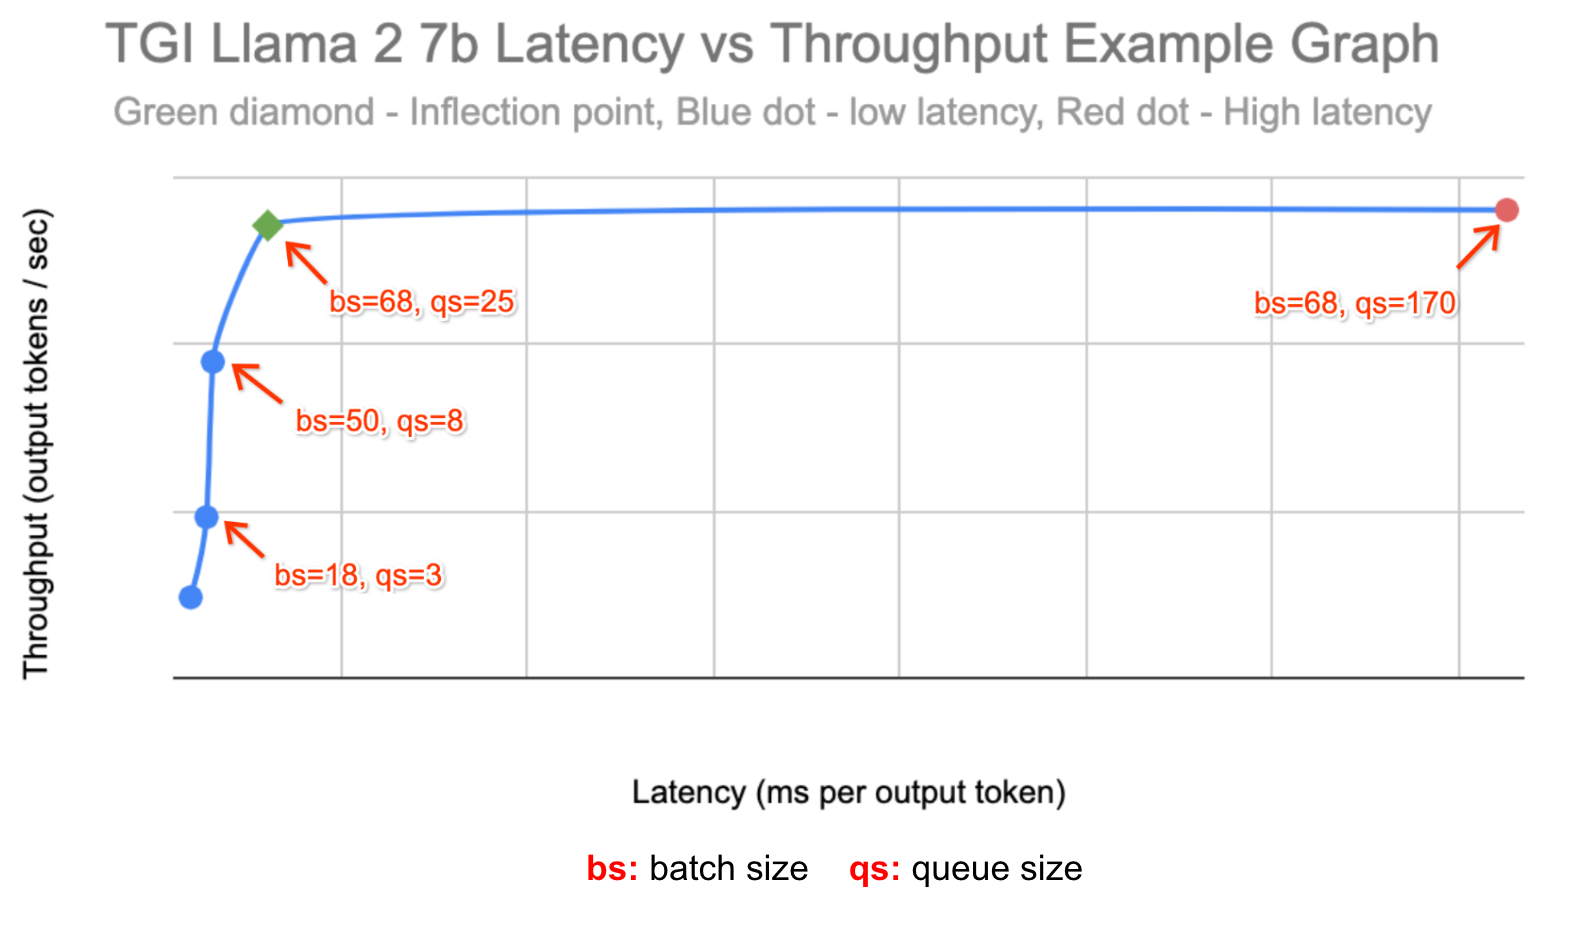
For each experiment, we ran TGI with Llama 2 7b on a single L4 GPU on two g2-standard-96 machines with the HPA custom metrics stackdriver enabling autoscaling between 1 to 16 replicas. We used the ai-on-gke locust-load-generation tool to generate traffic with varying request sizes. We identified a load that stabilized at ~10 replicas, then simulated traffic spikes by increasing the load by 150%.
Queue size
The graphs below show HPA scaling on queue size with a target value threshold of 25.
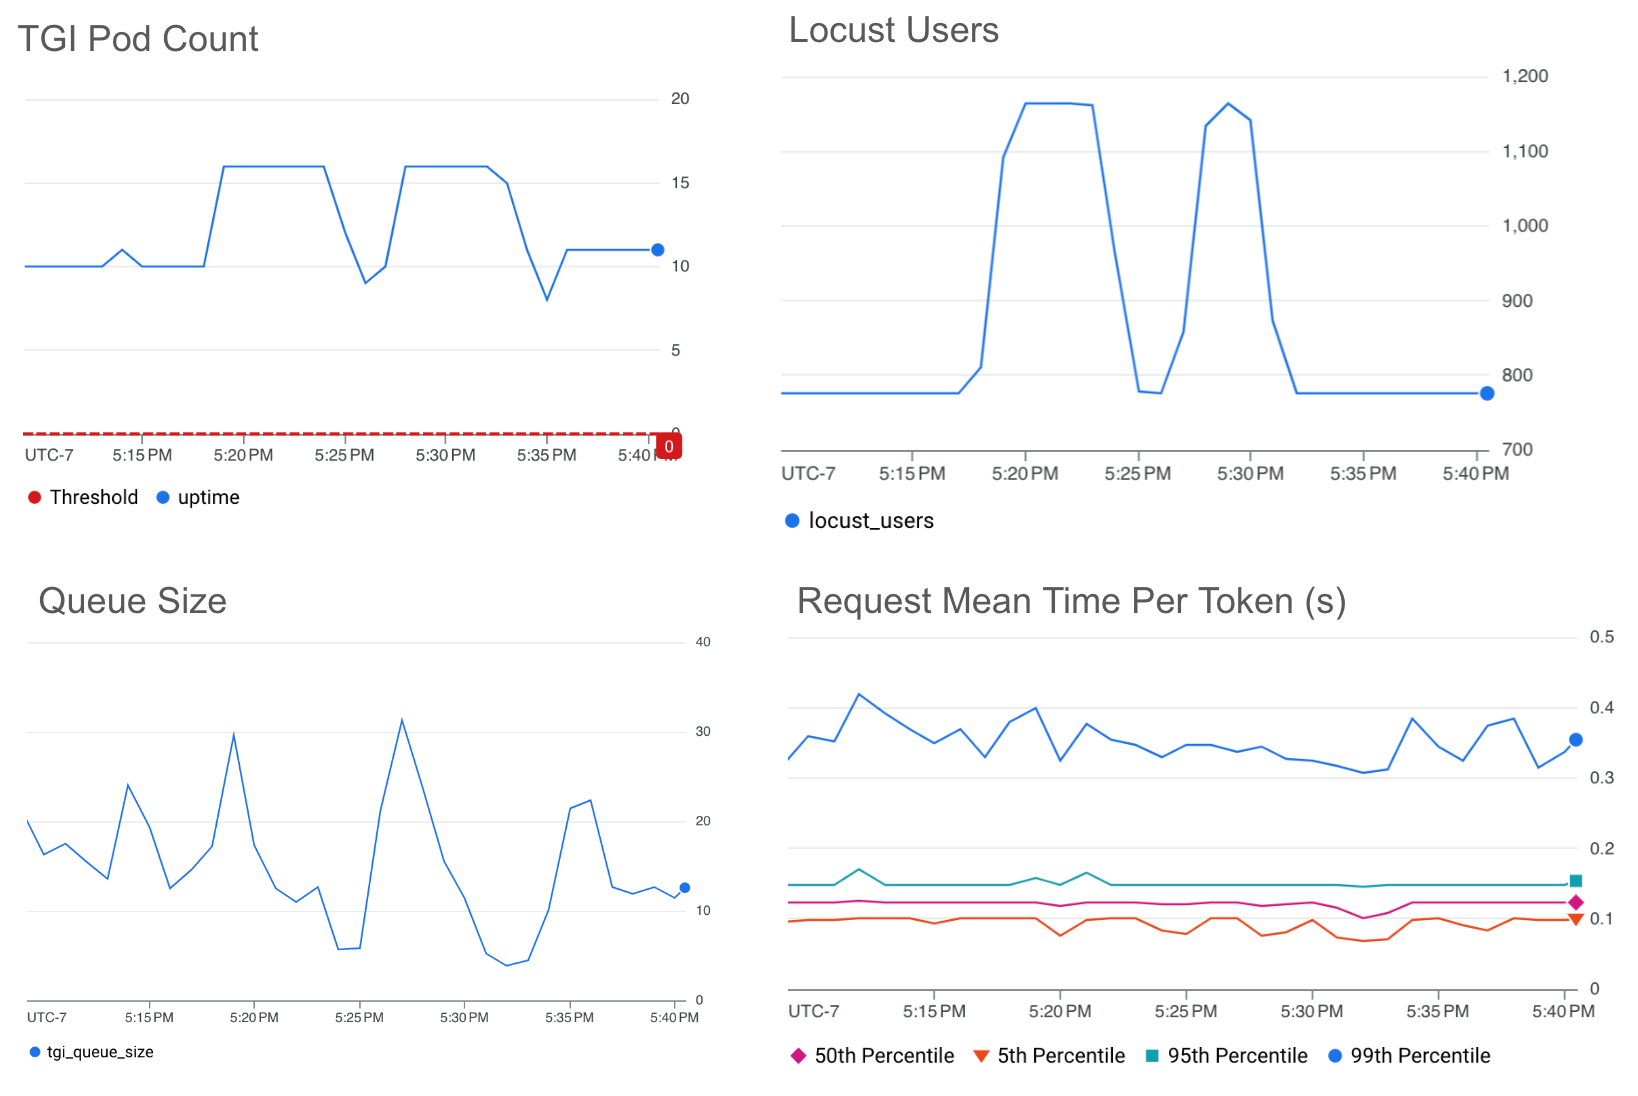
We see that our target threshold is able to maintain a mean-time-per-token below ~0.4s even with the 150% traffic spikes.
Batch size
The graphs below show HPA scaling on batch size with a target value threshold of 50.
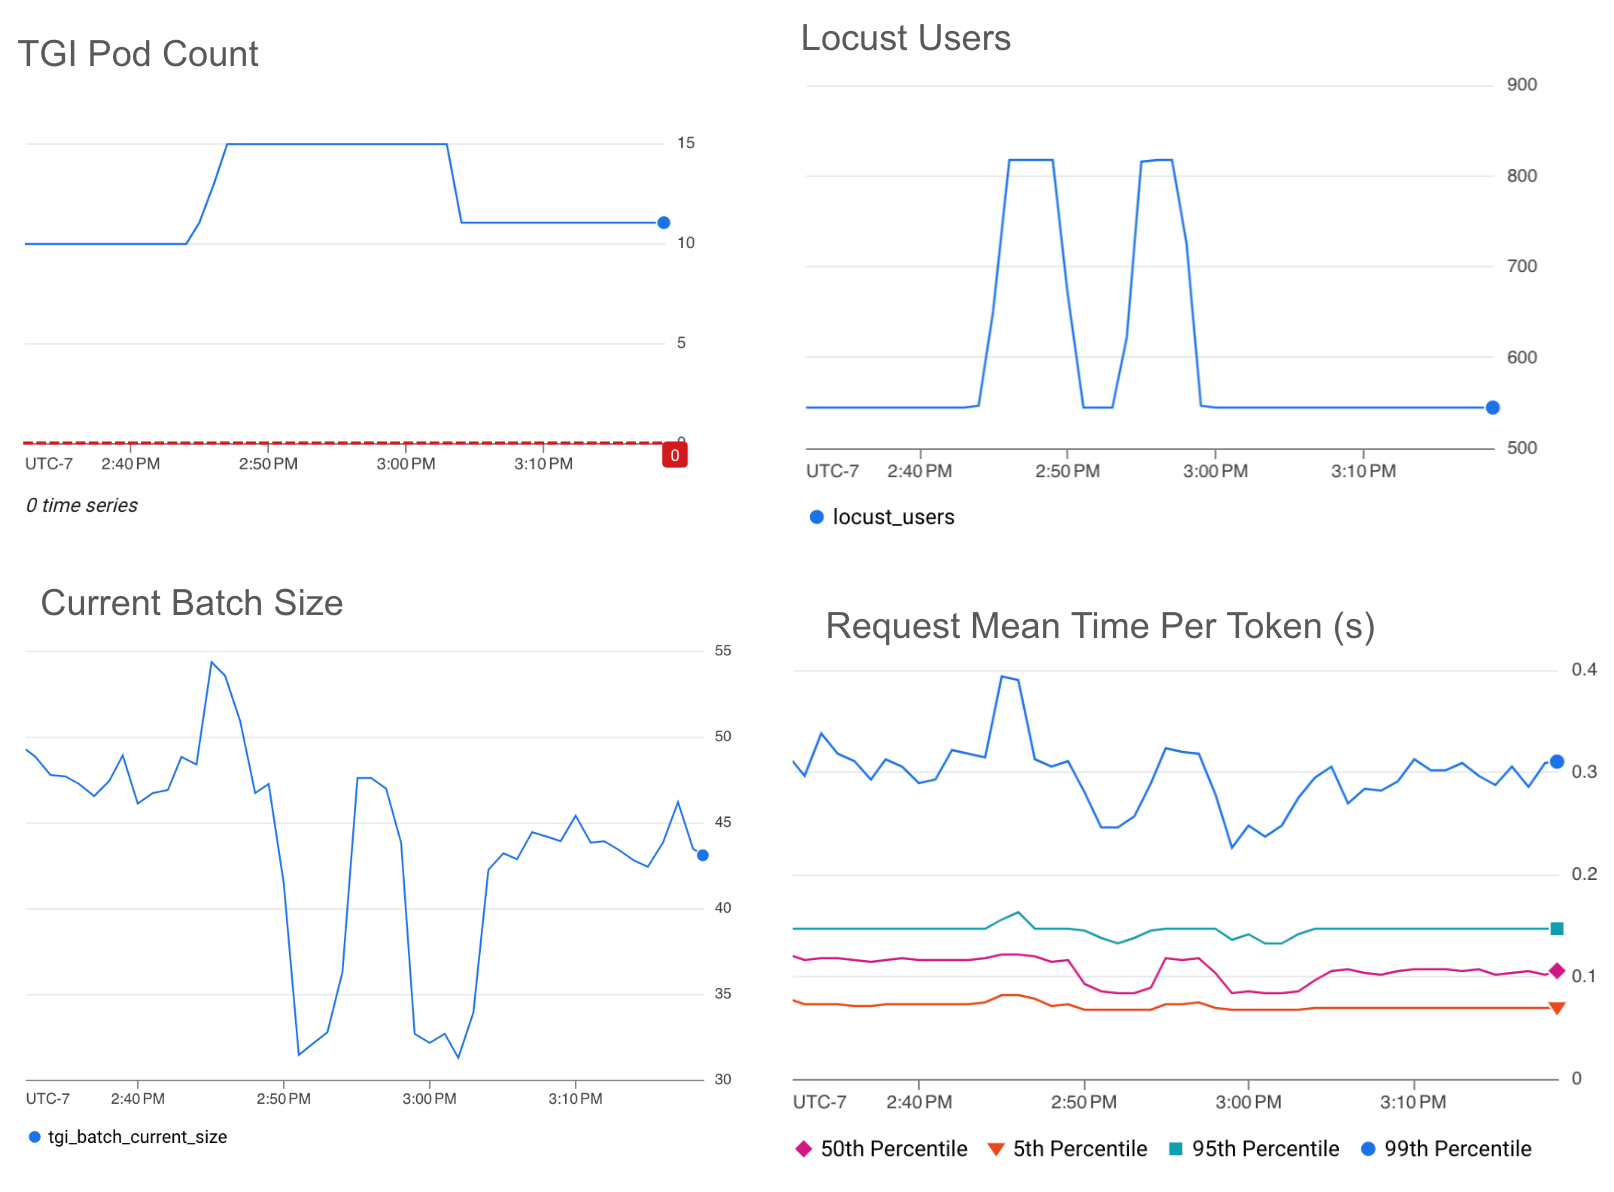
* Note that the ~60% drop in average batch size mirrors the ~60% drop of traffic.
We see that our target threshold is able to maintain a mean-time-per-token almost below ~0.3s even with the 150% traffic spikes.
The batch size threshold selected at ~80% of the max throughput maintains < ~80% of the mean-time-per-token compared to the queue size threshold selected at the max throughput.
Toward better autoscaling
Autoscaling with GPU utilization can cause you to overprovision LLM workloads, adding unnecessary cost to meeting your performance goals.
Autoscaling with LLM server metrics will enable you to achieve your latency or throughput goals while spending the minimal amount on accelerators. Batch size enables you to target a specific tail latency. Queue size enables you to optimize throughput.
For instructions on how to set up autoscaling for your own LLM inference server using these best practices, follow the steps outlined in Configure autoscaling for LLM workloads on GPUs with Google Kubernetes Engine.