Find your GKE cost optimization opportunities right in the console
Roman Arcea
Product Manager, GKE
Michał Jasiński
Senior Software Engineer
Try Google Cloud
Start building on Google Cloud with $300 in free credits and 20+ always free products.
Free trialIt doesn’t matter whether you have one Google Kubernetes Engine (GKE) cluster or a thousand, whether they’re all GKE standard clusters or autopilot, whether you’re the only person working on infrastructure, or are part of a larger team—knowing how to optimize your clusters for high performance and low cost is the key to success on GKE.
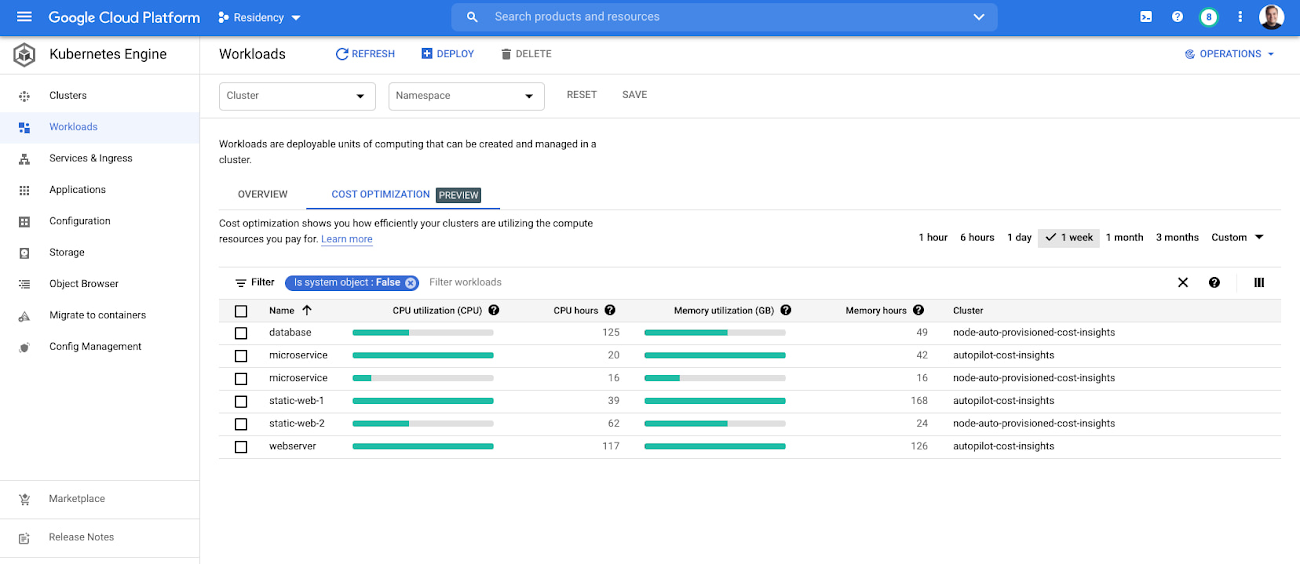
We’ve written extensively about GKE best practices to lessen over-provisioning, and published a guide on monitoring your GKE clusters for cost-optimization. Today, we’re introducing the preview of GKE cost optimization insights, which brings some of that wisdom directly into the GKE interface, helping you strike the right balance between cost and performance for your GKE clusters and workloads.
With this release, you’ll see firsthand how effectively your clusters and workloads use the compute resources that you pay for. A new cost optimization tab on both the GKE cluster and workload pages lets you view, filter, and learn more about the amount of CPU and memory that each of your clusters and workloads are using and requesting. On the cluster page, you can also see the total amount of allocatable resources, and on the workloads page, any resource limits you’ve set for specific compute resources. Data visualizations help you quickly identify any areas of slack between the amount of resources you’re allocating or requesting and the amount you’re actually using. With this information, you can rightsize your resource allocations or requests to control costs while maintaining performance.
Understanding resource utilization and GKE costs
Working closely with our users has taught us that there are four important things to consider when it comes to running GKE workloads efficiently: the cultural shift toward FinOps, proper bin packing, app right-sizing, and demand-based downscaling.
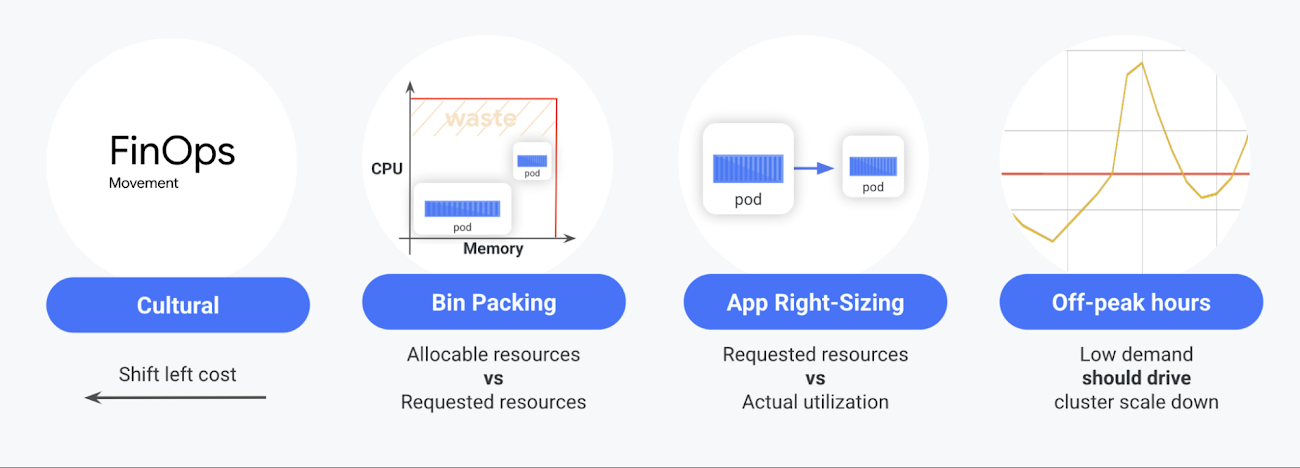
Cultural shift - Many teams that embrace the public cloud haven’t worked with a pay-as-you-go platform like GKE, so they’re unfamiliar with how resource allocation and app deployment processes can affect their costs. New GKE cost optimization insights can help teams evaluate the business trade-offs between cost and performance.
Bin packing - The ability to pack apps into GKE nodes. The more efficiently you pack apps into nodes, the more you save. You can pack apps into nodes efficiently by ensuring you’re allocating and requesting the right amount of resources based on your actual usage.
App right-sizing - The ability to configure the appropriate resource requests and workload autoscale targets for objects that are deployed in the cluster. The more precise you are in setting accurate resource amounts for your pods, the more reliably your apps will run and, in the majority of cases, the more space you will open in the cluster.
Demand-based downscaling - To save money during low-demand periods such as nighttime, your clusters should be able to scale down with demand. However, in some cases, you can’t downscale because there are workloads that cannot be evicted or because a cluster has been misconfigured
You can read more about these four considerations in the GKE best practices to lessen over provisioning.
Using GKE cost optimization insights
GKE cost optimization insights make it easier to address some or all of those considerations directly in the GKE console.
For example, with the cluster page view, you get a complete overview of your resource utilization, helping you visualize the relationship between your allocatable resources, your requested resources, and used resources, as well as the actual CPU and memory hours that you’ve used.
The used and requested CPU as well as memory metrics tell you which of your clusters could potentially benefit from app right-sizing. Comparing requested and allocatable resource amounts can help you identify opportunities for better bin-packing. You can also see how GKE autopilot clusters automate bin-packing for your clusters, freeing you and your team up to focus on app right-sizing. With that benefit in mind, adopting autopilot clusters is proving to be the single fastest way to cost-optimize clusters with inefficient bin-packing.
Being able to see total CPU and memory hours for each cluster also helps you better understand any bin-packing or right-sizing problems you might have, while the ability to filter data by specific time periods can help you focus on specific use cases or visualize information within different time horizons.
GKE cost-optimization insights are available not just for your clusters, but for your workloads as well. Seeing your used and requested resource amounts for each of your individual workloads can help you identify and fix any workloads that are requesting or using resources inefficiently. As is the case for the cluster-level view, the workload-level view also aggregates CPU and memory usage to give you a clear understanding of your busiest workloads.
Requirements and supported metrics
Under the hood, GKE cost optimization insights use Cloud Monitoring system metrics. Hence, if your clusters have system metrics collection enabled, you will see results out of the box.
At the same time, while terms such as CPU and memory metrics are generally well understood, it’s important to understand all the metrics that GKE cost optimization insights uses.
The following table lists the kubernetes metrics used to calculate insight’s metrics aggregations.
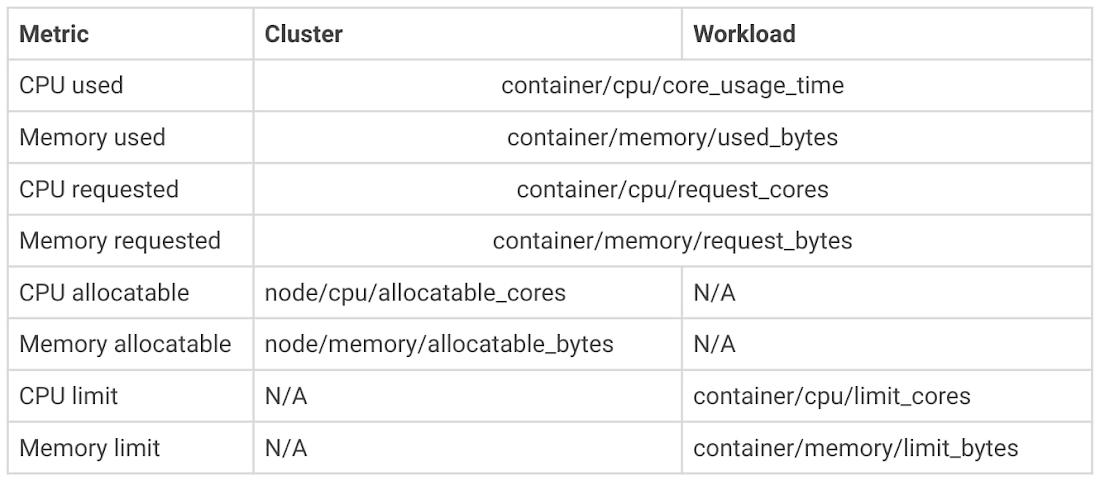
If you need to do a quick analysis of absolute values, you can enable the optional columns that show all numbers behind the charts.
Finally, the time picker available in GKE’s UI allows you to pick the time horizon for your calculations. Utilization metrics will be averaged over the specified time period, while total core and memory hours will be added up. Learn more about the cost optimization metrics here.
Bringing it all together
While it’s easy to see how these insights can help you discover bin-packing and app-right sizing opportunities, they can also help you with another challenge: establishing a cost-saving culture. Once you have visibility into your GKE resources, your team has access to this important information from right within the product, without having to build a solution yourself. Insights can also help you better understand GKE’s pay-as-you-go model and how unused resources can impact your infrastructure costs.
Check your GKE console today for the new cost optimization insights. Ready to turn them into action? Learn more about best practices for running cost-optimized Kubernetes applications on GKE!