Anthos Service Mesh: Working with external services - Metrics and Traces
Giovanni Galloro
EMEA Solutions Lead, Application Modernization
Recently I had to advise a customer on how to use Anthos Service Mesh (ASM) to manage communication and integration between services inside and outside a mesh.
The goals they had were:
Getting traces and metrics for the traffic from the mesh to external services
Redeploying the legacy services in the cloud GKE cluster
Progressively migrating traffic to the GKE services
In this article I will show you how to get metrics and traces for the traffic flowing from the mesh to external services. This tutorial uses example services inside the cluster and as a representation of external services, but the same concepts and configurations apply to a real application environment.
Requirements
To perform the activities in this article you need access to a GCP project and the permissions to create a GKE cluster with ASM enabled.
Since many of the configurations described are based on Istio APIs, these instructions are applicable, with minor changes in some cases, also to an Istio open source installation or other commercial implementations, the part related to observing traffic metrics and traces is built with Cloud Monitoring and Cloud Trace on GCP.
Create a GKE cluster on GCP and enable Anthos Service Mesh
Create a GKE cluster with ASM enabled: a simple walkthrough to do that is provided in the Quickstart for GKE UI page of the ASM documentation. After you create the cluster, get the credentials to connect to it using kubectl as described in this documentation page.
After you have the cluster with ASM enabled you should enable Cloud Trace integration since it’s not enabled by default in ASM.
To enable Cloud Trace you need to modify the mesh configuration, you can do that with the following command if you followed the Quickstart for GKE UI above to create the cluster:
Deploy your sample application
We will now deploy a sample application, called sleep, that is part of the samples included with the Istio release, we will use it as the traffic source to external services.
Create a namespace to which you will deploy your application, let’s call it meshed:
In order to automatically inject sidecar proxies when pods are created in a namespace, you need to label it with your release channel value for the label istio.io/rev, in our case the release is asm-managed:
You can ignore the message "istio-injection not found" in the output. That means that the namespace didn't previously have the istio-injection label, which you should expect in new installations of ASM or new deployments.
Download and extract the Istio release containing the sample application we will use:
You will get a message similar to the following:
Move inside the folder created by the Istio download, for example:
Deploy the sample sleep application to your namespace:
Check that the pod has been created, and that it has 2 containers (the application container + the ASM Envoy proxy):
If your cluster is a newly created autopilot cluster it could take a couple of minutes for pods to start, when your pods are started you should get an output similar to this:
Manage access to external services
In ASM (and Istio) you can manage access to external services using the ServiceEntry resource, this resource lets you add entries for these services into Istio’s internal service registry so that traffic to them can be directed and observed as if they were part of the mesh.
Let’s create a ServiceEntry for the the public endpoint httpbin.org, we will use it as an example of an external service:
Getting traffic metrics for external services
To see examples metrics and traces for traffic going outside the mesh, first set the SOURCE_POD environment variable to the name of your source pod:
Then connect to the sleep pod console:
And generate some traffic from the sample sleep application to httpbin.org:
You will see the httpbin.org/ip page responding with the source IP it sees in the request, this should be the public IP of one of our GKE cluster nodes.
After a few minutes let’s go to check if we have some metrics:
In the GCP Console go to Monitoring and select Metrics Explorer in the menu on the left side.
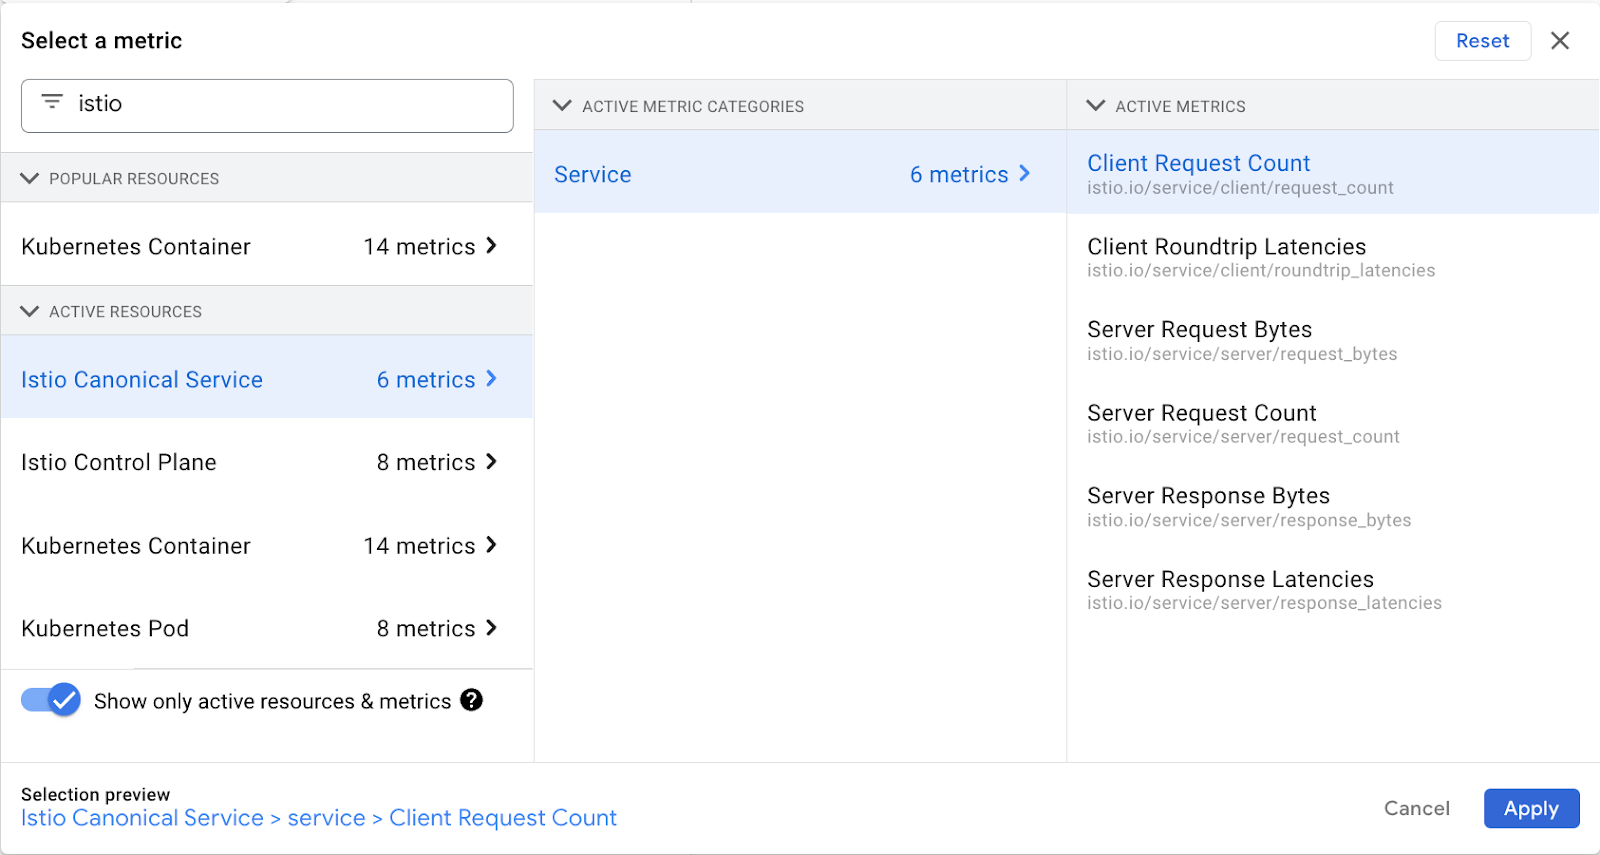
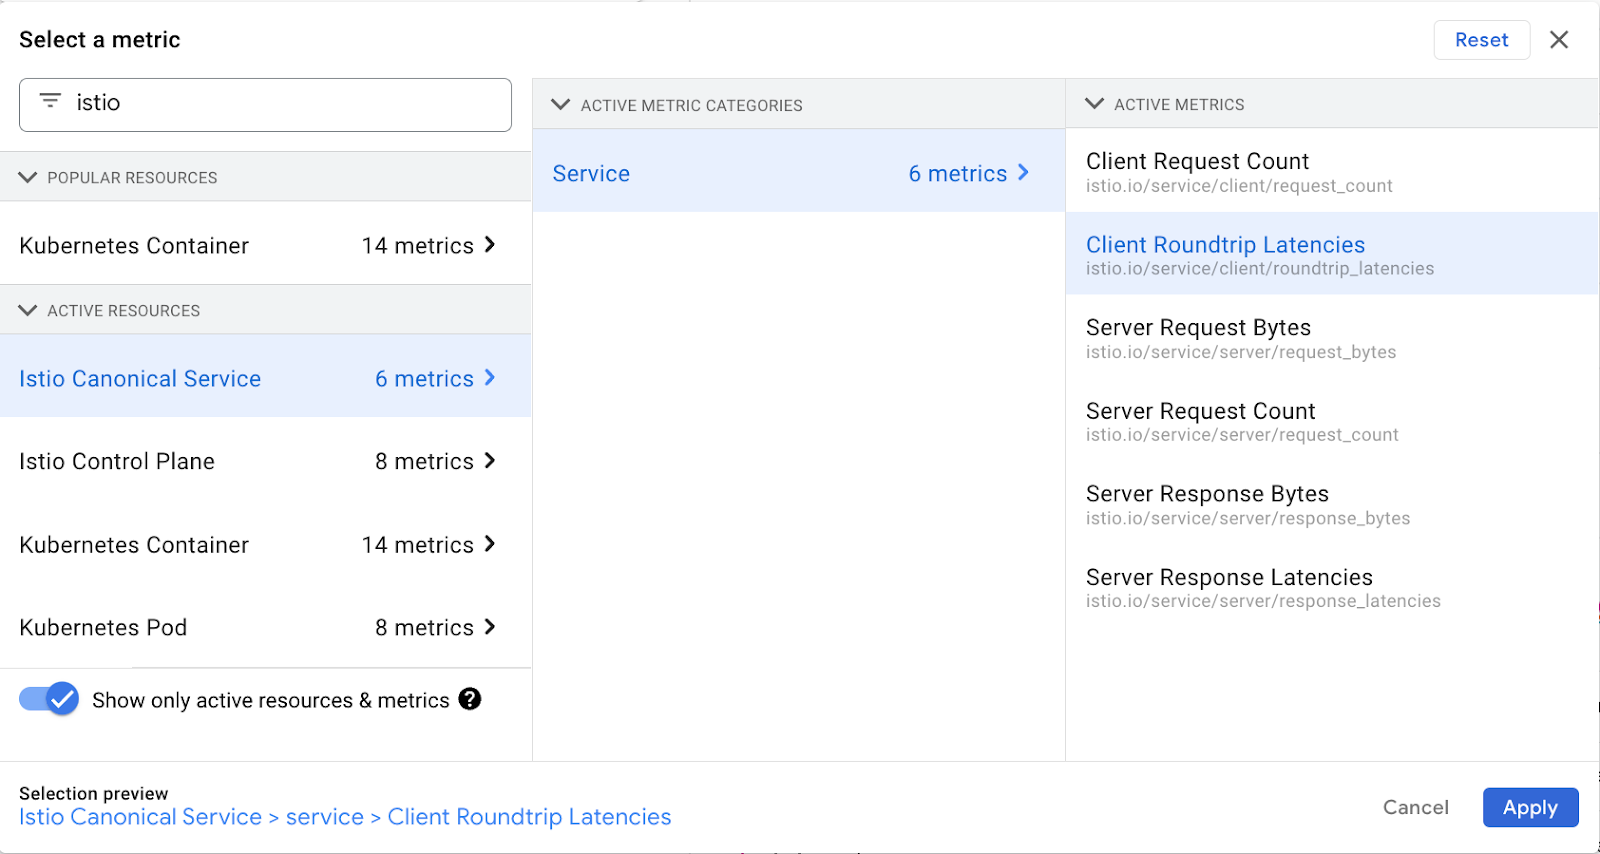
In Metrics explorer click on SELECT A METRIC under “Resource & Metrics” and then write “istio” in the search box
From the results select “Istio Canonical Service” > “Service” > “Client Request Count” as shown below, then click Apply.
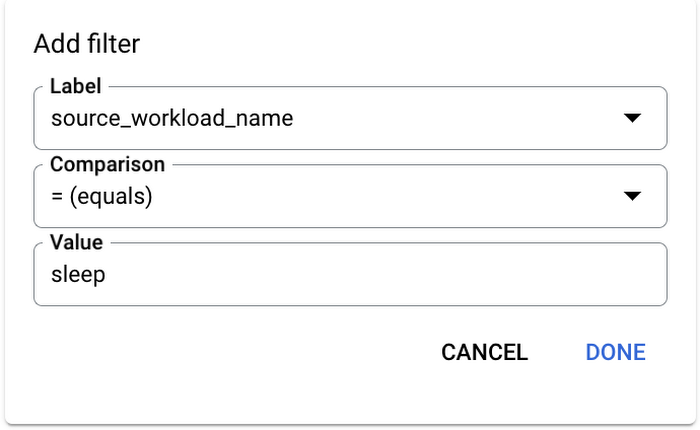
Click on ADD FILTER and create a filter with source_workload_name = sleep as shown below:
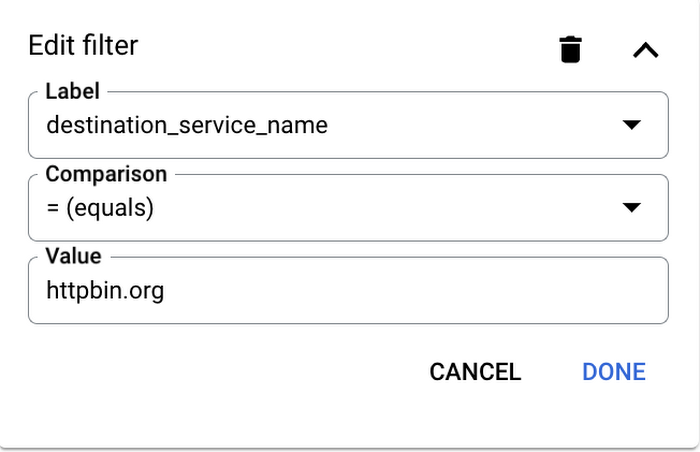
Click again on ADD FILTER and create a filter with destination_service_name = httpbin.org as shown below:
In the “Group by” menu of the “How do you want to view data?” section you can pick the label you want to group data on: in a production environment you could pick meaningful labels as destination_service_name, if your services are connecting to multiple external services, or response_code to measure the error rate, in our case we can leave the default configuration since we should have only connections from sleep to httpbin.org.
You now have a chart showing requests per second going to httpbin.org, you were able to select httpbin.org as a destination service name because you have the ServiceEntry resource for it.
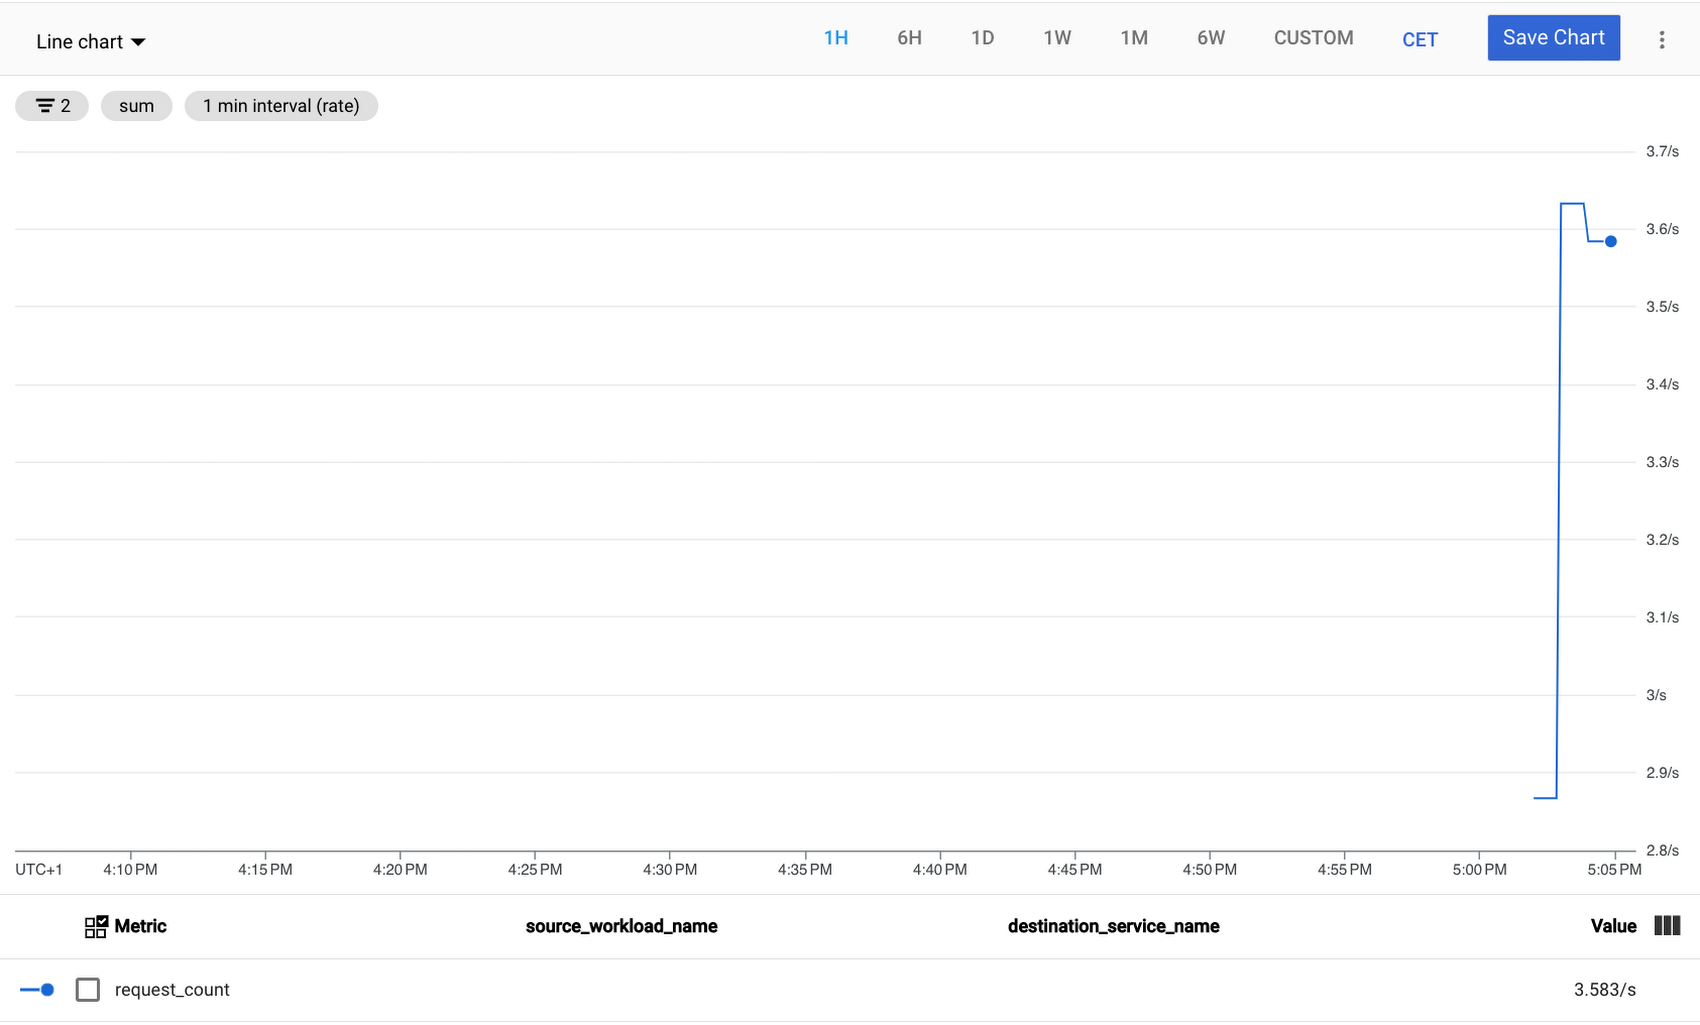
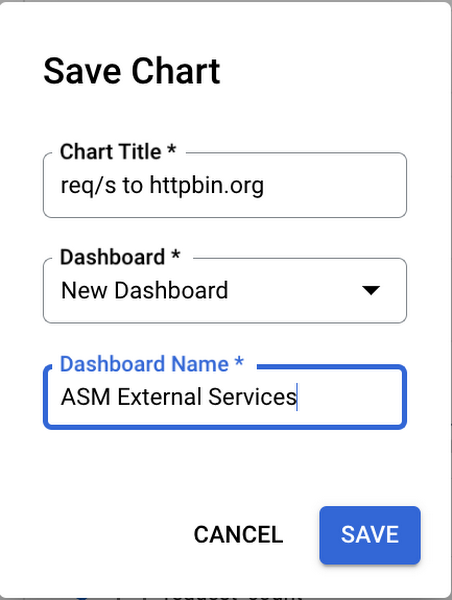
Click on Save Chart in the high right corner, name your chart “req/s to httpbin.org”, and save it to a new dashboard called “ASM External Services”.
Now let’s do the same to build a chart for latency metrics:
Under “Resource & Metrics” click on the button that now is named ISTIO CANONICAL SERVICE - CLIENT REQUEST COUNT
Select “Istio Canonical Service” > “Service” > “Client Roundtrip Latencies” this time, as shown below, then click Apply.
Create the same 2 filters you did for the previous chart: source_workload_name = sleep and destination_service_name = httpbin.org
You now have a chart showing roundtrip latencies for requests to httpbin.org.
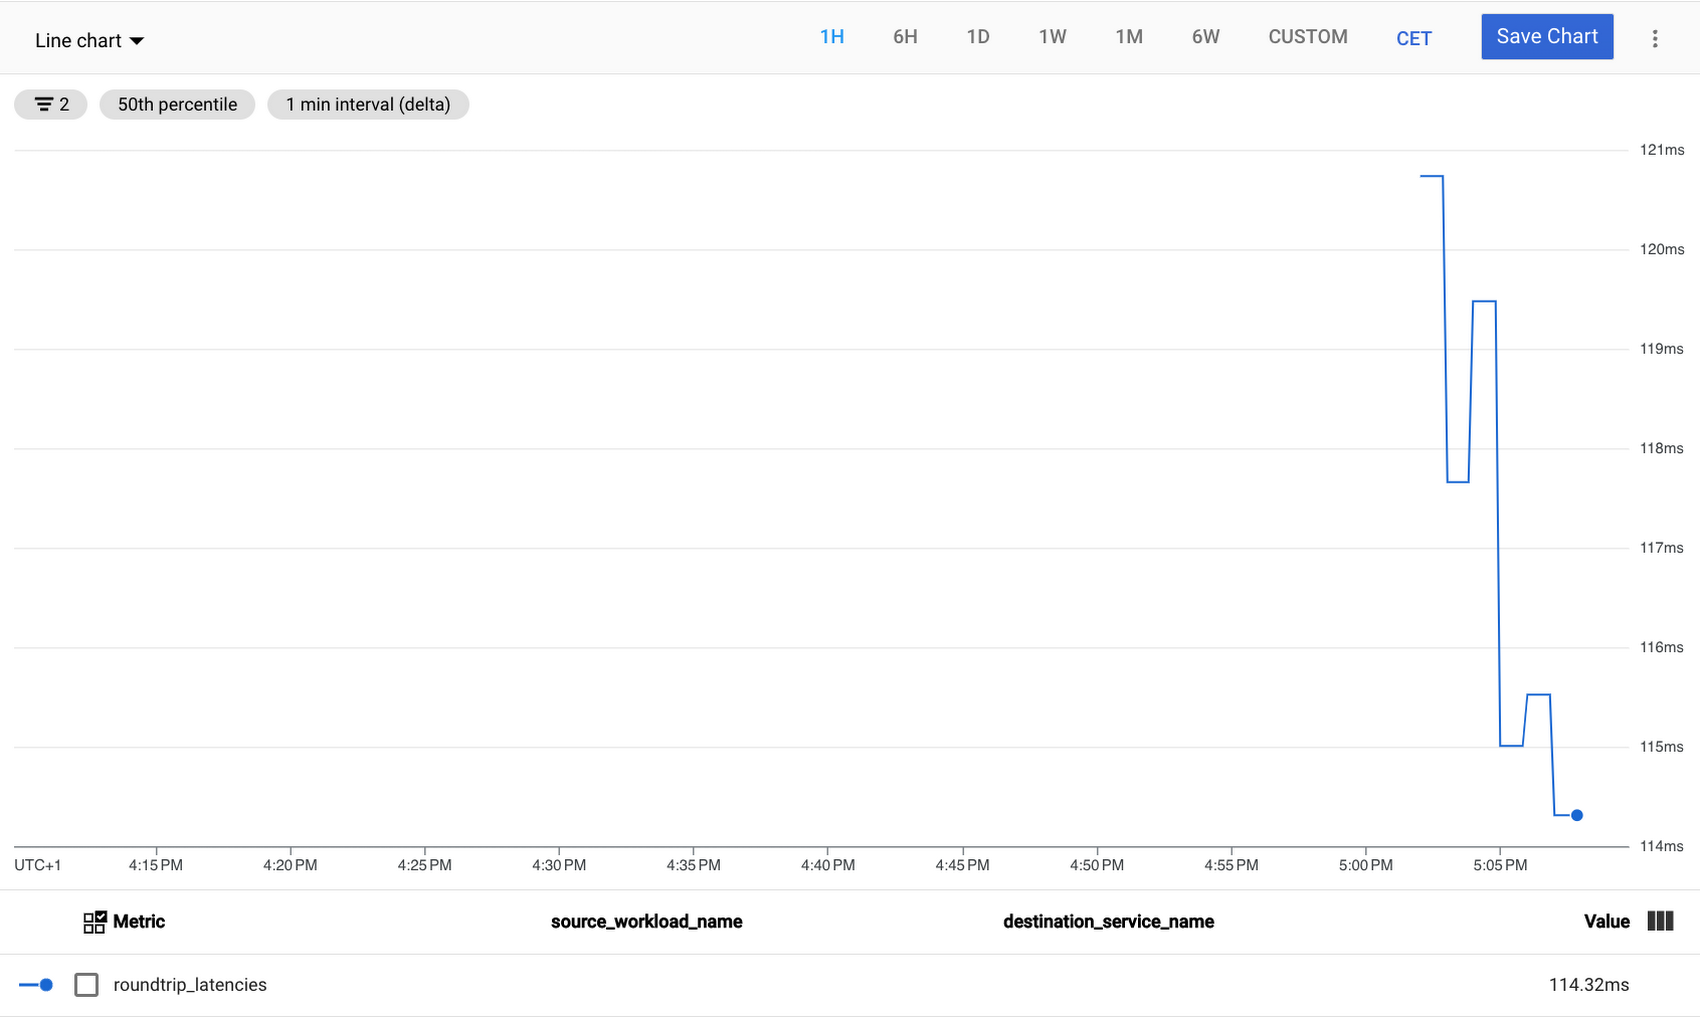
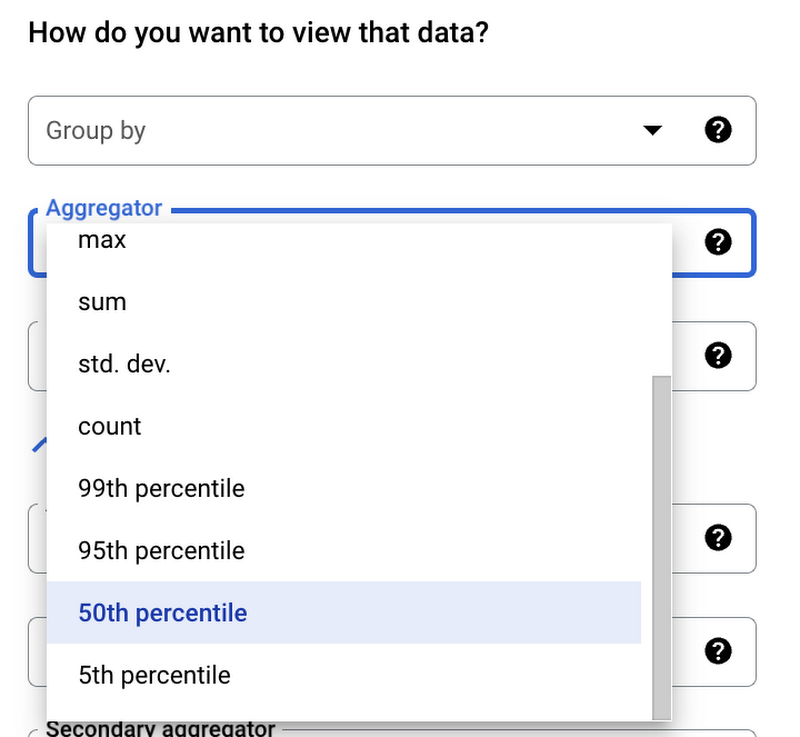
The chart uses the 50th percentile as the default aggregator, you can change that in the “How do you want to view data?” section or add another metric with a different percentile.
Click on Save Chart in the high right corner, name your chart “Latency to httpbin.org”, and save it to the “ASM External Services” dashboard.
To view the dashboard that contains the charts you just created, click on VIEW DASHBOARD in the popup box that appeared or go to Dashboards in the left menu and select “ASM External Services” in the dashboards list: you should see a dashboard showing requests per second and 50th percentile latencies to httpbin.org, like the one below:
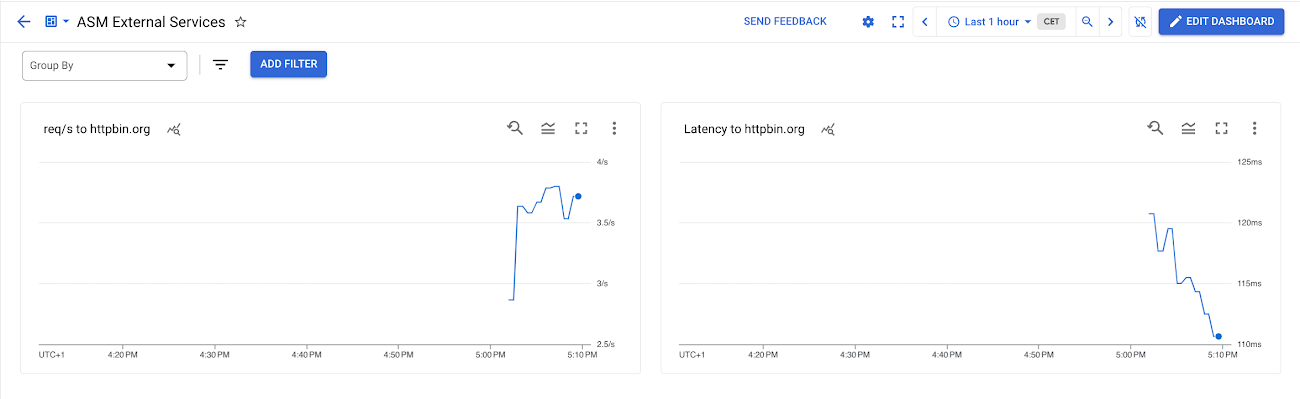
You can enable charts auto refresh and change the time interval in the upper right corner.
Getting traces for external services access
Now let’s see some traces for our requests to httpbin.org:
In the GCP Console go to Trace > Trace List
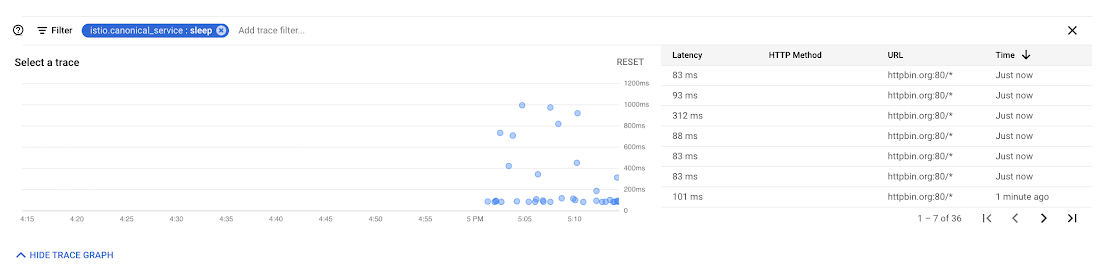
In the filter space type: istio.canonical_service: sleep
You should see a list of traces for requests to httpbin.org:80/*
Select the most recent one, you can see the roundtrip latency and other information related to the request.
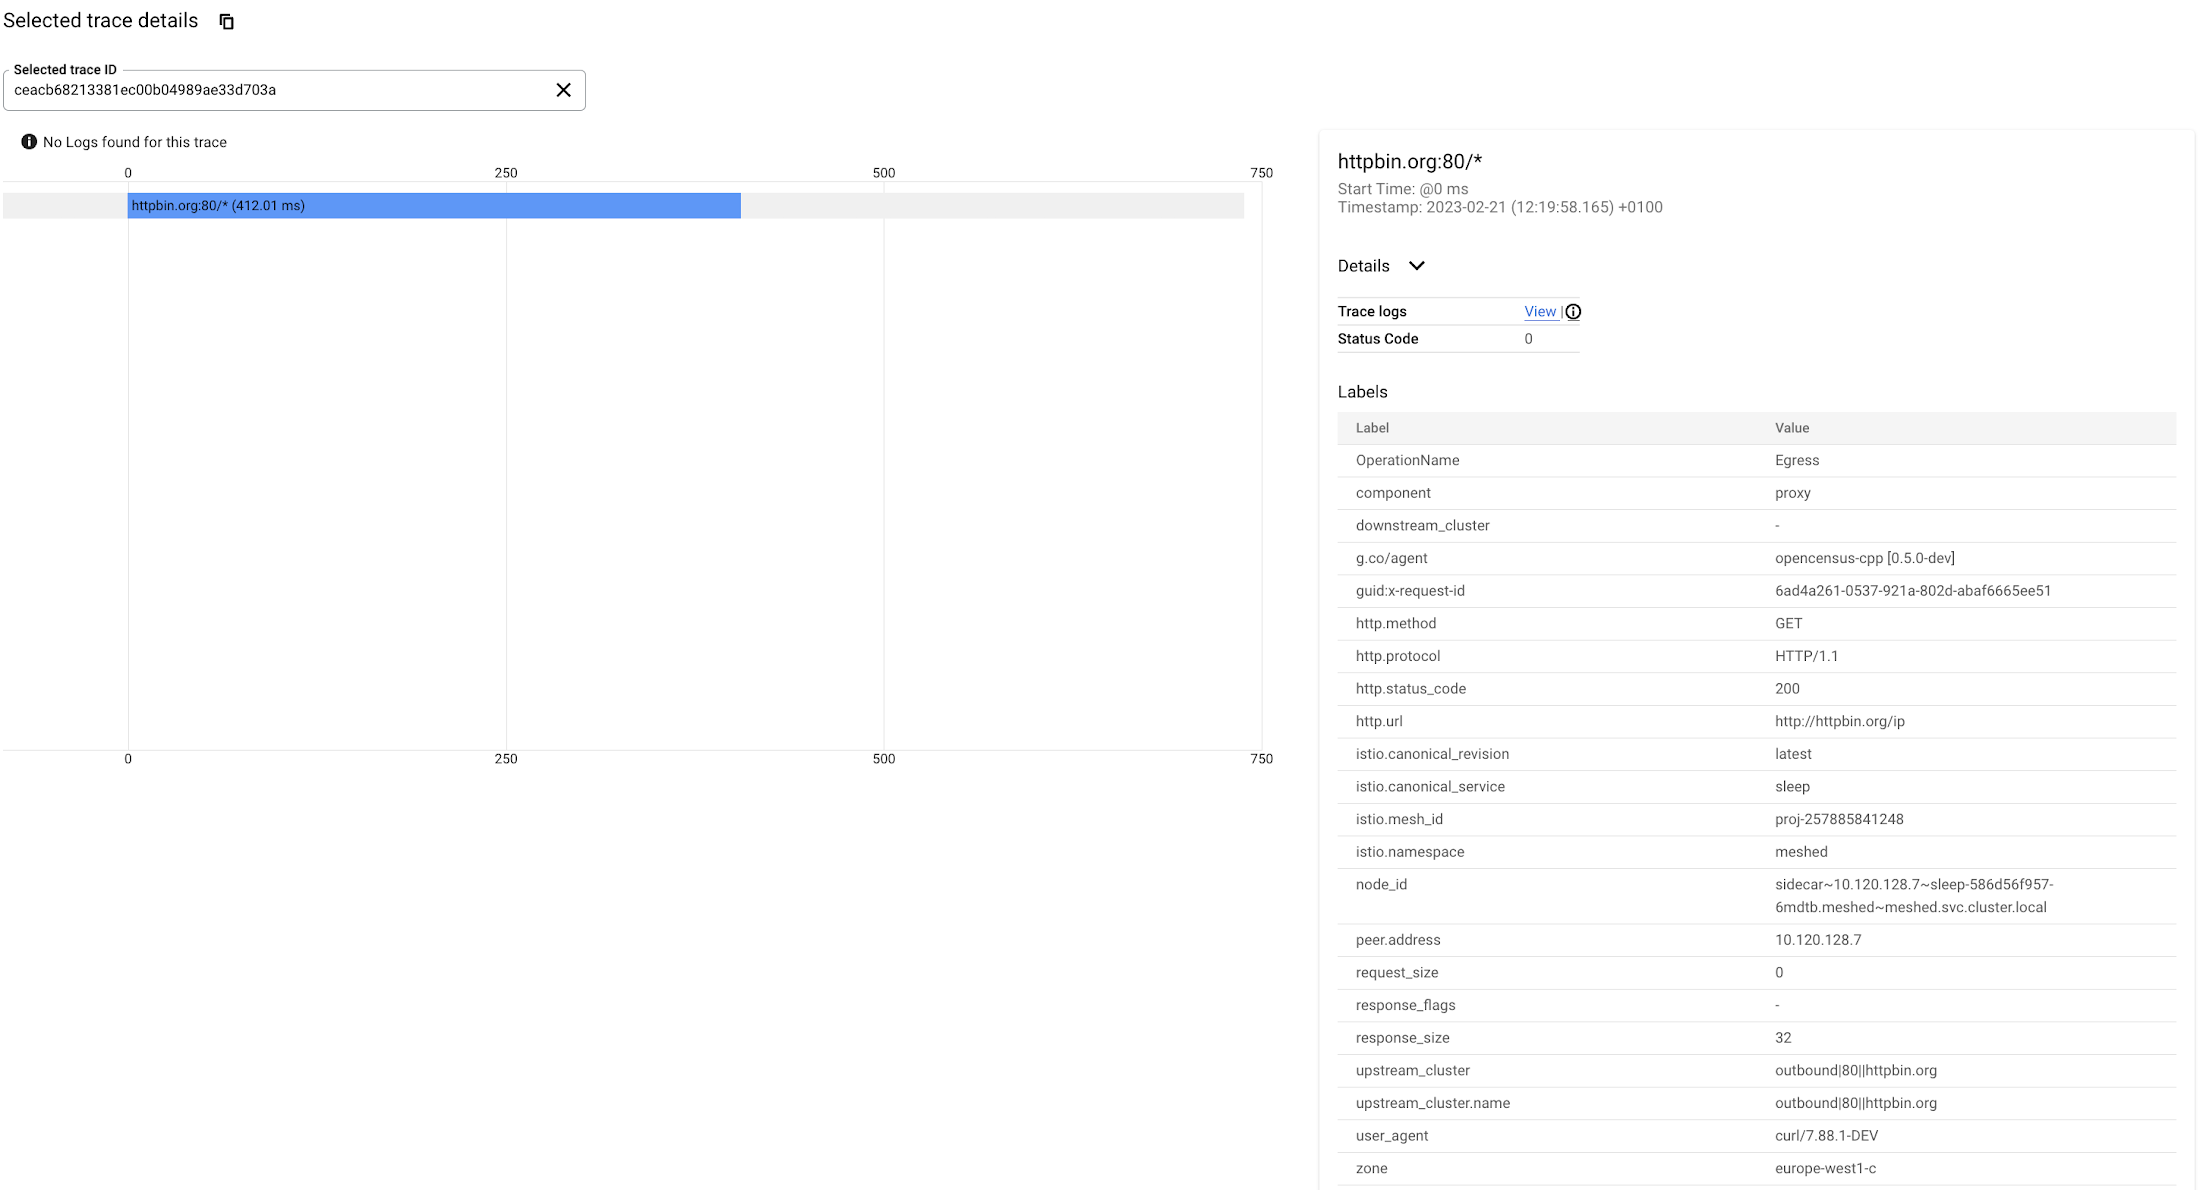
This is a very simple request originating from the sleep service and going directly to httpbin.org, with Cloud Trace you can also track more complex requests getting inside your mesh from an external end-user, involving more than a single microservice in the mesh, and finally hitting an external back-end service.
Getting metrics and traces for HTTPS connections to external services
The above configuration works for HTTP connections, if your service makes HTTPS connections to external services traces will not be visible and destination services will not appear in Cloud Monitoring metrics. This happens because, since the request is encrypted from the source application to the external service, the ASM proxy cannot access the HTTP payload.
A way to overcome this issue is to originate TLS from the proxy and not from the source service: with this approach ASM will open HTTPS connections to the external service while the original traffic is HTTP, so the proxy will have access to the data contained in the request.
In order to do that you need to:
1. Refine your ServiceEntry from the previous section to redirect HTTP requests to port 443
2. Create a DestinationRule to perform TLS origination for HTTP requests on port 80:
The connections from you originating pods should still be made in HTTP, so you will keep traces and metrics visibility:
but given the above ServiceEntry and DestinationRule, the ASM proxy will connect to httpbin.org using HTTPS.
Conclusions
Reading and following the instructions in this article you learned how to:
Enable Cloud Trace in ASM.
Use the Istio ServiceEntry resource to register external services in your ASM internal registry.
Create charts in Cloud Monitoring to observe traffic and latency metrics for communication from your mesh to outside services.
Use Cloud Trace to track requests from your mesh to outside services.
Configure egress TLS origination from ASM
You can learn more about Anthos Service Mesh in the following tutorials:
Keep an eye out for a follow-up article, where you will learn how to split traffic between services running inside the mesh and services running outside and progressively migrate your production traffic to ASM.