新しい Google Cloud Trace エクスプローラのご紹介
Sujay Solomon
Product Manager
Punya Biswal
Engineering Manager
※この投稿は米国時間 2025 年 2 月 25 日に、Google Cloud blog に投稿されたものの抄訳です。
分散トレースは、オブザーバビリティ スタックの重要な部分であり、アプリケーションのレイテンシやエラーをトラブルシューティングできます。Google Cloud Observability の一部である Cloud Trace は、Google Cloud のネイティブ トレーシング プロダクトです。新しい分析バックエンドに加えて、Trace エクスプローラの UI に多くの改善を加えました。
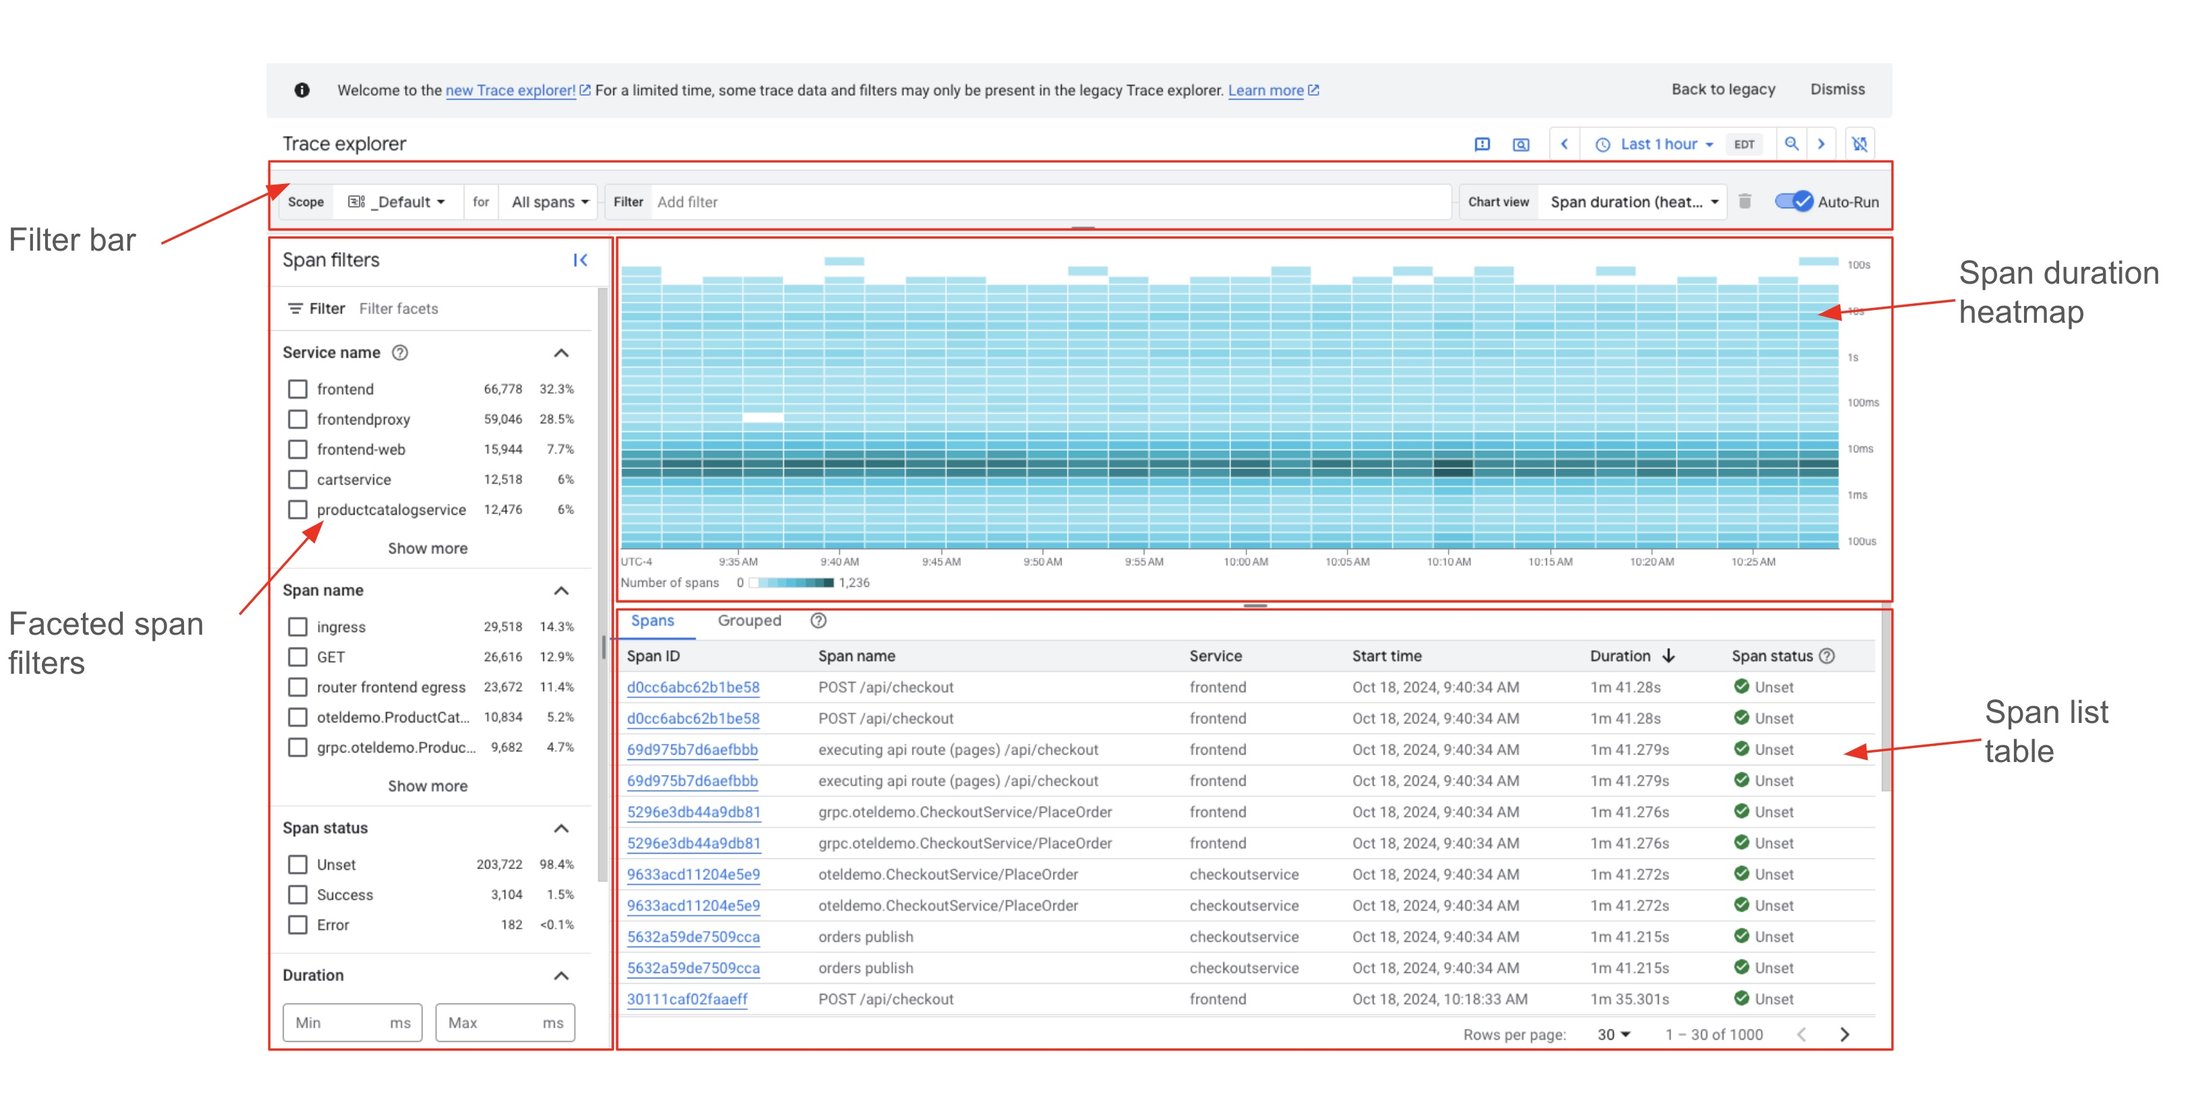
新しい Trace エクスプローラ ページには、次の情報が表示されます。
-
Google Cloud プロジェクト ベースのトレース スコープ、すべてのスパン / ルートスパン、カスタム属性フィルタを選択できるオプションがあるフィルタバー。
-
OpenTelemetry の規則に基づいてよく使用されるフィルタを表示する、ファセット スパン フィルタ ペイン。
-
一致するスパンの可視化。インタラクティブなスパン期間ヒートマップ(デフォルト)、スパンレートの折れ線グラフ、スパン期間のパーセンタイル グラフなどがあります。
-
一致するスパンの一覧。ヒートマップで対象のセルを選択することでさらに絞り込むことができます。
新しい Trace エクスプローラの概要
では、これらの新機能と、アプリケーションのトラブルシューティングに役立つ使い方を詳しく見ていきましょう。あなたが、小売ウェブストア アプリケーションの checkoutservice に携わっている開発者だとしましょう。進行中のインシデントがあるため、呼び出しを受けました。
このアプリケーションは OpenTelemetry を使用して計測され、トレースデータを Google Cloud Trace に送信します。そのため、Google Cloud コンソールの Trace エクスプローラ ページに移動し、コンテキストを checkoutservice をホストする Google Cloud プロジェクトに設定します。
調査を開始する前に、管理者から、ウェブショップ アプリ全体の本番環境の問題を調査するときは webstore-prod トレース スコープを使用するように勧められていたことを思い出しました。このトレース スコープを使用すると、調査に関連する他の Google Cloud プロジェクトに保存されているスパンを確認できます。
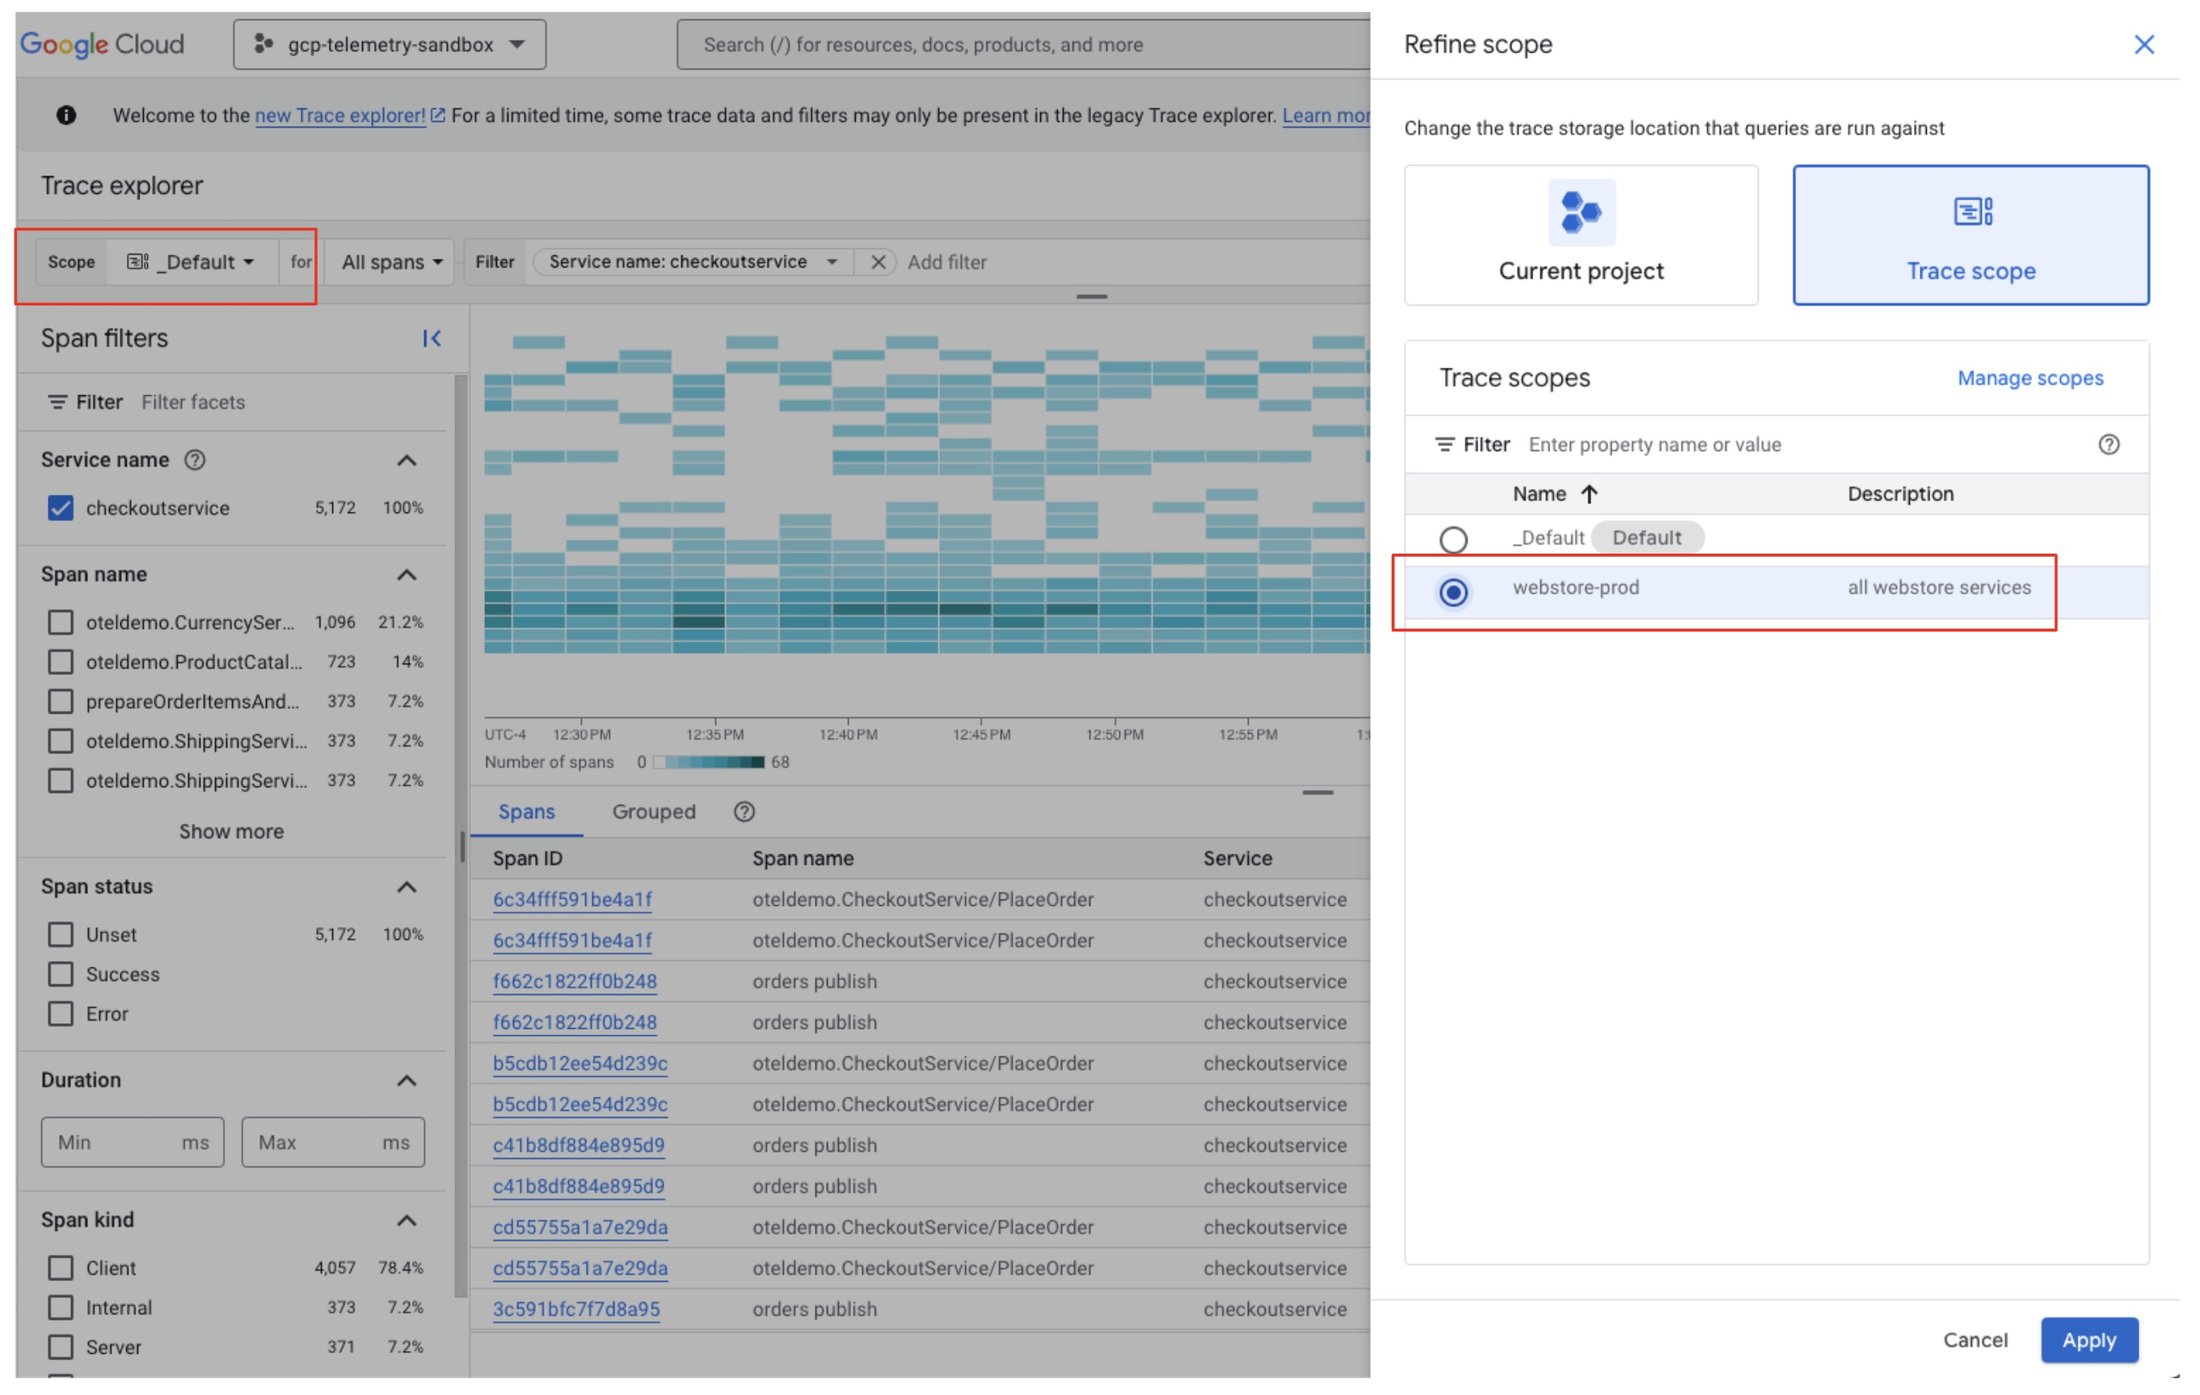
トレース スコープを webstore-prod に設定すると、このトレース スコープに含まれるすべてのプロジェクトのスパンがクエリに含まれるようになります。
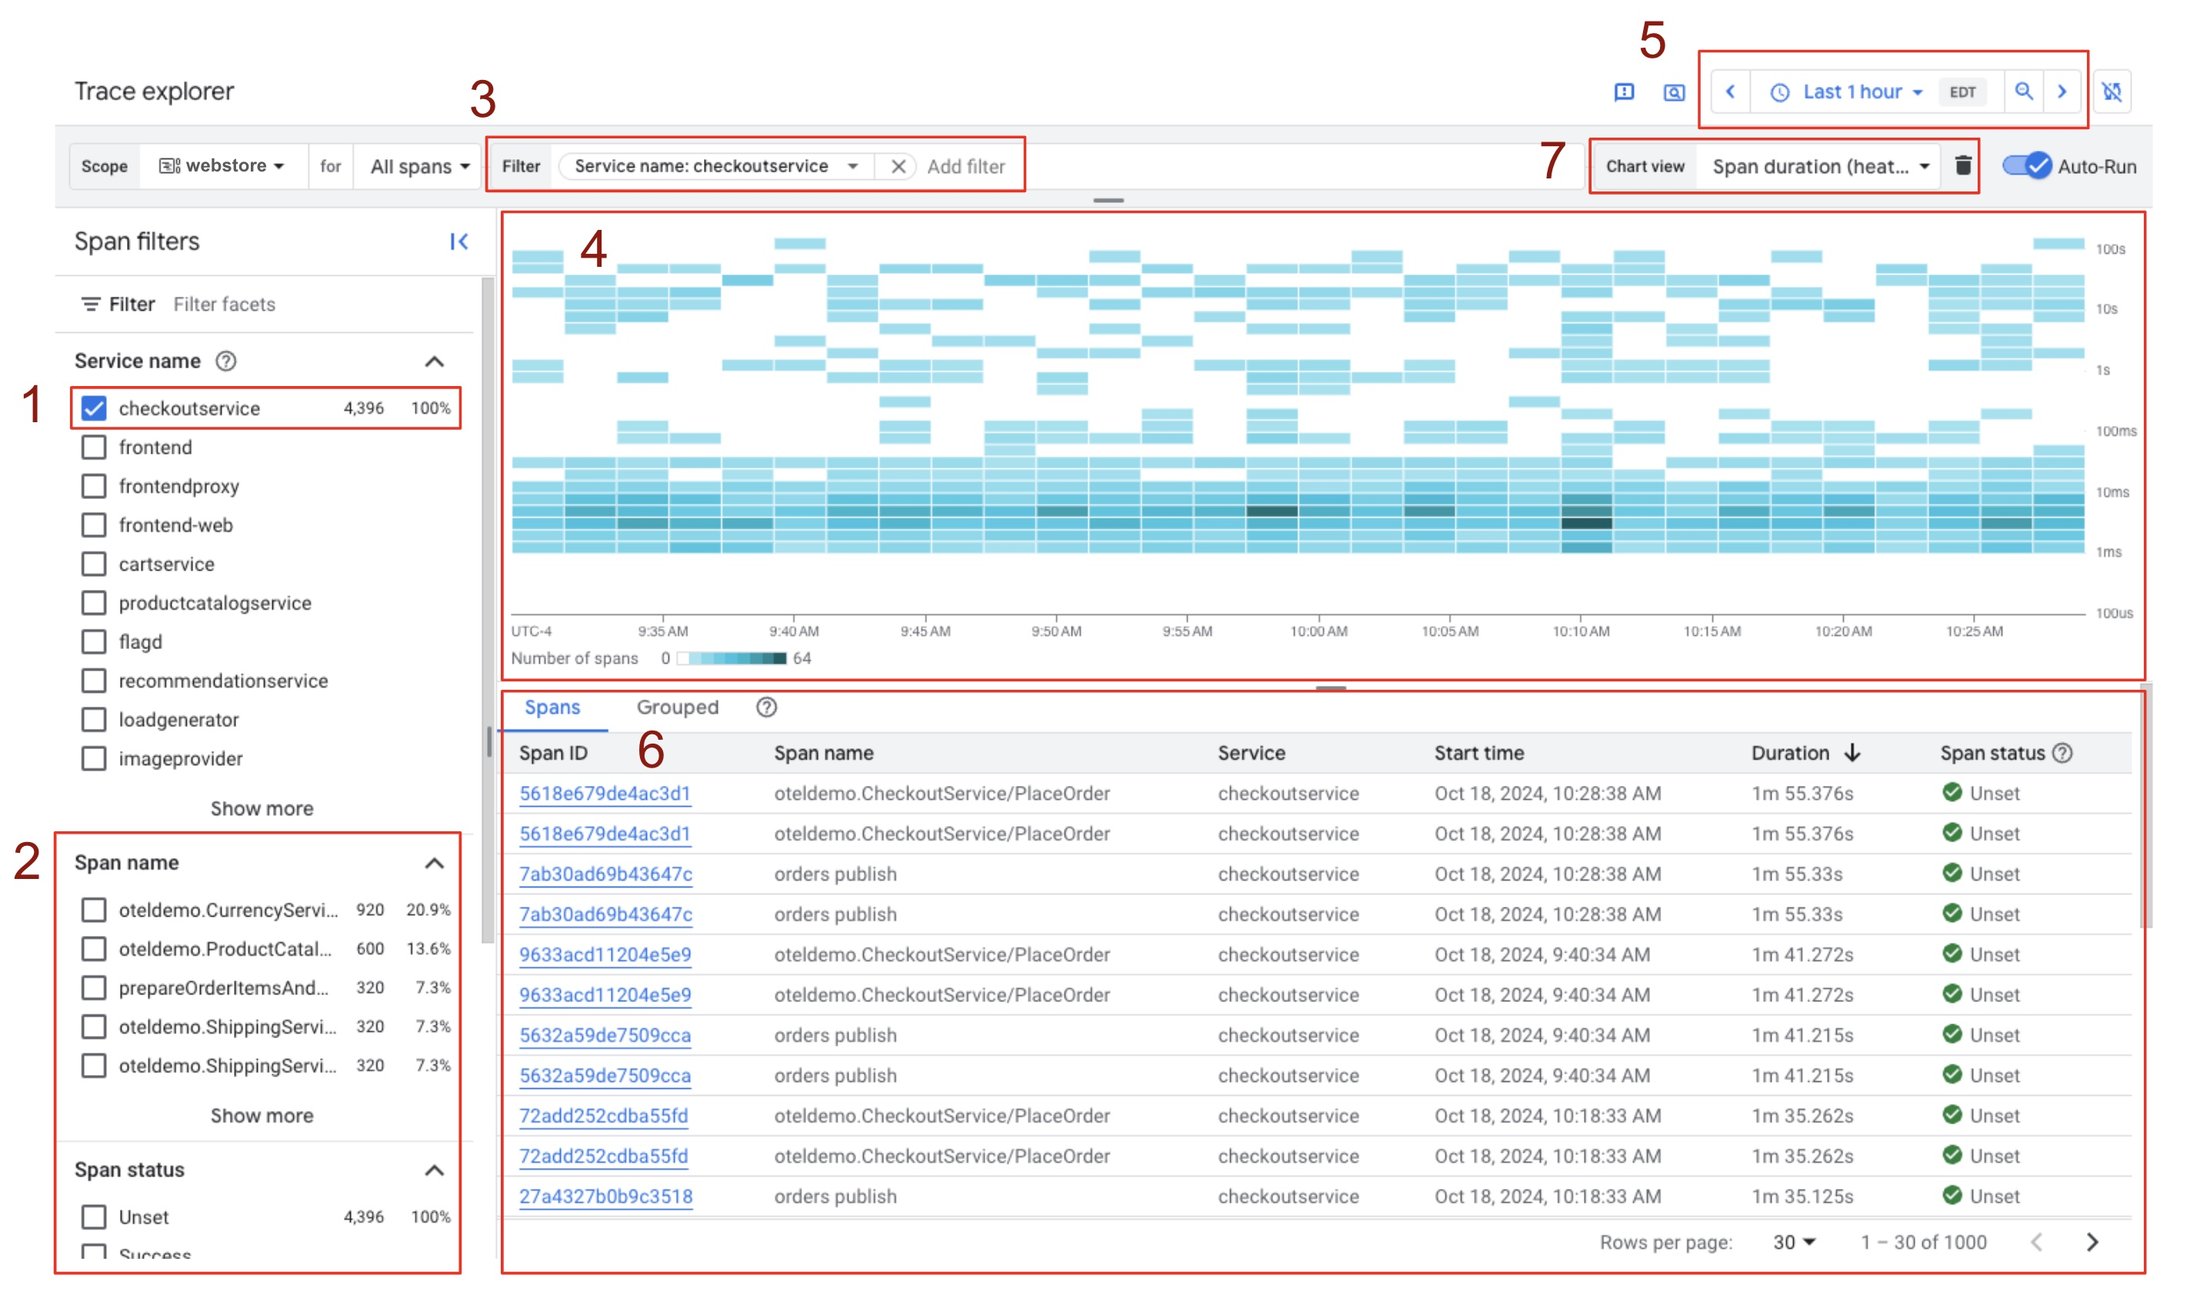
[スパンフィルタ] で checkoutservice(1)を選択すると、ページに次の更新が読み込まれます。
-
[スパンフィルタ] ペインの [スパン名] (2)などの他のセクションは、サービス名で行った選択を考慮した数と割合で更新されます。これにより、検索条件を絞り込んでより具体的にすることができます。
-
スパンフィルタ バー(3)が更新され、アクティブなフィルタが表示されます。
-
ヒートマップ可視化(4)が更新され、直近 1 時間の checkoutservice からのスパンのみが表示されます(デフォルト)。期間は、期間選択ツール(5)を使用して変更できます。ヒートマップの X 軸は時間、Y 軸はスパン期間です。色の濃淡で各セルのスパンの数が表示され、対応する範囲を示す凡例も示されます。
-
[スパン] テーブル(6)が更新され、一致するスパンが期間で並べ替えられます(デフォルト)。
-
切り替え可能な他の [グラフビュー](7)も、適用されたフィルタで更新されます。
ヒートマップを見れば、100 を超える範囲のスパンがいくつかあることがわかります。これは異常で、問題があります。しかし、まず、checkoutservice によって処理される呼び出しのトラフィックと対応するレイテンシについて調べることにしました。
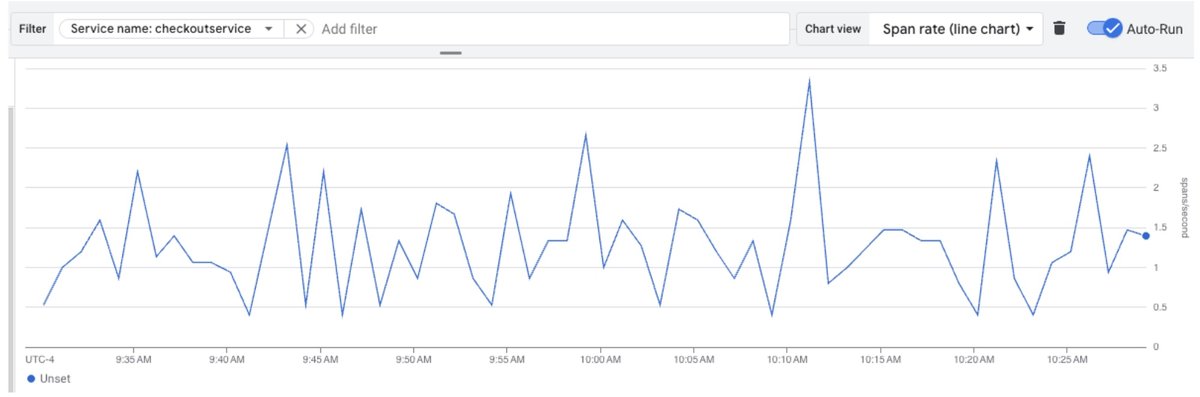
スパンレートの折れ線グラフに切り替えると、サービスで処理されるトラフィックを確認できます。X 軸は時間、Y 軸は 1 秒あたりのスパン数です。過去の経験から、1.5~2 スパン/秒がごく普通であることがわかっているため、サービスで処理されるトラフィックは正常に見えます。
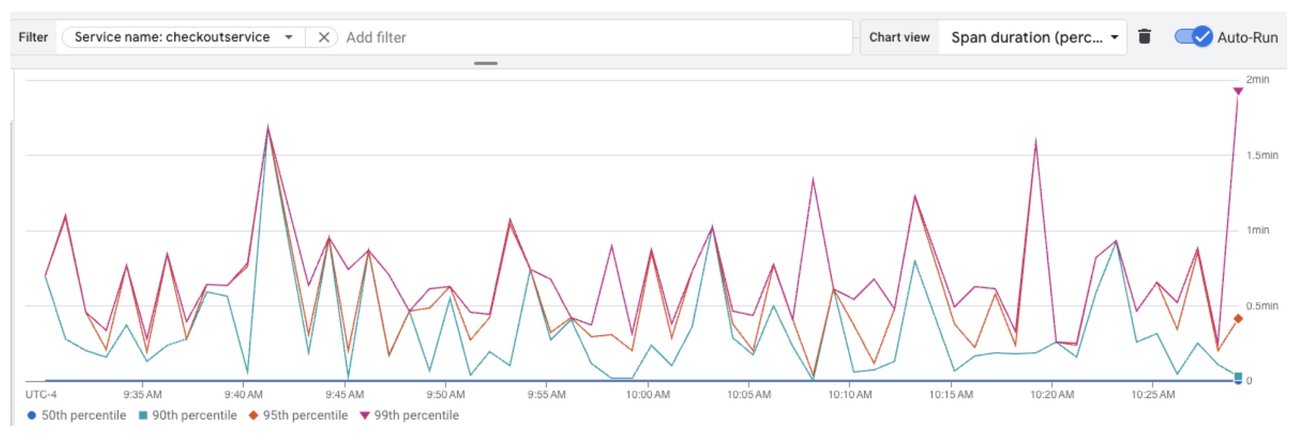
スパン期間パーセンタイル グラフに切り替えると、50 / 90 / 95 / 99 パーセンタイルのスパン期間の傾向が表示されます。50 パーセンタイルは問題ないように見えますが、90 パーセンタイル台の期間がサービスに対する想定よりも長くなっています。
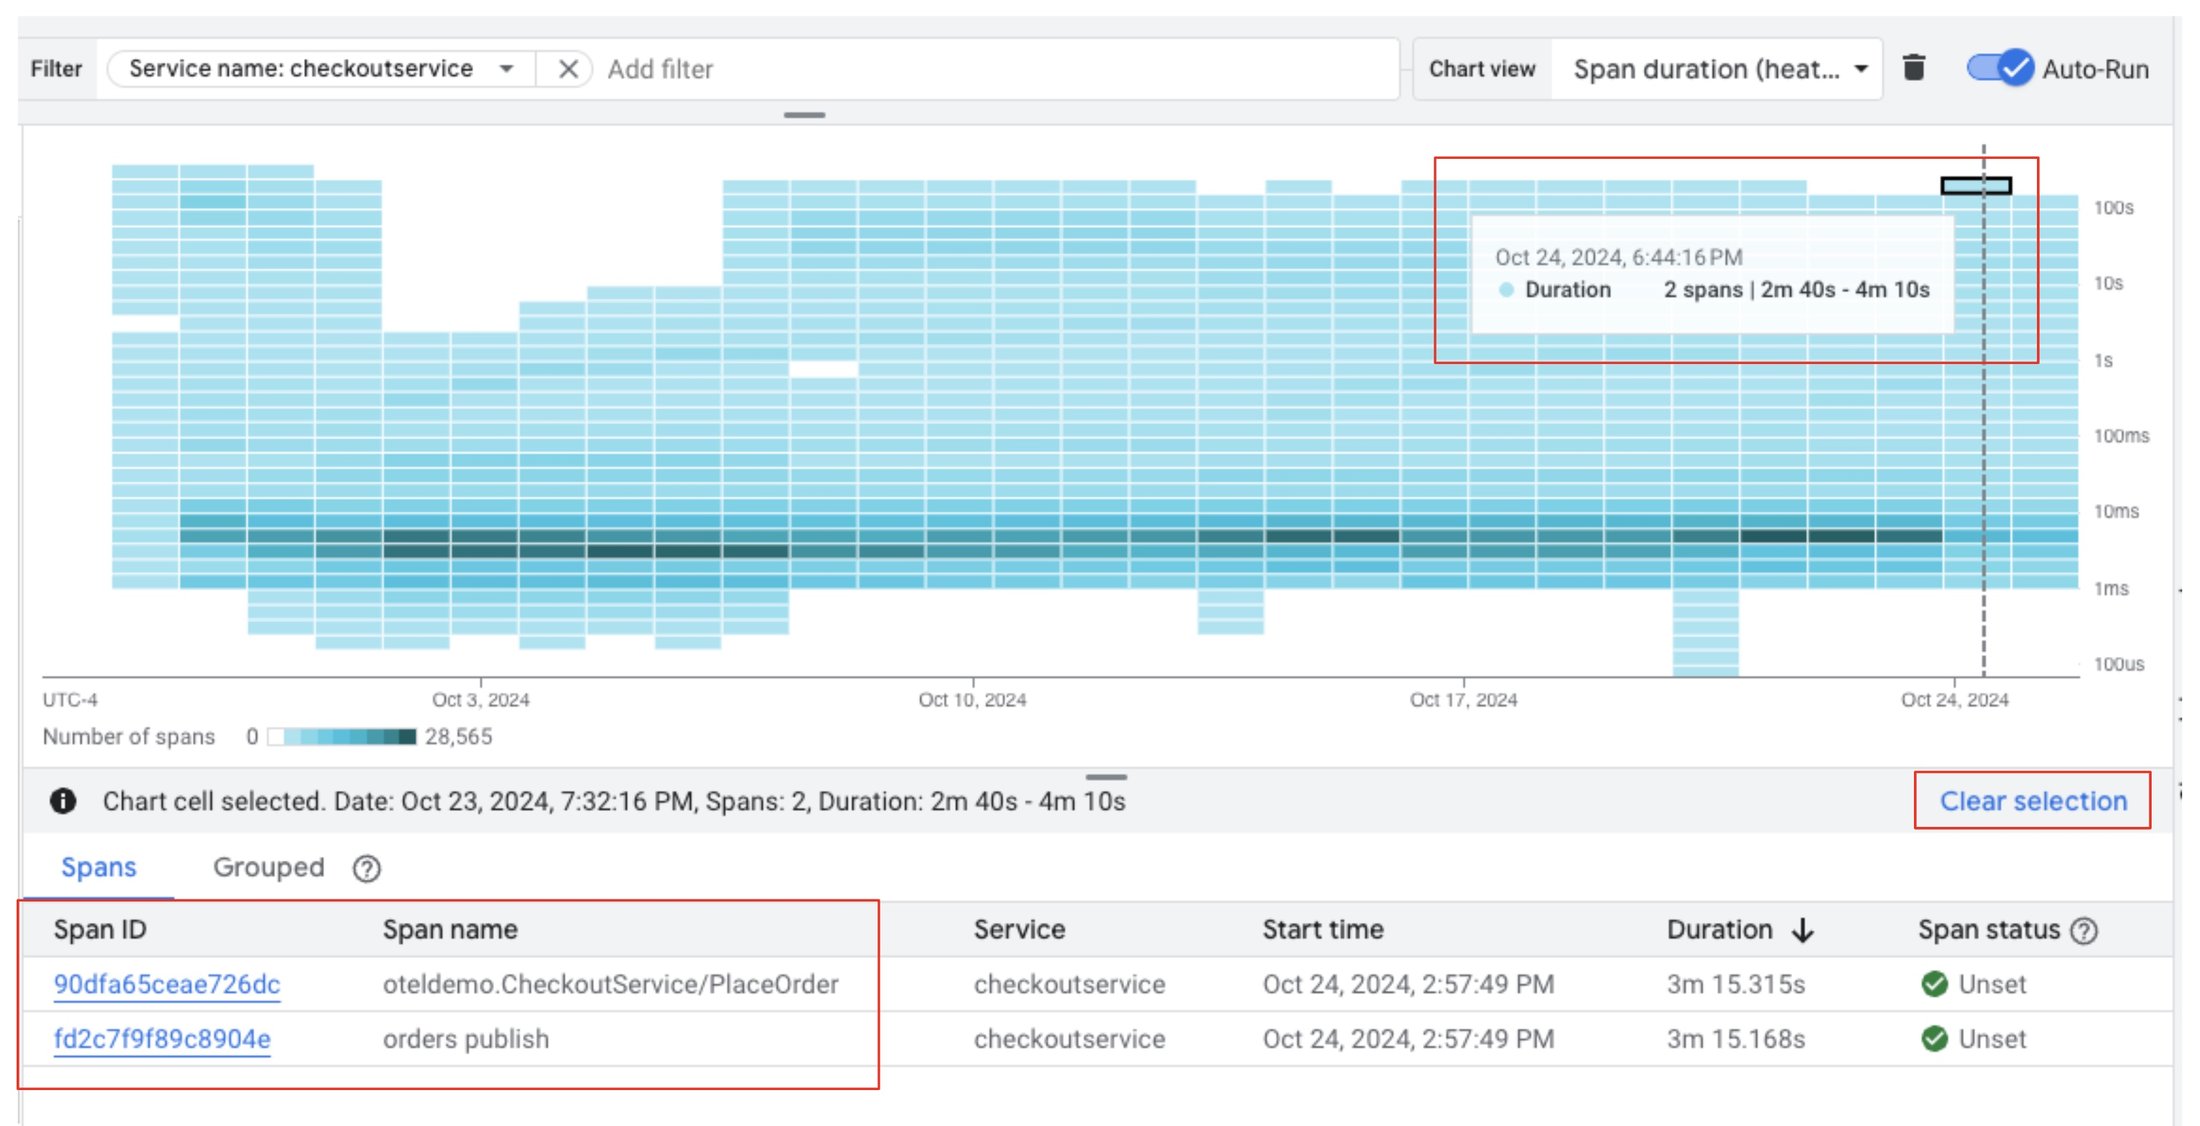
ヒートマップ グラフに戻り、外れ値のセルを選択して詳細を確認します。このセルには、期間が 2 分を超える、2 つの一致するスパンが含まれています。これは問題です。
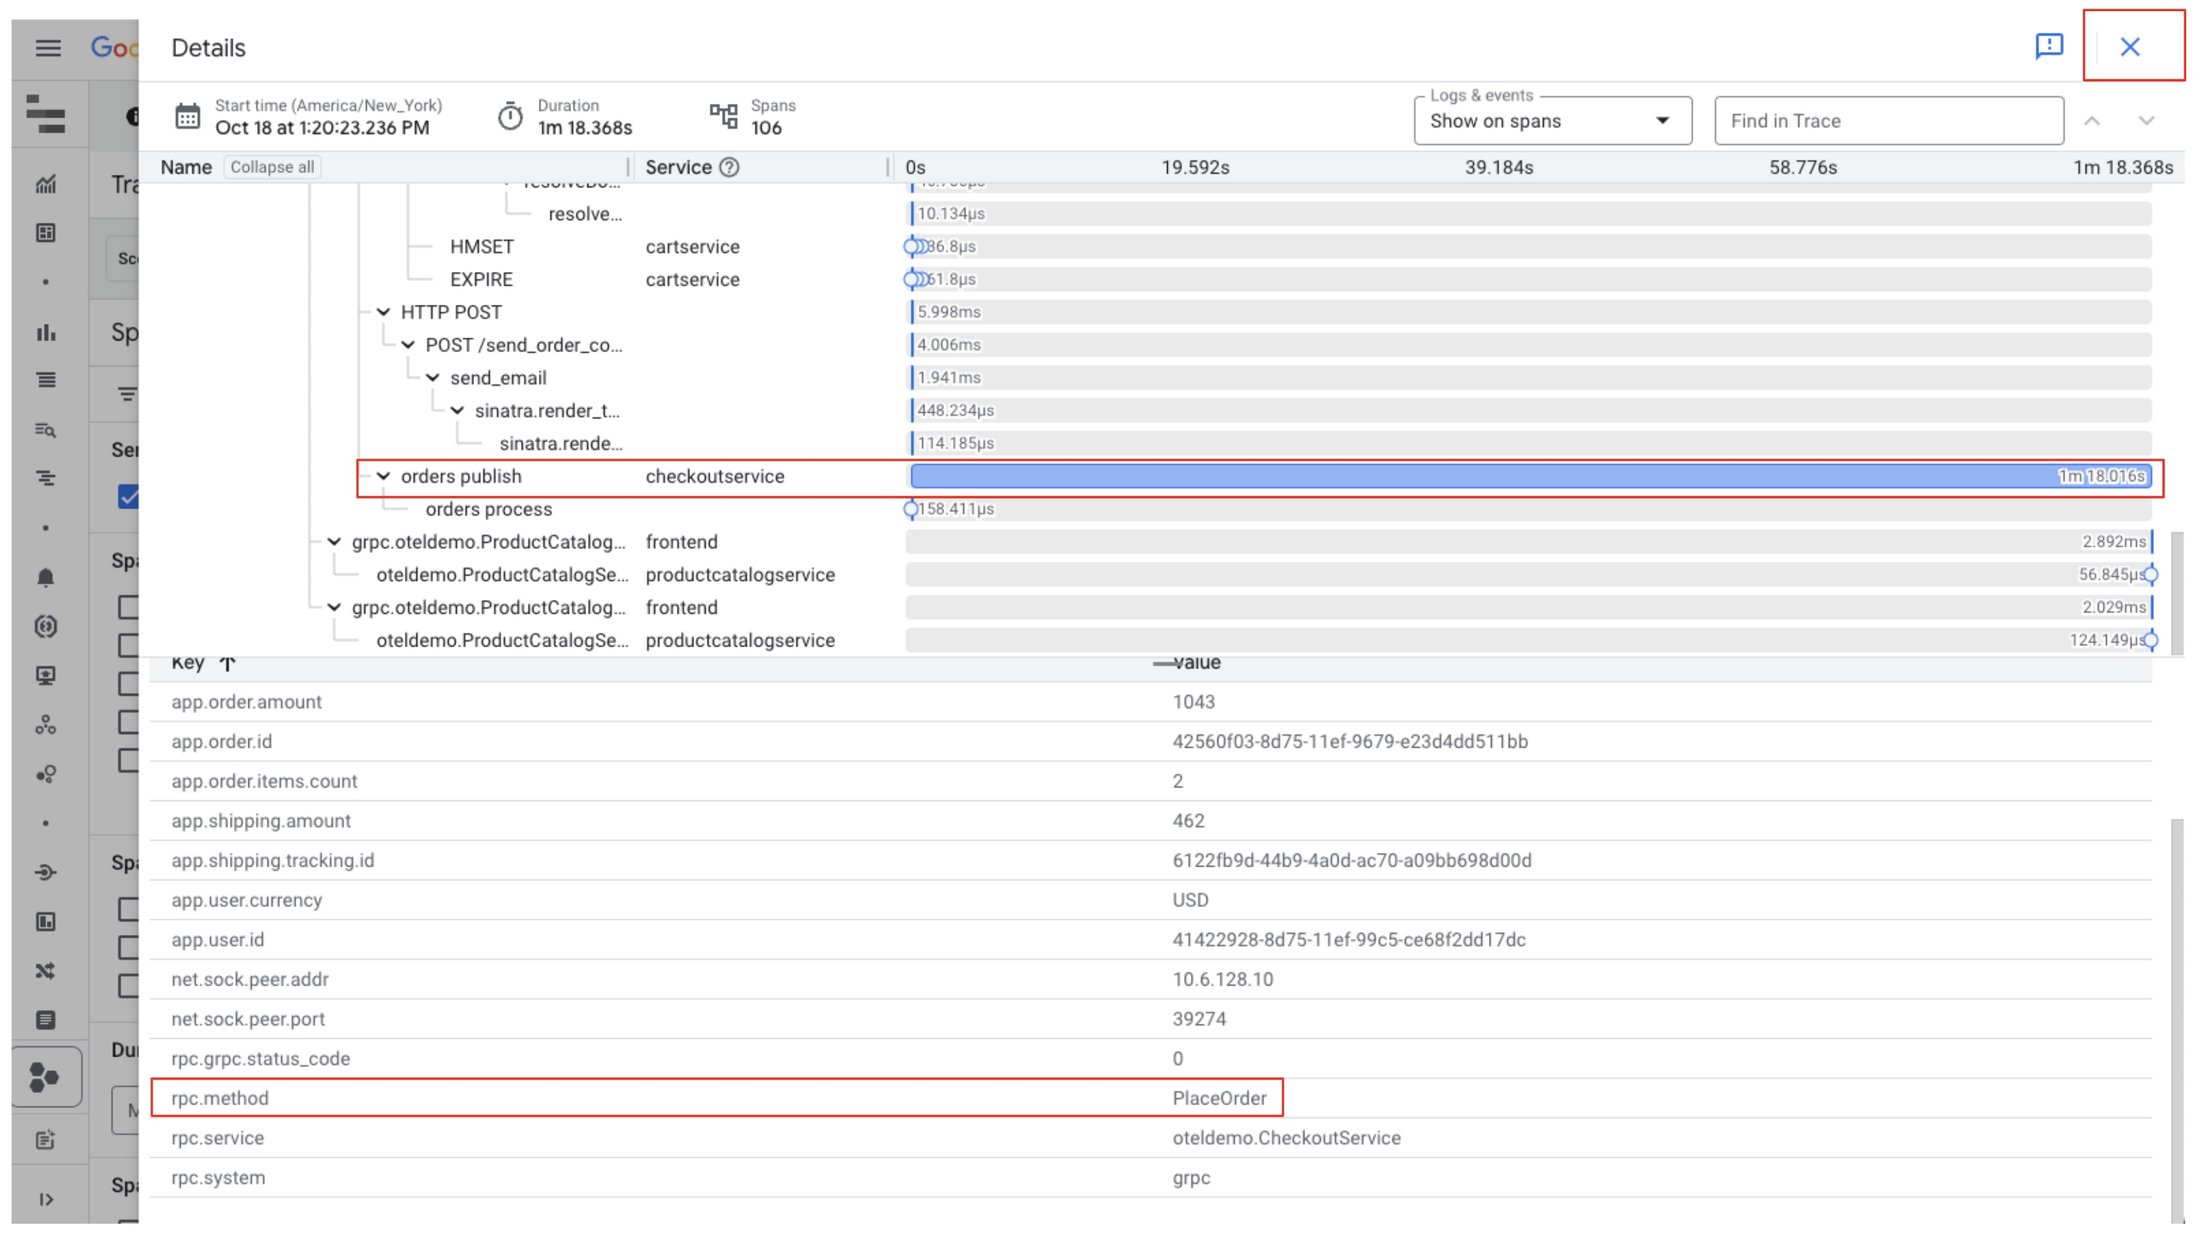
完全なトレースを表示してこれらのスパンの一つを調査したところ、orders publish スパンがこのリクエストの処理にかかる時間の大部分を占めていることがわかりました。そのため、checkoutservice がこのような呼び出しの処理に問題を抱えているという仮説を立てます。仮説を検証するために、rpc.method 属性が PlaceOrder であることをメモし、X ボタンを使用してこのトレースを終了します。
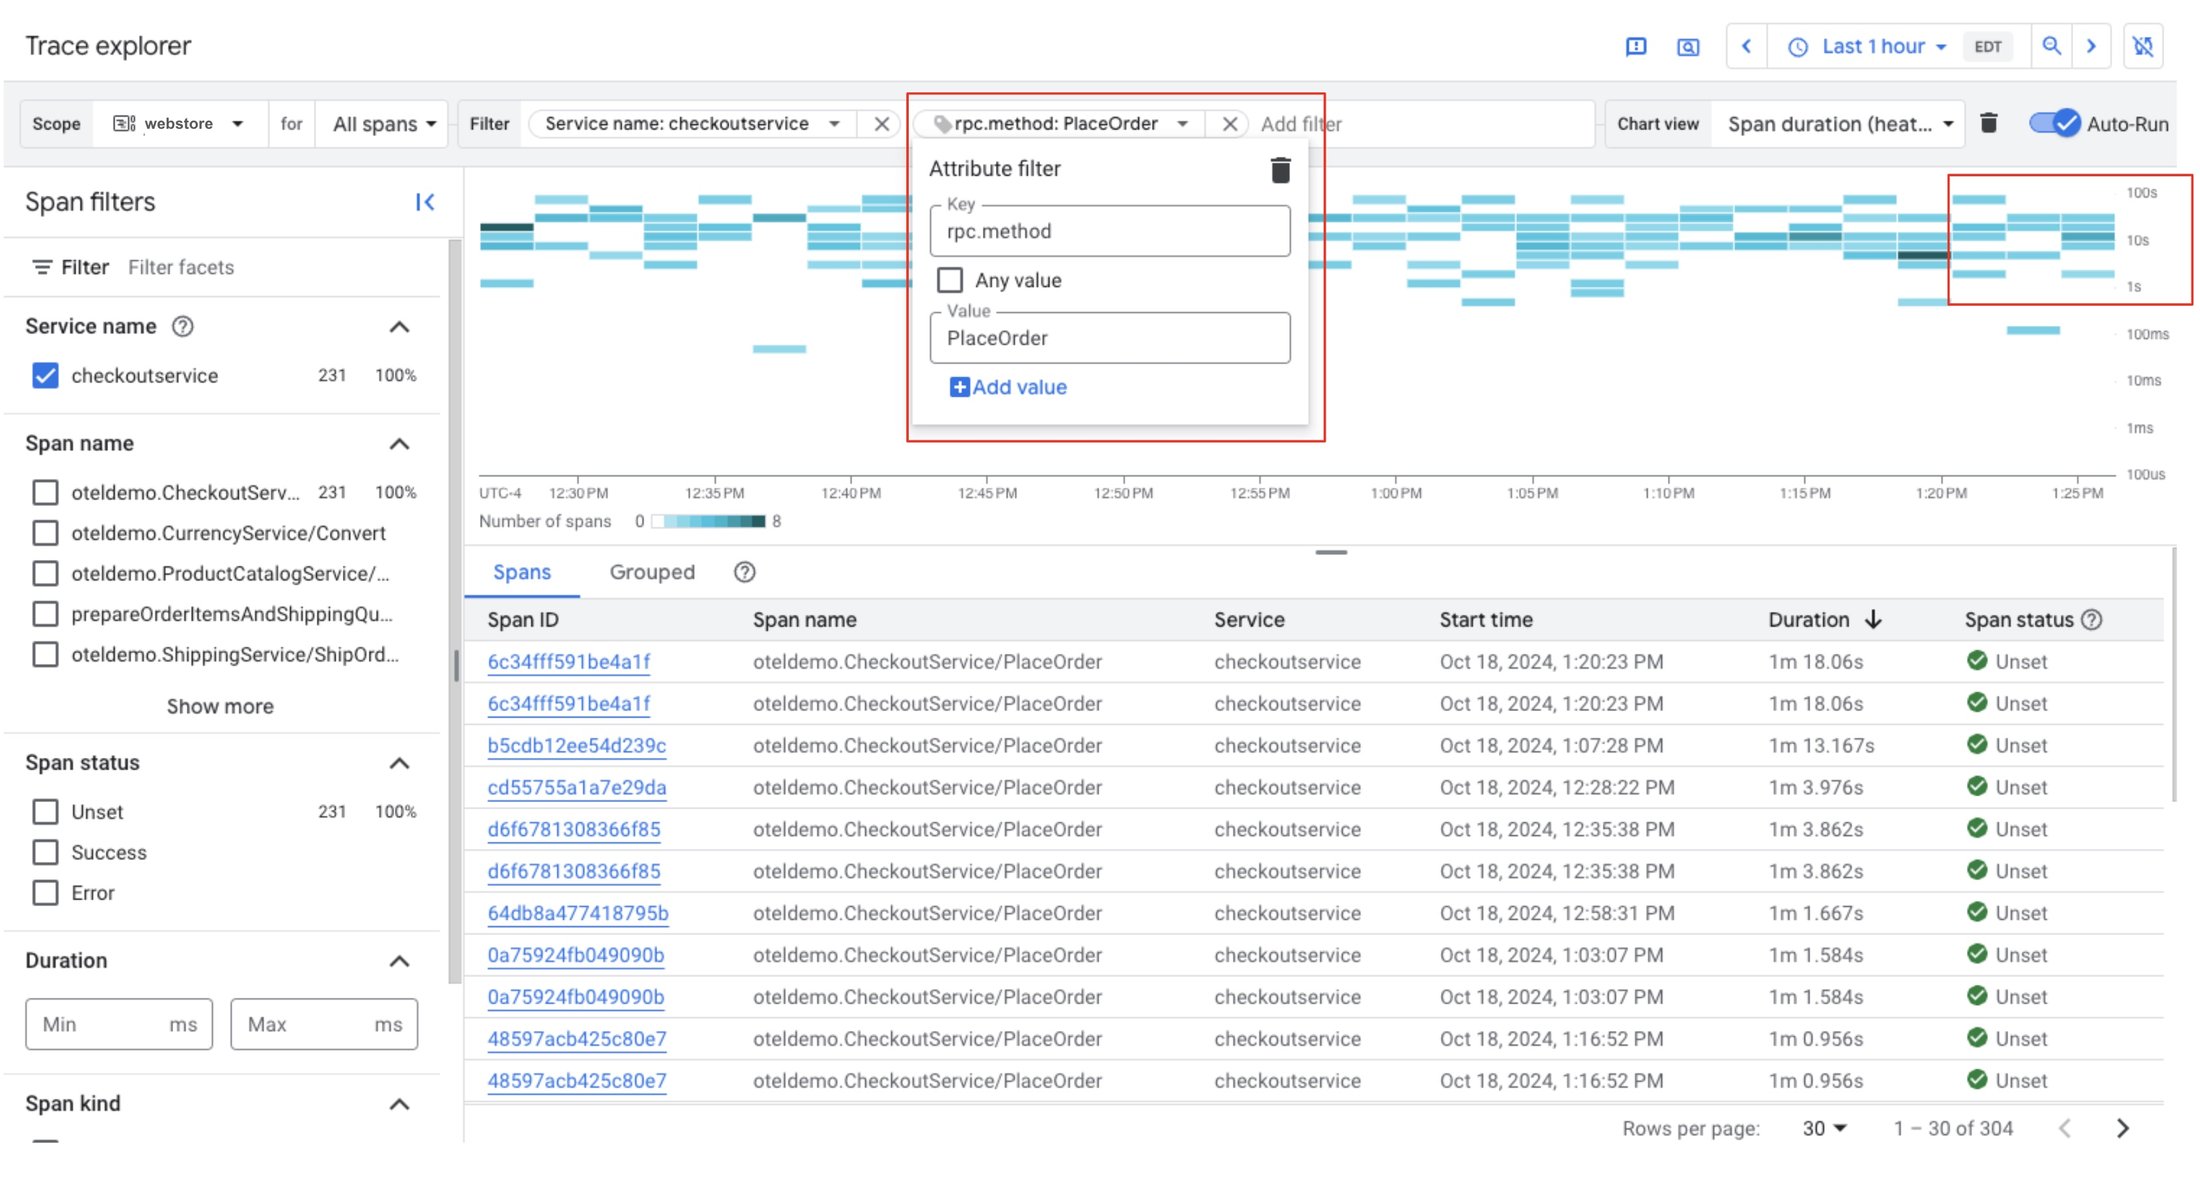
フィルタバーを使用して、キー: rpc.method、値: PlaceOrder の属性フィルタを追加すると、サービスで処理される PlaceOrder 呼び出しに明らかなレイテンシの問題があることがわかります。この問題を以前に経験しており、この問題に対処するランブックがあることを知っているので、インシデントを軽減するために取るべき適切なアクションを SRE チームに警告します。
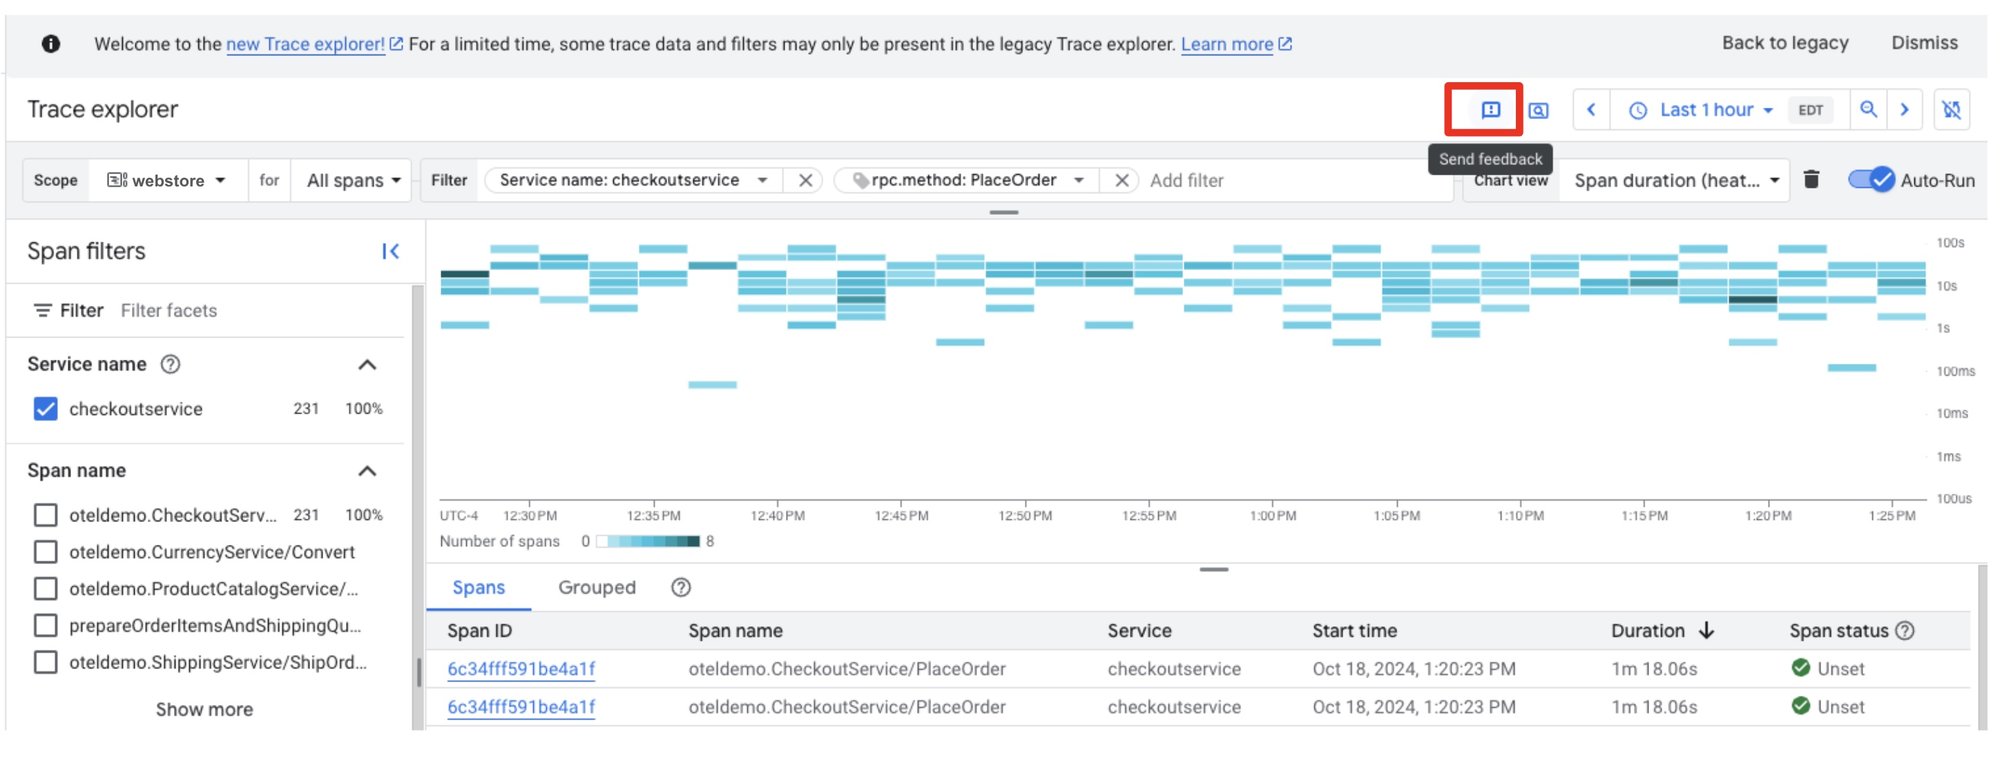
[フィードバックを送信] ボタンからフィードバックをお寄せください。
舞台裏
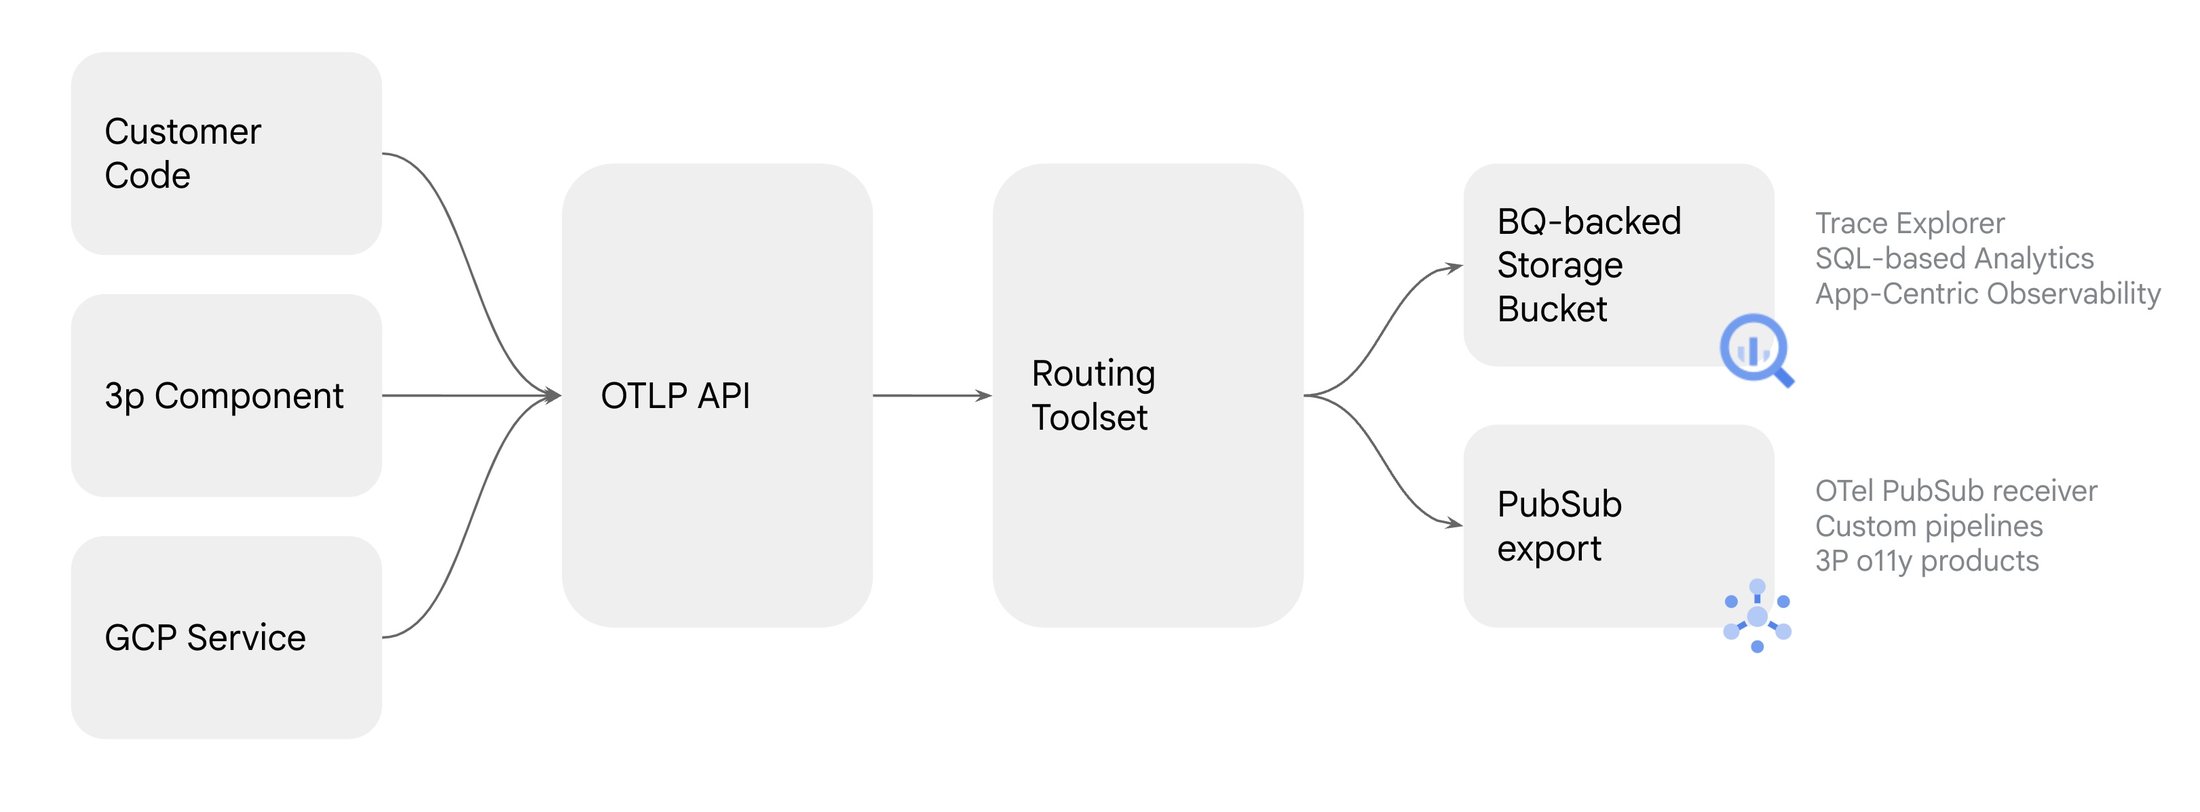
この新しいエクスペリエンスは、ログ分析の基盤となるものと同じプラットフォームを使用して、BigQuery を活用しています。このプラットフォームを最大限に活用する新しい機能(SQL クエリ、柔軟なサンプリング、エクスポート、リージョン ストレージ)をリリースする予定です。
まとめると、新しい Cloud Trace エクスプローラを使用して、トレースデータの高度なクエリと可視化を行い、サービス指向の調査を実行できます。これにより、開発者と SRE は、本番環境のインシデントを効果的にトラブルシューティングし、通常の運用を復元するための緩和策を特定できます。
新しい Cloud Trace エクスプローラはすべてのユーザーに一般提供されています。ぜひお試しいただき、[フィードバックを送信] ボタンからフィードバックをお寄せください。
-プロダクト マネージャー Sujay Solomon
-エンジニアリング マネージャー Punya Biswal