Profiling Multislice environments
Cloud TPU Multislice environments are composed of multiple TPU Pod slices that communicate over the Data Center Network (DCN). You can use the DCN collective stats tool to view information about how effectively your Multislice environment is utilizing the DCN network. Specifically, the DCN Collective Stats tool enables you to:
- View and understand inter-slice network performance based on collected data
- Identify performance bottlenecks
- Optimize your model's performance
All metrics in the DCN collective stats tool are generated on a per-TPU basis.
Terminology
The DCN collective stats tool displays metrics that describe communication that occurs between TPU slices within a Multislice environment. When the TPU runtime initiates inter-slice communication, a series of operations are used:
send- Interrupts the host to start Direct Memory Access (DMA) and provides a filled buffer to the host to start the data transfer.
send-done- Signals the host that the data transfer is completed.
recv- Provides an empty buffer for the host to fill with the transferred data.
recv-done- Signals the host that the data has been received.
A collective is initiated when a send operation occurs and is completed when
the matching recv-done operation occurs.
Slack Time
A measure of time the collective is able to send and receive data.
This does not include the send, send-done, recv or recv-done operations.
For example, given the following timeline:
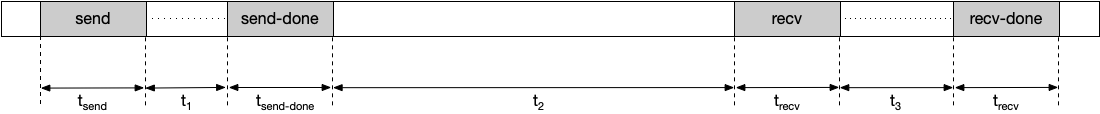
Slack time is calculated in this example as:
Slack time = t1 + t2 + t3
Increasing slack time reduces the chances to stall the TPU for a collective. You can increase the slack time by choosing a different sharding method.
Stall duration
The average duration of time the collective spends in the send, send-done, recv, and recv-done operations. Note, this does not include time spent transmitting data. For example, given the following timeline:
Stall duration is calculated in this example as:
Stall duration = tsend + tsend-done + trecv + trecv-done
Observed duration
The amount of time between the send and recv-done operations, including the
time sending and receiving data. For example, given the following timeline:
Observed duration is calculated as:
Observed duration = tsend + t1 + tsend-done + t2 + trecv + t3 + trecv-done
Occurrences
The number of times a collective is initiated and completed during a profile
duration. A collective is initiated when a send operation occurs and is
completed when the matching recv-end operation occurs. The send operation
and its matching recv-done operation must occur within a profile duration to be
included in this metric.
Aggregated total stall
The total amount of time a collective stalls a TPU during a profile duration. Aggregation total stall is calculated as:
Aggregated total stall = stall duration * occurrences
Data transmitted size
The amount of data transmitted over the network for the collective during the profile duration.
Required bandwidth
The bandwidth required to transmit data within the provided slack. You can use this metric to see the number of collectives competing for network bandwidth during the profile duration. Required bandwidth is computed as:
Required bandwidth = data transmitted size / slack time
Tool status
The following table shows the version of TensorFlow or TPU runtime version required for each metric displayed in the DCN Collective Stats tool.
| DCN Collective Stats | Supported TensorFlow of TPU runtime version |
|---|---|
| Slack time | TensorFlow 2.15.0, tensorboard 2.15.1 and tensorboard-plugin-profile 2.15.0 |
| Stall duration | TensorFlow 2.15.0, tensorboard 2.15.1 and tensorboard-plugin-profile 2.15.0 |
| Observed duration | TensorFlow 2.15.0, tensorboard 2.15.1 and tensorboard-plugin-profile 2.15.0 |
| Occurrences | TensorFlow 2.15.0, tensorboard 2.15.1 and tensorboard-plugin-profile 2.15.0 |
| Aggregated total stall | tf-nightly, tb-nightly, tbp-nightly |
| Data transmitted size | tf-nightly, tb-nightly, tbp-nightly |
| Required bandwidth | tf-nightly, tb-nightly, tbp-nightly |
How to Analyze DCN Collective Stats Tool
- Run TensorBoard server and go to Profile tab.
- Sort the table in DCN collective stats tool by Aggregated Total Stall in descending order.
- Identify the DCN collective name that has the highest Aggregated Total Stall. If the aggregated stall duration of this collective is significantly high compared to others, this could indicate that there is a bottleneck in the DCN collective.
- Multiply the required bandwidth of the DCN collective by the number of cores. There are 8 cores per v4 TPU host, so the required bandwidth for a collective is 8 x the value displayed. If the required bandwidth is greater than the maximum network bandwidth of the TPU, this may mean the network is congested. To bring down the required bandwidth, try changing the sharding mechanism you use. For more information about sharding mechanisms, see Cloud TPU Multislice overview.
- Generate an HLO dump to determine if there are any compiler issues. It is
better to fan out
sendandrecv-doneoperations for a collective to allow scheduling of more overlapping HLO Ops. Overlapping more HLO operations reduces TPU stall time. - Check the duration of
recv-doneoperations in the Trace Viewer for the DCN collective that has the maximum aggregated total stall. If the duration of the transfer is high, there could be a bandwidth bottleneck becauserecv-doneoperations are usually blocked on the network to get the data. - If the duration of
recv-doneoperations is not too high compared to the slack time, this could indicate a hardware issue.