Cloud Composer 1 | Cloud Composer 2
This tutorial guides you through diagnosing and troubleshooting task scheduling and parsing issues that lead to scheduler malfunctioning, parsing errors and latency, and task failure.
Introduction
The Airflow scheduler is primarily impacted by two factors: task scheduling and DAG parsing. Issues in one of those factors can have a negative impact on the environment health and performance.
Sometimes too many tasks are scheduled simultaneously. In this situation, the queue is filled up, and tasks remain in the "scheduled" state or become rescheduled after being queued, which might cause task failure and performance latency.
Another common issue is parsing latency and errors caused by the complexity of a DAG code. For example, a DAG code that contains Airflow variables at the top level of the code can lead to parsing delays, database overload, scheduling failures, and DAG timeouts.
In this tutorial, you will diagnose the example DAGs and learn how to troubleshoot scheduling and parsing problems, improve DAG scheduling, and optimize your DAG code and environment configurations to improve performance.
Objectives
This section lists objectives for examples in this tutorial.
Example: Scheduler malfunctioning and latency caused by high task concurrency
Upload the sample DAG that runs multiple times simultaneously and diagnose the scheduler malfunctioning and latency issues with Cloud Monitoring.
Optimize your DAG code by consolidating the tasks and evaluate the performance impact.
Distribute the tasks more evenly over time and evaluate the performance impact.
Optimize your Airflow configurations and environment configurations and evaluate the impact.
Example: DAG parsing errors and latency caused by complex code
Upload the sample DAG with Airflow variables and diagnose parsing issues with Cloud Monitoring.
Optimize the DAG code by avoiding Airflow variables at the top level of the code and evaluate the impact on parsing time.
Optimize Airflow configurations and environment configurations and evaluate the impact on parsing time.
Costs
This tutorial uses the following billable components of Google Cloud:
When you finish this tutorial, you can avoid continued billing by deleting the resources you created. For more details, see Clean up.
Before you begin
This section describes actions that are required before you start the tutorial.
Create and configure a project
For this tutorial, you need a Google Cloud project. Configure the project in the following way:
In the Google Cloud console, select or create a project:
Make sure that billing is enabled for your project. Learn how to check if billing is enabled on a project.
Make sure that your Google Cloud project user has the following roles to create the necessary resources:
- Environment and Storage Object Administrator
(
roles/composer.environmentAndStorageObjectAdmin) - Compute Admin (
roles/compute.admin)
- Environment and Storage Object Administrator
(
Enable APIs for your project
Enable the Cloud Composer API.
Create your Cloud Composer environment
Create a Cloud Composer 2 environment.
As a part of creating the environment,
you grant the Cloud Composer v2 API Service Agent Extension
(roles/composer.ServiceAgentV2Ext) role to the Composer Service Agent
account. Cloud Composer uses this account to perform operations
in your Google Cloud project.
Example: Scheduler malfunctioning and task failure because of task scheduling issues
This example demonstrates debugging scheduler malfunctioning and latency caused by high task concurrency.
Upload the sample DAG to your environment
Upload the following sample DAG to the environment
that you created in the previous steps. In this tutorial, this DAG is named
dag_10_tasks_200_seconds_1.
This DAG has 200 tasks. Each task waits for 1 second and prints "Complete!". The DAG is triggered automatically once uploaded. Cloud Composer runs this DAG 10 times, and all DAG runs happen in parallel.
import time
from datetime import datetime, timedelta

from airflow import DAG
from airflow.decorators import task


tasks_amount = 200
seconds = 1
minutes = 5

with DAG(
    dag_id=f"dag_10_tasks_{tasks_amount}_sec_{seconds}",
    start_date=datetime(2023, 11, 22, 20, 0),
    end_date=datetime(2023, 11, 22, 20, 49),
    schedule_interval=timedelta(minutes=minutes),
    catchup=True,
) as dag:

    @task
    def create_subtasks(seconds: int) -> None:
        time.sleep(seconds)

    for i in range(tasks_amount):
        create_subtasks(seconds)
Diagnose the scheduler malfunctioning and task failure issues
After the DAG runs complete, open Airflow UI, and click the
dag_10_tasks_200_seconds_1 DAG. You will see that 10 total DAG runs were
successful, and each has 200 tasks that succeeded.
Review the Airflow task logs:
In the Google Cloud console, go to the Environments page.
In the list of environments, click the name of your environment. The Environment details page opens.
Go to the Logs tab, then go to All logs > Airflow logs > Workers > View in Logs Explorer.
On the logs histogram, you can see the errors and warnings indicated with red and orange colors:
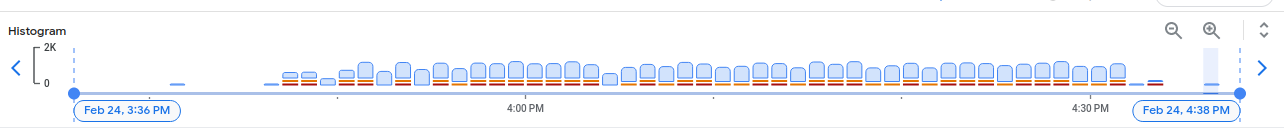
The example DAG resulted in about 130 warnings and 60 errors. Click any column that contains yellow and red bars. You will see some of the following warnings and errors in the logs:
State of this instance has been externally set to success. Terminating
instance.

Received SIGTERM. Terminating subprocesses.

worker: Warm shutdown (MainProcess).
These logs might indicate that the resource usage exceeded the limits and the worker restarted itself.
If an Airflow task is kept in the queue for too long then the scheduler marks it as failed and up_for_retry and is going to reschedule it once again for execution. One way to observe the symptoms of this situation is to look at the chart with the number of queued tasks and if the spikes in this chart don't drop in about 10 minutes, then there will likely be failures of tasks (with no logs).
Review the monitoring information:
Go to the Monitoring tab and select Overview.
Review the Airflow tasks graph.
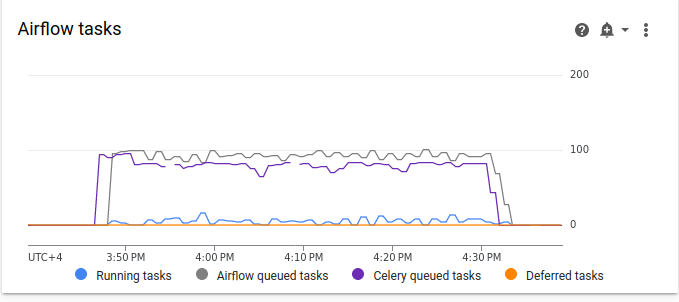
Figure 2. Airflow tasks graph (click to enlarge) In the Airflow tasks graph, there is a spike in queued tasks that lasts for more than 10 minutes, which might mean that there are not enough resources in your environment to process all scheduled tasks.
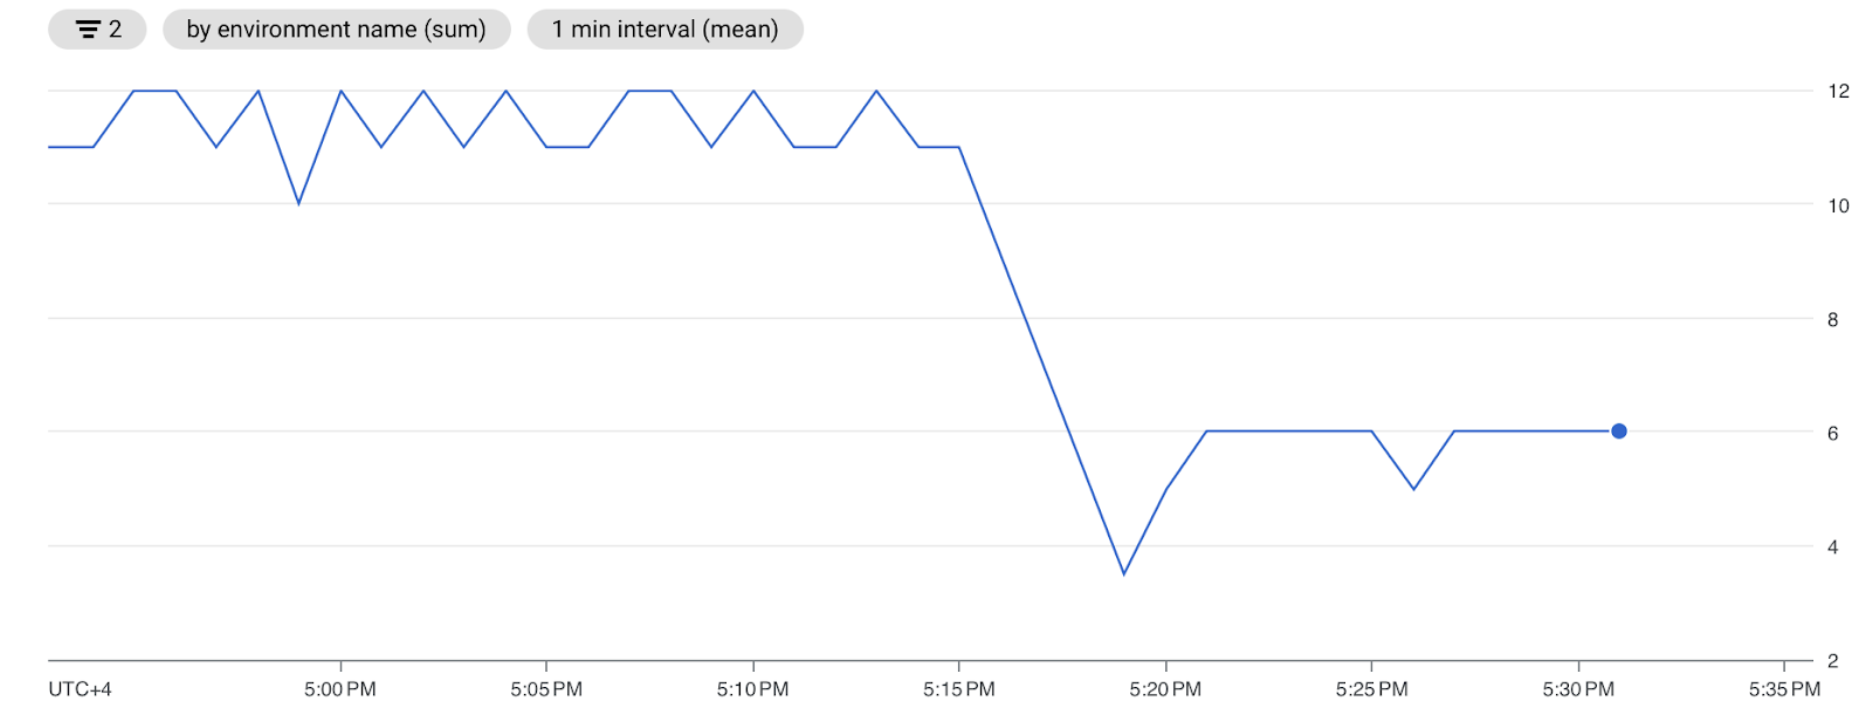
Review the Active workers graph:
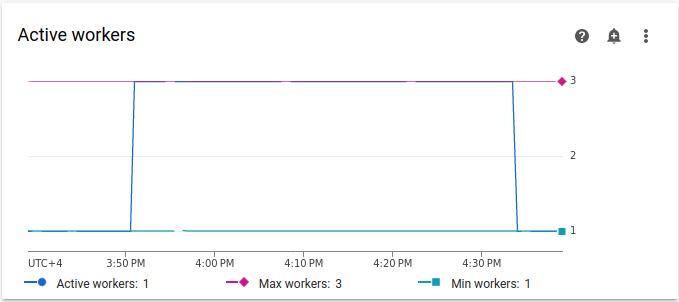
Figure 3. Active workers graph (click to enlarge) The Active workers graph indicates that the DAG triggered autoscaling to the maximum allowed limit of three workers during the DAG run.
Resource usage graphs can indicate the lack of capacity in Airflow workers to run queued tasks. On the Monitoring tab, select Workers and review Total worker CPU usage and Total worker memory usage graphs.
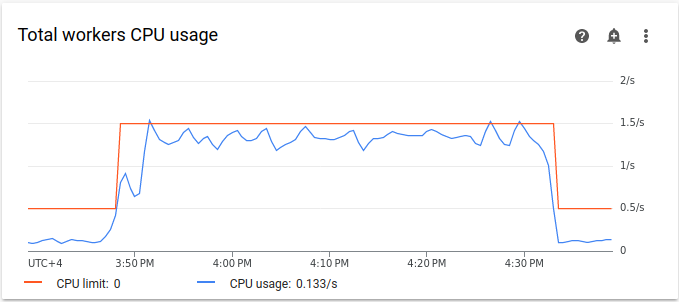
Figure 4. Total workers CPU usage graph (click to enlarge) 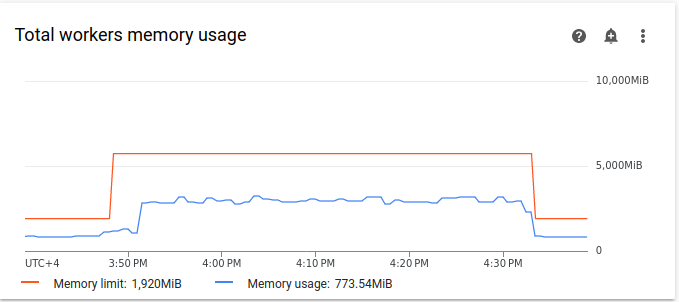
Figure 5. Total workers memory usage graph (click to enlarge) The graphs indicate that the execution of too many tasks simultaneously resulted in hitting the CPU limit. The resources had been used for over 30 minutes, which is even longer than the total duration of 200 tasks in 10 DAG runs running one by one.
These are the indicators of the queue being filled up and a lack of resources to process all scheduled tasks.
Consolidate your tasks
The current code creates many DAGs and tasks with no sufficient resources to process all tasks in parallel, which results in the queue being filled up. Keeping tasks in the queue for too long may cause tasks to reschedule or fail. In such situations, you should opt for a smaller number of more consolidated tasks.
The following sample DAG changes the number of tasks in the initial example from 200 to 20 and increase the wait time from 1 to 10 seconds to imitate more consolidated tasks that do the same amount of work.
Upload the following sample DAG to the environment
that you created. In this tutorial, this DAG is named
dag_10_tasks_20_seconds_10.
import time
from datetime import datetime, timedelta

from airflow import DAG
from airflow.decorators import task


tasks_amount = 20
seconds = 10
minutes = 5

with DAG(
    dag_id=f"dag_10_tasks_{tasks_amount}_sec_{seconds}",
    start_date=datetime(2021, 12, 22, 20, 0),
    end_date=datetime(2021, 12, 22, 20, 49),
    schedule_interval=timedelta(minutes=minutes),
    catchup=True,
) as dag:

    @task
    def create_subtasks(seconds: int) -> None:
        time.sleep(seconds)

    for i in range(tasks_amount):
        create_subtasks(seconds)
Evaluate the impact of more consolidated tasks on scheduling processes:
Wait until the DAG runs are completed.
In the Airflow UI, on the DAGs page, click the
dag_10_tasks_20_seconds_10DAG. You will see 10 DAG runs, each has 20 tasks that succeeded.In the Google Cloud console, go to the Environments page.
In the list of environments, click the name of your environment. The Environment details page opens.
Go to the Logs tab, then go to All logs > Airflow logs > Workers > View in Logs Explorer.
The second example with more consolidated tasks resulted in approximately 10 warnings and 7 errors. On the histogram, you can compare the number of errors and warnings in the initial example (earlier values) and the second example (later values).
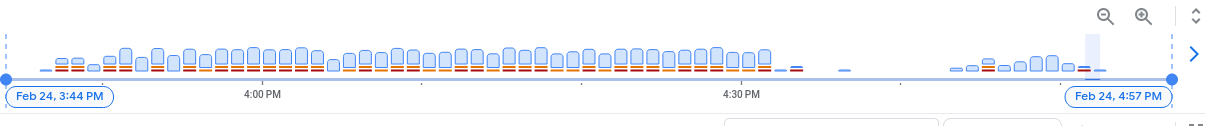
Figure 6. Airflow worker logs histogram after the tasks were consolidated (click to enlarge) When comparing the first example with the more consolidated one, you can see that there are significantly fewer errors and warnings in the second example. However, the same errors related to warm shutdown still appear in the logs because of resource overload.
On the Monitoring tab, select Workers and review the graphs.
When you compare the Airflow tasks graph for the first example (earlier values) with the graph for the second example with more consolidated tasks, you can see that the spike in queued tasks lasted for a shorter period of time when the tasks were more consolidated. However, it lasted close to 10 minutes, which is still sub-optimal.

Figure 7. Airflow tasks graph after the tasks were consolidated (click to enlarge) On the Active workers graph, you can see the first example (on the left side of the graph) used resources for a much more extended period of time than the second one, even though both examples imitate the same amount of work.
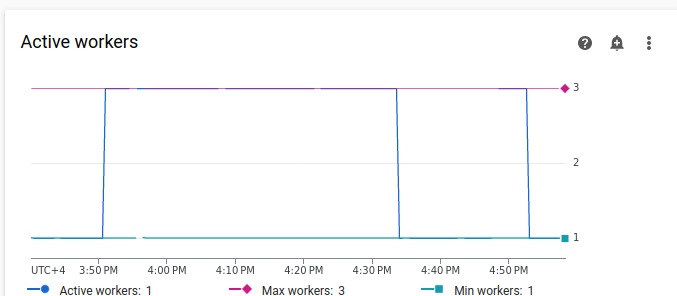
Figure 8. Active workers graph after the tasks were consolidated (click to enlarge) Review the worker resource consumption graphs. Even though the difference between the resources used in the example with more consolidated tasks and the initial example is quite significant, the CPU usage is still spiking to 70% of the limit.
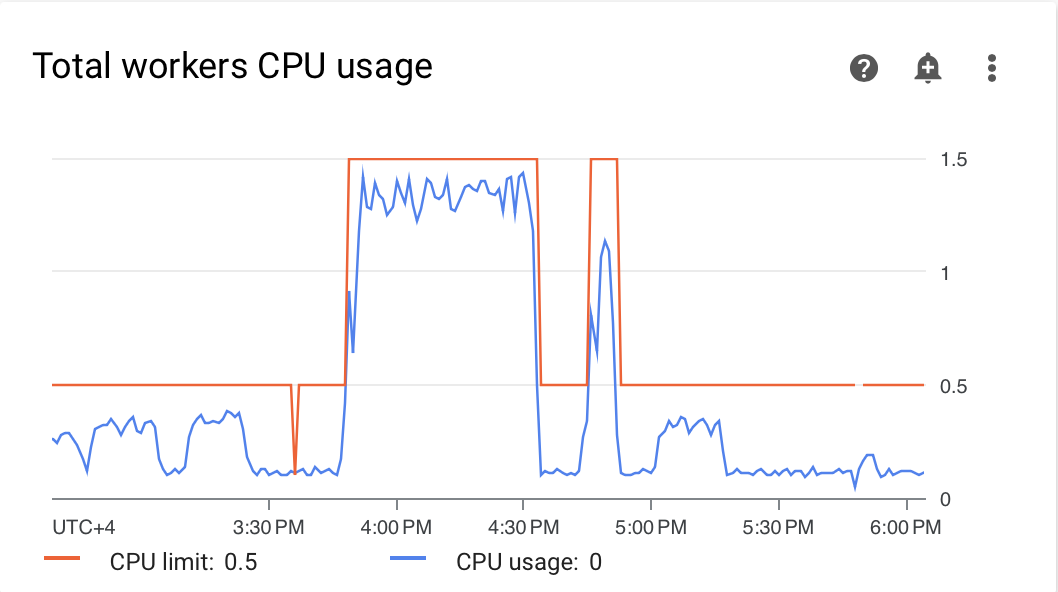
Figure 9. Total workers CPU usage graph after the tasks were consolidated (click to enlarge) 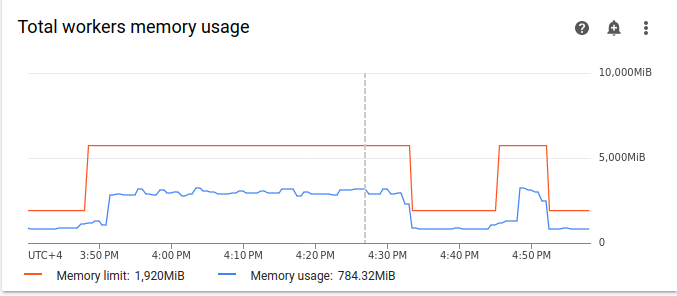
Figure 10. Total workers memory usage graph after the tasks were consolidated (click to enlarge)
Distribute tasks more evenly over time
Too many concurrent tasks result in the queue being filled up, which leads to tasks being stuck in the queue or rescheduled. In the previous steps, you decreased the number of tasks by consolidating those tasks, however, the output logs and monitoring indicated that the number of concurrent tasks is still sub-optimal.
You can control the number of concurrent task runs by implementing a schedule or setting limits for how many tasks can be run simultaneously.
In this tutorial, you distribute tasks more evenly over time by adding
DAG-level parameters into the dag_10_tasks_20_seconds_10 DAG:
Add
max_active_runs=1argument to the DAG context manager. This argument sets a limit of only a single instance of a DAG run in a given moment.Add
max_active_tasks=5argument to the DAG context manager. This argument controls the maximum number of task instances that can run concurrently in each DAG.
Upload the following sample DAG to the environment
that you created. In this tutorial, this DAG is named
dag_10_tasks_20_seconds_10_scheduled.py.
import time
from datetime import datetime, timedelta

from airflow import DAG
from airflow.decorators import task


tasks_amount = 20
seconds = 10
minutes = 5
active_runs = 1
active_tasks = 5


with DAG(
    dag_id=f"dag_10_tasks_{tasks_amount}_sec_{seconds}_runs_{active_runs}_tasks_{active_tasks}",
    start_date=datetime(2021, 12, 22, 20, 0),
    end_date=datetime(2021, 12, 22, 20, 49),
    schedule_interval=timedelta(minutes=minutes),
    max_active_runs=active_runs,
    max_active_tasks=active_tasks,
    catchup=True,
) as dag:

    @task
    def create_subtasks(seconds: int) -> None:
        time.sleep(seconds)

    for i in range(tasks_amount):
        create_subtasks(seconds)
Evaluate the impact of distributing tasks over time on scheduling processes:
Wait until the DAG runs are completed.
In the Google Cloud console, go to the Environments page.
In the list of environments, click the name of your environment. The Environment details page opens.
Go to the Logs tab, then go to All logs > Airflow logs > Workers > View in Logs Explorer.
On the histogram, you can see that the third DAG with a limited number of active tasks and runs did not generate any warnings or errors and the distribution of logs looks more even compared to the previous values.

Figure 11. Airflow worker logs histogram after the tasks were consolidated and distributed over time (click to enlarge)
The tasks in the dag_10_tasks_20_seconds_10_scheduled example that has a
limited number of active tasks and runs did not cause resource pressure because
the tasks were queued evenly.
After you performed the described steps, you optimized the resource usage by consolidating small tasks and distributing them more evenly over time.
Optimize environment configurations
You can adjust your environment configurations to make sure there is always capacity in Airflow workers to run queued tasks.
Number of workers and worker concurrency
You can adjust the maximum number of workers to make Cloud Composer automatically scale your environment within the set limits.
The [celery]worker_concurrency parameter defines the maximum number of tasks
a single worker can pick up from the task queue. Changing this parameter
adjusts the number of tasks that a single worker can execute at the same time.
You can change this Airflow configuration option by
overriding it. By default, the worker concurrency is set to a
minimum of the following: 32, 12 * worker_CPU, 8 * worker_memory, which means
it is dependent on worker resource limits. See
Optimize environments for more information about the default
worker concurrency values.
The number of workers and worker concurrency work in combination with each other, and your environment performance is highly dependent on both parameters. You can use the following considerations to pick the correct combination:
Multiple quick tasks running in parallel. You can increase worker concurrency when there are tasks waiting in the queue, and your workers use a low percentage of their CPUs and memory at the same time. However, under certain circumstances the queue might never fill up, causing autoscaling to never trigger. If small tasks finish execution by the time the new workers are ready, an existing worker can pick up the remaining tasks, and there will be no tasks for newly created workers.
In these situations, it is recommended to increase the minimum number of workers and increase worker concurrency to avoid overeager scaling.
Multiple long tasks running in parallel. The high worker concurrency prevents the system from scaling the number of workers. If multiple tasks are resource-intensive and take a long time to complete, a high worker concurrency can lead to the queue never being filled up and all tasks being picked up by just one worker, which results in performance issues. In these situations, it is recommended to increase the maximum number of workers and decrease worker concurrency.
The importance of parallelism
Airflow schedulers control the scheduling of DAG runs and individual tasks from
DAGs. The [core]parallelism Airflow configuration option controls how many
tasks the Airflow scheduler can queue in the executor's queue after all
dependencies for these tasks are met.
Parallelism is a protective mechanism of Airflow that determines how many tasks can be run at the same time per each scheduler, regardless of the worker count. The parallelism value, multiplied by the number of schedulers in your cluster, is the maximum number of task instances that your environment can queue.
Usually, [core]parallelism is set as a product of a maximum number of workers
and [celery]worker_concurrency. It is also affected by the
pool.
You can change this Airflow configuration option by
overriding it. For more information about adjusting Airflow
configurations related to scaling, see
Scaling Airflow configuration.
Find optimal environment configurations
The recommended way to fix scheduling issues is consolidating small tasks into larger tasks and distributing tasks more evenly over time. In addition to optimizing DAG code, you can also optimize environment configurations to have a sufficient capacity for running multiple tasks concurrently.
For example, assume you consolidate tasks in your DAG as much as possible but limiting active tasks to spread them more evenly over time is not a preferred solution for your specific use case.
You can adjust parallelism, number of workers, and worker concurrency
parameters to run the dag_10_tasks_20_seconds_10 DAG without limiting active
tasks. In this example, DAG runs 10 times and each run contains 20 small tasks.
If you want to run them all simultaneously:
You will need a larger environment size, because it controls performance parameters of the managed Cloud Composer infrastructure of your environment.
Airflow workers must to be able to run 20 tasks simultaneously, which means you need to set worker concurrency to 20.
The workers need sufficient CPU and memory to handle all tasks. Worker concurrency is affected by worker CPU and memory, thus, you will need at least
worker_concurrency / 12in CPU and atleast worker_concurrency / 8in memory.You will need to increase parallelism to match the higher worker concurrency. In order for workers to pick up 20 tasks from the queue, the scheduler will need to schedule those 20 tasks first.
Adjust your environment configurations in the following way:
In the Google Cloud console, go to the Environments page.
In the list of environments, click the name of your environment. The Environment details page opens.
Go to the Environment configuration tab.
Find the Resources > Workloads configuration and click Edit.
In the Worker section, in the Memory field, specify the new memory limit for Airflow workers. In this tutorial, use 4 GB.
In the CPU field, specify the new CPU limit for Airflow workers. In this tutorial, use 2 vCPU.
Save the changes and allow several minutes for your Airflow workers to restart.
Next, override parallelism and worker concurrency Airflow configuration options:
Go to the Airflow Configuration Overrides tab.
Click Edit, then click Add Airflow Configuration Override.
Override the parralelism configuration:
Section Key Value coreparallelism20Click Add Airflow Configuration Override and override the worker concurrency configuration:
Section Key Value celeryworker_concurrency20Click Save and wait until the environment updates its configuration.
Trigger the same example DAG again with the adjusted configurations:
In the Airflow UI, go to the DAGs page.
Find the
dag_10_tasks_20_seconds_10DAG and delete it.After the DAG is deleted, Airflow checks the DAGs folder in your environment's bucket and automatically runs the DAG again.
After the DAG runs are completed, review the Logs histogram again. On diagram,
you can see that the dag_10_tasks_20_seconds_10 example with more
consolidated tasks did not generate any errors and warnings when running with
the adjusted environment configuration. Compare the results to the earlier data
on the diagram, where the same example generated errors and warnings when
running with tge default environment configuration.

Environment configurations and Airflow configurations play a crucial role in task scheduling, however, it is not possible to increase the configurations beyond certain limits.
We recommend to optimize the DAG code, consolidate tasks, and use scheduling for optimized performance and efficiency.
Example: DAG parsing errors and latency because of complex DAG code
In this example, you investigate the parsing latency of a sample DAG that imitates an excess of Airflow variables.
Create a new Airflow variable
Before you upload the sample code, create a new Airflow variable.
In the Google Cloud console, go to the Environments page.
In the Airflow webserver column, follow the Airflow link for your environment.
Go to Admin > Variables > Add a new record.
Set the following values:
- key:
example_var - val:
test_airflow_variable
- key:
Upload the sample DAG to your environment
Upload the following sample DAG to the environment
that you created in the previous steps. In this tutorial, this DAG is named
dag_for_loop_airflow_variable.
This DAG contains a for loop that runs 1,000 times and imitates an excess of
Airflow variables. Each iteration reads the example_var variable and
generates a task. Each task contains one command that prints the variable's
value.
from datetime import datetime
from airflow import DAG
from airflow.operators.bash_operator import BashOperator
from airflow.models import Variable

default_args = {
    'owner': 'airflow',
    'depends_on_past': False,
    'start_date': datetime(2023, 2, 17),
    'retries': 0
}

dag = DAG(
    'dag_for_loop_airflow_variable',
    default_args=default_args,
    catchup=False,
    schedule_interval="@daily"
)

for i in range(1000):
    a = Variable.get('example_var', 'N/A')
    task = BashOperator(
        task_id=f'task_{i}',
        bash_command='echo variable foo=${foo_env}',
        dag=dag,
        env={'foo_env': a}
    )
Diagnose the parsing issues
DAG parse time is the amount of time it takes for the Airflow scheduler to read a DAG file and parse it. Before the Airflow scheduler can schedule any task from a DAG, the scheduler must parse the DAG file to discover the structure of the DAG and defined tasks.
If a DAG takes a long time to parse, this consumes the scheduler's capacity and might reduce the performance of DAG runs.
To monitor the DAG parse time:
Run the
dags reportAirflow CLI command in gcloud CLI to see the parse time for all your DAGs:gcloud composer environments run ENVIRONMENT_NAME \ --location LOCATION \ dags reportReplace the following:
ENVIRONMENT_NAME: the name of your environment.LOCATION: the region where the environment is located.
In the command's output, look for the duration value for the
dag_for_loop_airflow_variablesDAG. A large value might indicate that this DAG is not implemented in an optimal way. If you have multiple DAGs, from the output table, you can identify which DAGs have a long parsing time.Example:
file                | duration       | dag_num | task_num | dags
====================+================+=========+==========+=====================
/dag_for_loop_airfl | 0:00:14.773594 | 1       | 1000     | dag_for_loop_airflow
ow_variable.py      |                |         |          | _variable
/airflow_monitoring | 0:00:00.003035 | 1       | 1        | airflow_monitoring
.py
Inspect DAG parse times in Google Cloud console:
- In the Google Cloud console, go to the Environments page.
In the list of environments, click the name of your environment. The Environment details page opens.
Go to the Logs tab, then go to All logs > DAG processor manager.
Review
dag-processor-managerlogs and identify possible issues.
Figure 13. DAG processor manager logs show DAG parse times (click to enlarge)
If the total DAG parse time exceeds about 10 seconds, your schedulers might be overloaded with DAG parsing and cannot run DAGs effectively.
Optimize the DAG code
It is recommended to avoid unnecessary "top-level" Python code in your DAGs. DAGs with many imports, variables, and functions outside of the DAG introduce greater parse times for the Airflow scheduler. This reduces performance and scalability of Cloud Composer and Airflow. Excess of Airflow variables reading leads to long parsing time and high database load. If this code is in a DAG file, these functions execute on every scheduler heartbeat, which may be slow.
Airflow's template fields allow you to incorporate values from Airflow variables and Jinja templates into your DAGs. This prevents unnecessary function execution during scheduler heartbeats.
To implement the DAG example in a better way, avoid using Airflow variables at the top-level Python code of DAGs. Instead, pass Airflow variables to existing operators throguh a Jinja template, which will delay reading the value until the task execution.
Upload the new version of the sample DAG to your
environment. In this tutorial, this DAG is named
dag_for_loop_airflow_variable_optimized.
from datetime import datetime
from airflow import DAG
from airflow.operators.bash_operator import BashOperator

default_args = {
    'owner': 'airflow',
    'depends_on_past': False,
    'start_date': datetime(2023, 2, 17),
    'retries': 0
}

dag = DAG(
    'dag_for_loop_airflow_variable_optimized',
    default_args=default_args,
    catchup=False,
    schedule_interval='@daily'
)

for i in range(1000):
    task = BashOperator(
        task_id=f'bash_use_variable_good_{i}',
        bash_command='echo variable foo=${foo_env}',
        dag=dag,
        env={'foo_env': '{{ var.value.get("example_var") }}'},
    )
Inspect the new DAG parse time:
Wait until the DAG run is completed.
Run the
dags reportcommand again to see the parse time for all your DAGs:file | duration | dag_num | task_num | dags ====================+================+=========+==========+===================== /dag_for_loop_airfl | 0:00:37.000369 | 1 | 1000 | dag_for_loop_airflow ow_variable.py | | | | _variable /dag_for_loop_airfl | 0:00:01.109457 | 1 | 1000 | dag_for_loop_airflow ow_variable_optimiz | | | | _variable_optimized ed.py | | | | /airflow_monitoring | 0:00:00.040510 | 1 | 1 | airflow_monitoring .py | | | |Review
dag-processor-managerlogs again and analyze the parse duration.
Figure 14. DAG processor manager logs show DAG parse times after the DAG code was optimized (click to enlarge)
By replacing the environment variables with Airflow templates, you simplified the DAG code and reduced the parsing latency by about ten times.
Optimize Airflow environment configurations
The Airflow scheduler constantly tries to trigger new tasks and parses all DAGs in your environment bucket. If your DAGs have a long parsing time and the scheduler consumes a lot of resources, you can optimize Airflow scheduler configurations in order for the scheduler to use resources more efficiently.
In this tutorial, the DAG files take a lot of time to parse, and parsing cycles
start to overlap, which then exhausts the scheduler's capacity. In our example,
the first example DAG takes more than 5 seconds to parse, so you will configure
the scheduler to run less frequently to use resources more efficiently. You
will override the
scheduler_heartbeat_sec
Airflow configuration option. This configuration defines how often the
scheduler should run (in seconds). By default, the value is set to 5 seconds.
You can change this Airflow configuration option by
overriding it.
Override the scheduler_heartbeat_sec Airflow configuration option:
In the Google Cloud console, go to the Environments page.
In the list of environments, click the name of your environment. The Environment details page opens.
Go to the Airflow Configuration Overrides tab.
Click Edit, then click Add Airflow Configuration Override.
Override the Airflow configuration option:
Section Key Value schedulerscheduler_heartbeat_sec10Click Save and wait until the environment updates its configuration.
Check the scheduler metrics:
Go to the Monitoring tab and select Schedulers.
In the Scheduler heartbeat graph, click the More options button (three dots) and then click View in the Metrics Explorer.
On the graph, you will see the scheduler runs twice less frequently after you changed the default configuration from 5 seconds to 10 seconds. By reducing the frequency of heartbeats, you make sure that the scheduler does not start running while the previous parsing cycle is ongoing and the scheduler's resource capacity is not exhausted.
Assign more resources to the scheduler
In Cloud Composer 2, you can allocate more CPU and memory resources to the scheduler. In this way, you can increase the performance of your scheduler and accelerate parsing time for your DAG.
Allocate additional CPU and memory to the scheduler:
In the Google Cloud console, go to the Environments page.
In the list of environments, click the name of your environment. The Environment details page opens.
Go to the Environment configuration tab.
Find the Resources > Workloads configuration and click Edit.
In the Scheduler section, in the Memory field, specify the new memory limit. In this tutorial, use 4 GB.
In the CPU field, specify the new CPU limit. In this tutorial, use 2 vCPU.
Save the changes and allow several minutes for your Airflow schedulers to restart.
Go to the Logs tab, then go to All logs > DAG processor manager.
Review
dag-processor-managerlogs and compare the parse duration for the example DAGs: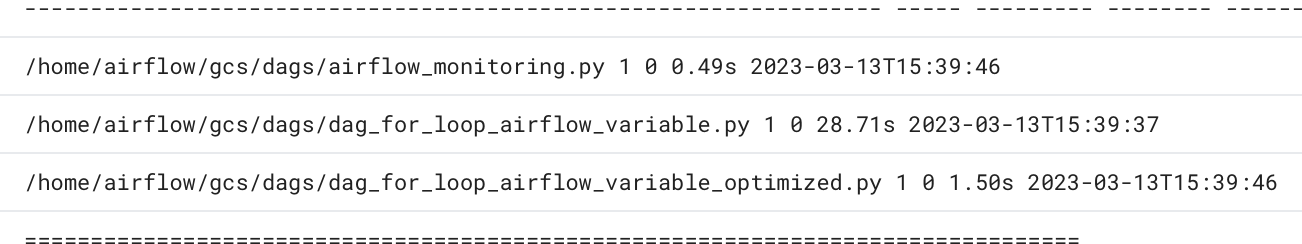
Figure 16. DAG processor manager logs show DAG parse times after more resources were assigned to the scheduler (click to enlarge)
By assigning more resources to the scheduler, you increased the scheduler's capacity and reduced the parsing latency significantly compared to the default environment configurations. With more resources, the scheduler can parse the DAGs faster, however, the costs associated with Cloud Composer resources will also increase. Additionally, it is not possible to increase the resources beyond a certain limit.
We recommend to allocate resources only after the possible DAG code and Airflow configuration optimizations were implemented.
Clean up
To avoid incurring charges to your Google Cloud account for the resources used in this tutorial, either delete the project that contains the resources or keep the project and delete the individual resources.
Delete the project
- In the Google Cloud console, go to the Manage resources page.
- In the project list, select the project that you want to delete, and then click Delete.
- In the dialog, type the project ID, and then click Shut down to delete the project.
Delete individual resources
If you plan to explore multiple tutorials and quickstarts, reusing projects can help you avoid exceeding project quota limits.
Delete the Cloud Composer environment. You also delete the environment's bucket during this procedure.