Getting to know Systems insights, a simplified database system monitoring tool
Mani HK
Product Designer, Google Cloud
Kaushal Agrawal
Product Designer, Google Cloud
A slow running database is hard to diagnose. When problems arise, database teams want to immediately understand what is causing the issue. Is the database experiencing resource saturation? If so, what is consuming resources — an application query or an operation initiated by Cloud SQL? Are there any new changes in the database? Are there any background tasks such as vacuum and backup operations? Answering these questions isn't easy. It requires investigating and correlating metrics from multiple different sources to understand the state of the system and pinpoint where the issue is.
To make this process a bit easier, we designed System insights.
System insights is a database system monitoring tool that brings together critical metrics, events, and logs to provide a comprehensive view of both the external database performance and the internal system resources. Bringing all the signals into a single dashboard allows you to quickly identify potential sources of problems without having to switch between tools. Right now, System insights is available for Cloud SQL for PostgreSQL and Spanner in GA and Cloud SQL for MySQL in preview.
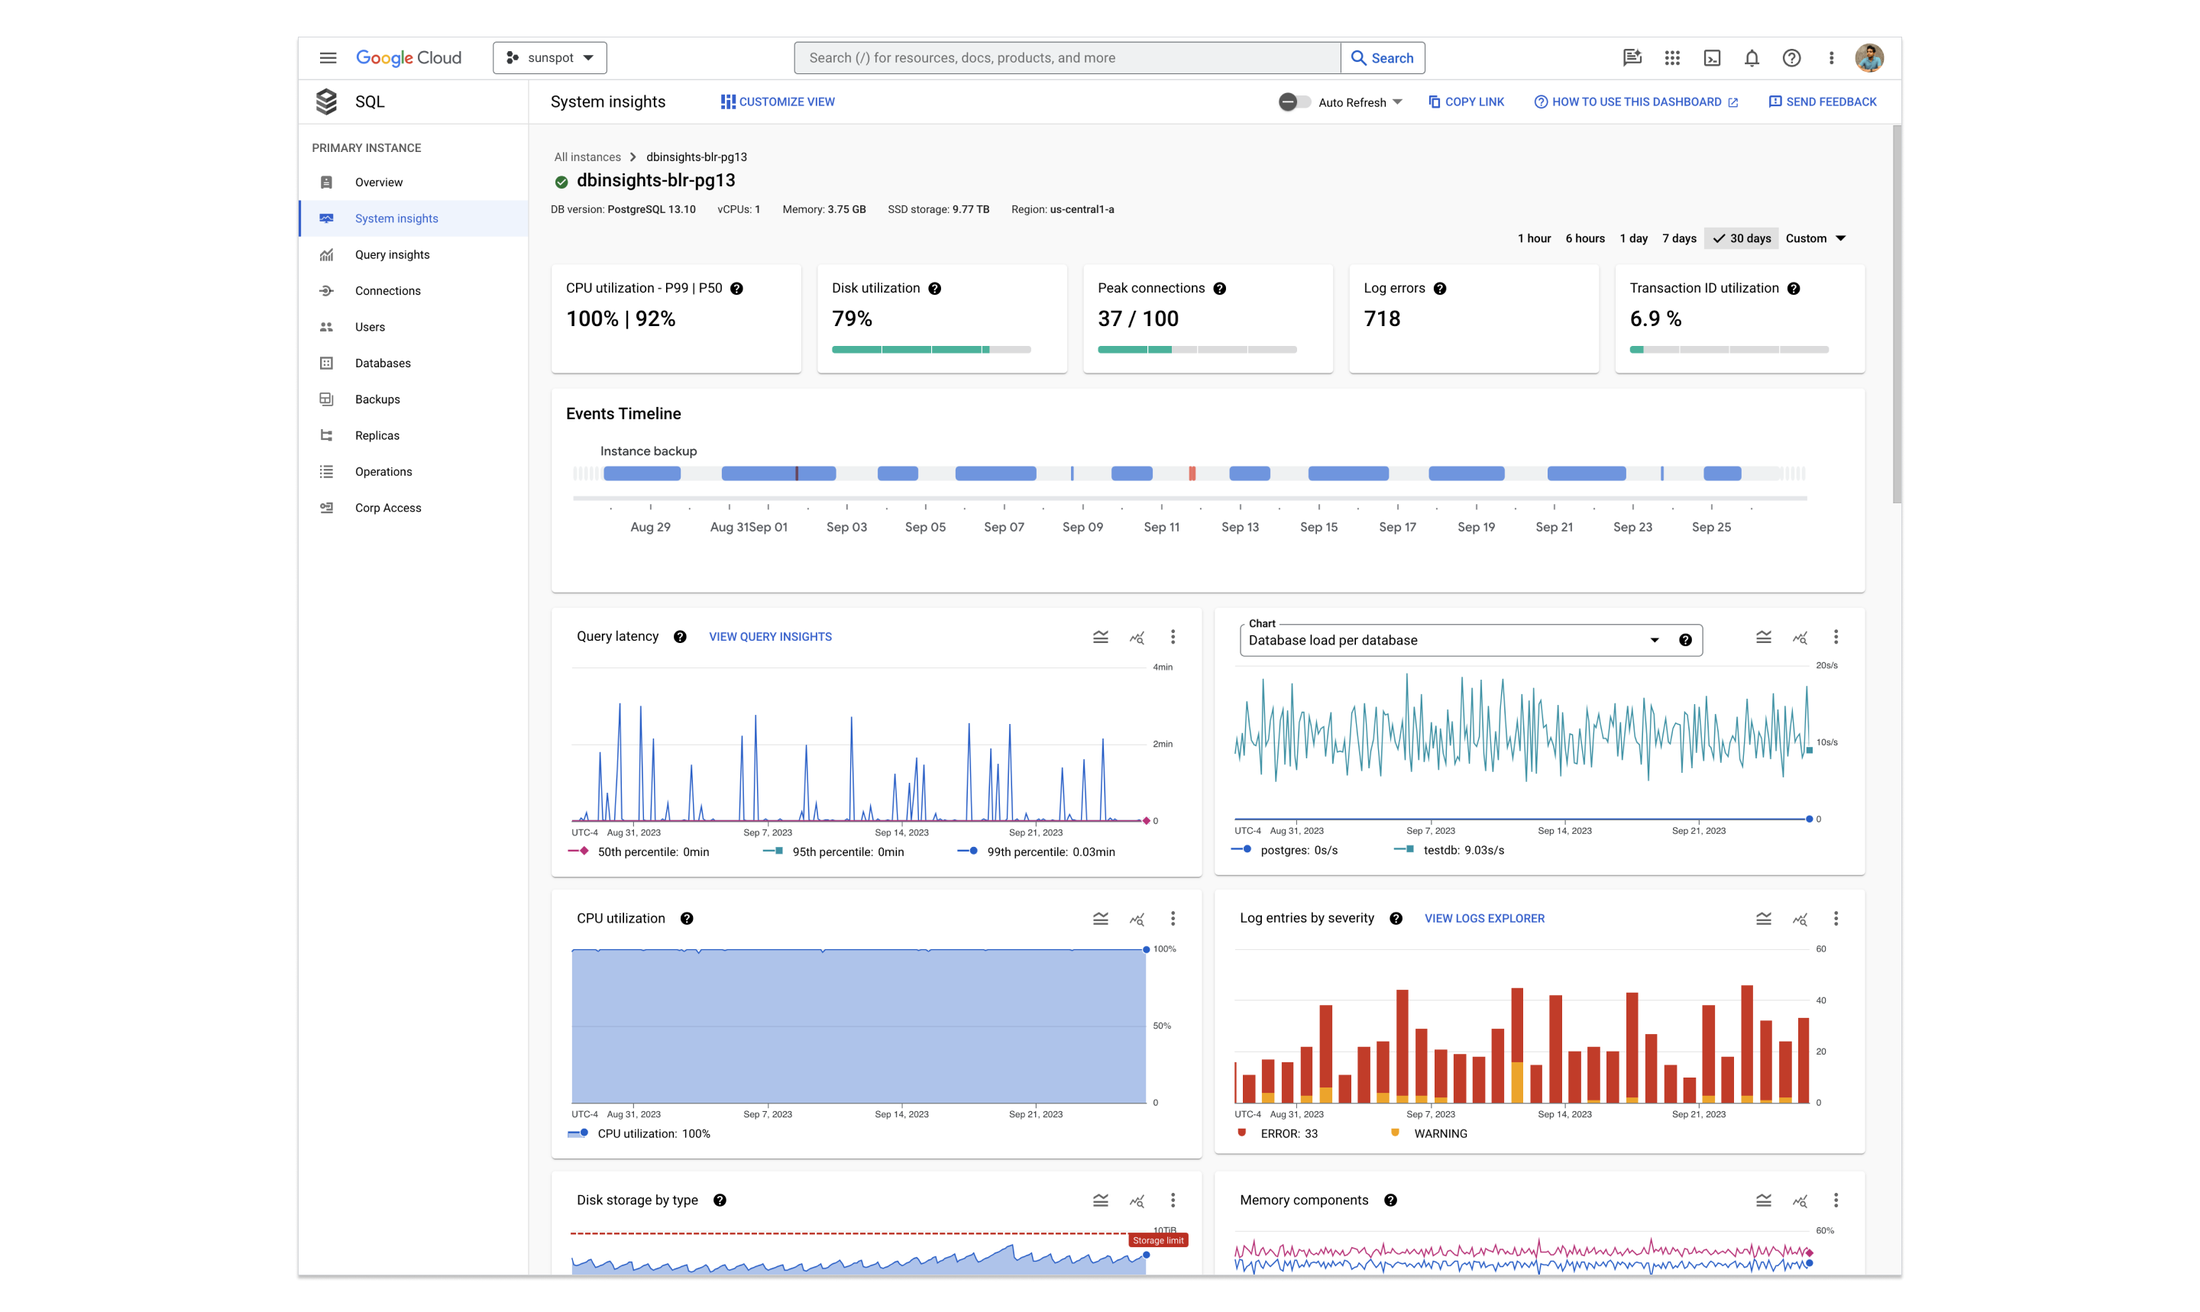
Fig 1: Cloud SQL System insights for PostgreSQL
Why design a new system monitoring tool?
Before System insights, users had two options for monitoring performance, both of which had significant user friction.
- Metrics on the instance overview page:
While metrics shown here are useful, the interface did not allow users to compare and correlate multiple metrics at the same time — a key feature for successfully troubleshooting a database problem. - Custom dashboards:
Some users set up custom monitoring dashboards, either within Google Cloud or using third-party tools like Grafana. This provides great flexibility, but presents a steep learning curve to get going. Perhaps most importantly, it doesn’t let you see everything you need in a central place.
System insights addresses both of these challenges with a pre-built dashboard with richer, customizable metrics. This reduces the barrier to entry for novice users and facilitates complex troubleshooting journeys for advanced users, all within the database console UI.
In this blog, we walk you through the key features of System insights and the design rationale behind each of them.
Quick snapshot of system status
At the top of the System insights page, you’ll see a snapshot of your system’s key resources and its current status — a quick visual check on any potential issues that you may need to investigate. The system configuration helps you understand how the system is performing relative to the resources that were originally provisioned.
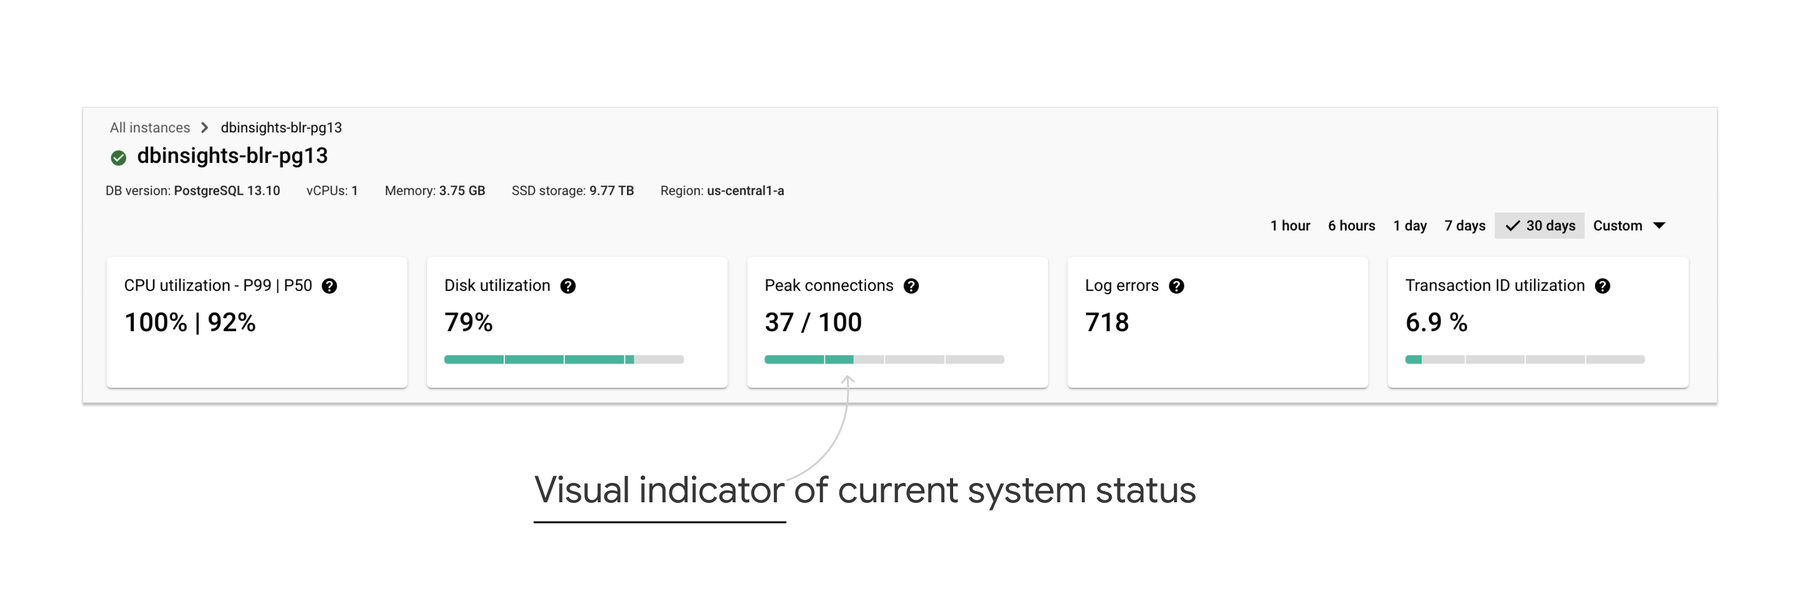
Fig 2: Snapshot of key system resources and their current status
Pre-built dashboard with actionable metrics
When designing system monitoring dashboards, we often run into the “problem of plenty” — there’s a wealth of metrics and data points to expose to users. How to decide on the right ones to surface? In Google Cloud, we cater to users with a wide range of database expertise and expectations. So, the key design challenge was to balance the needs of generalists and specialists.
We drew inspiration from observability frameworks such as RED (Rates, Errors, and Durations) and USE (Usage, Saturation, and Errors) and applied it to key system resources such as CPU, memory, active connections etc. This gives a comprehensive-yet-easily-digestible view of both the external and internal factors influencing database throughput. Within each metric, special attention is given to the way it is represented to make the underlying causes of behavior more readily identifiable. For example, disk storage is shown with a breakdown of data, logs and others, to clearly indicate which aspect of the disk is contributing to the increasing storage utilization.
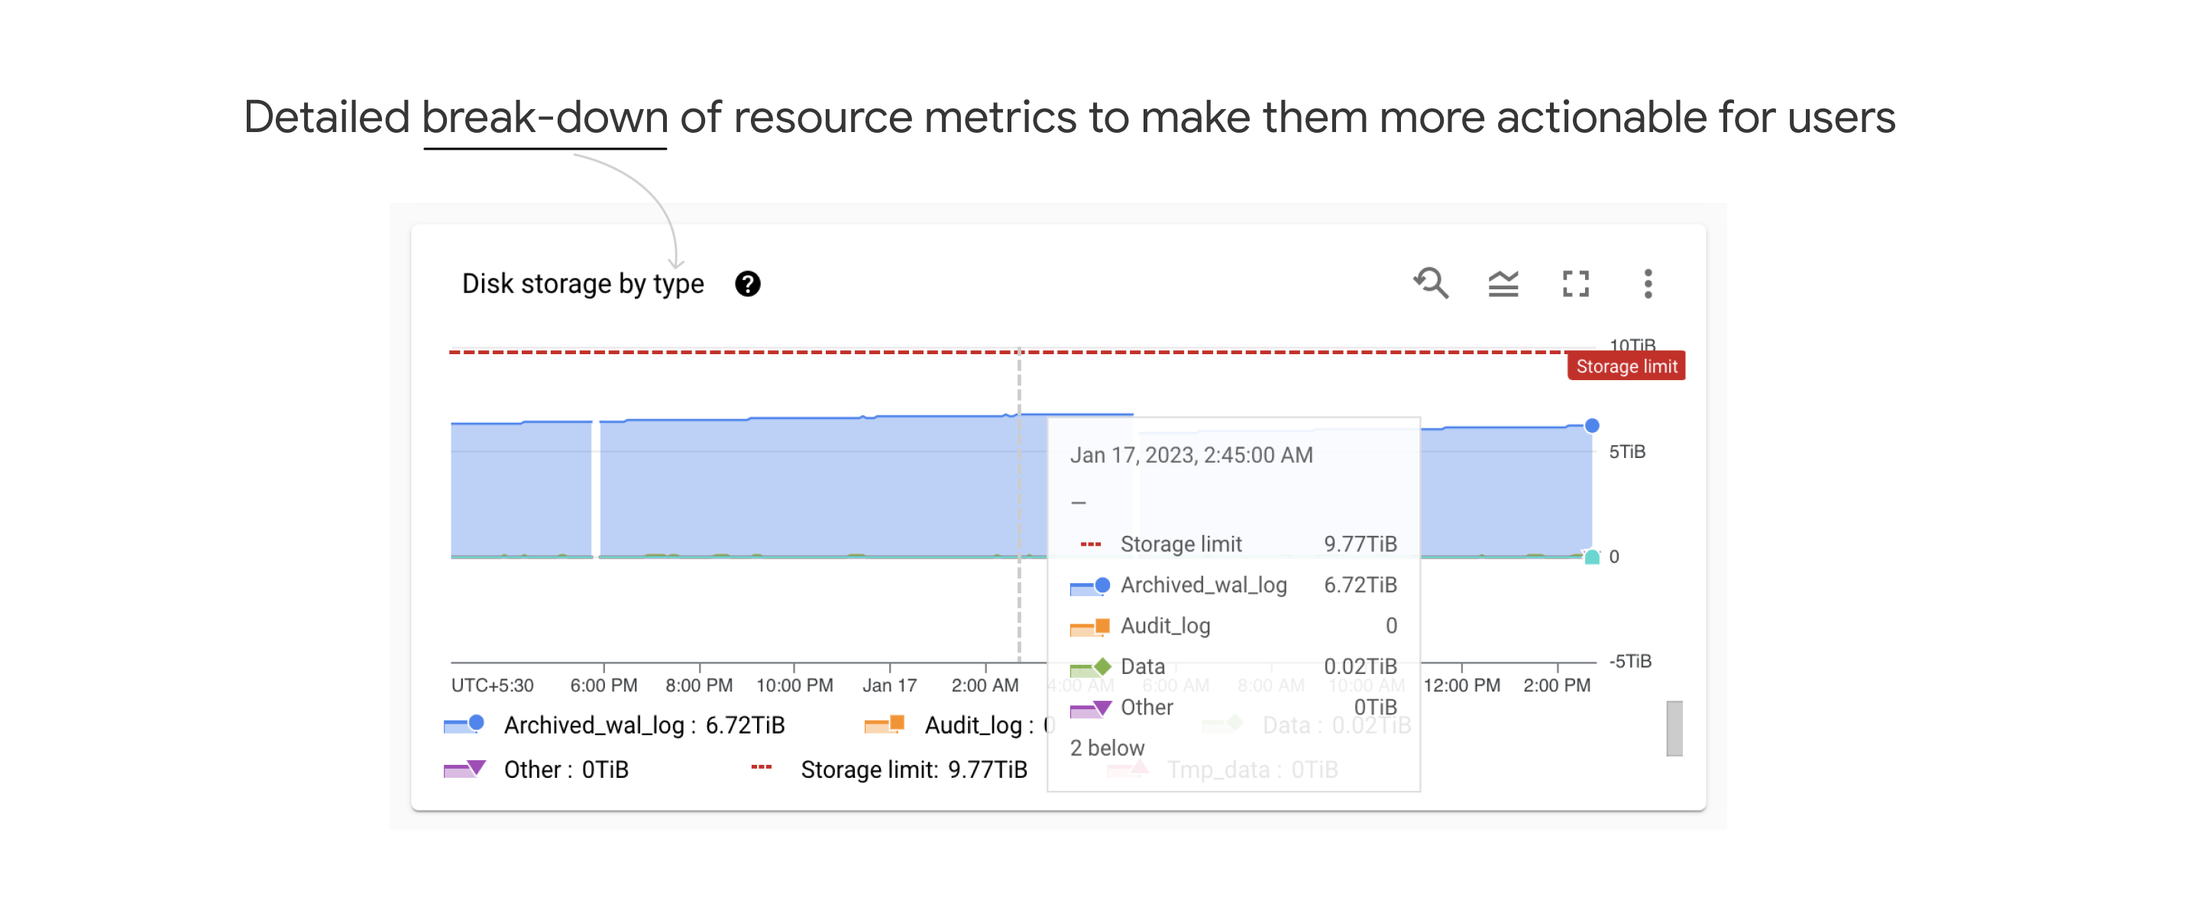
Fig 3: Break-down of disk storage by type
Also, wherever possible, saturation limit lines are shown on resource utilization graphs. For metrics like CPU or memory, utilization percentage intuitively communicates saturation. However, the saturation limit for metrics like active connections is not straightforward. So, in such cases, based on the user’s current system configuration, we show a computed saturation limit to make it complete and actionable for users.
Correlation beyond metrics
To troubleshoot a database problem successfully, users often go beyond metrics and look into logs and system events. For example, a slow-running query without a proper index can create a long lock wait, resulting in increased error rates or CPU utilization, even if there is no change in the external workload. And it is not easy to understand the ‘why’ behind such behaviors just by looking at metrics. A trained database specialist will use a cloud logging tool along with system monitoring to see if there are any system events that coincide with a resource anomaly. This process involves not only switching between multiple tools, but also extracting fine-grained information from an ocean of logs that are not human-friendly to begin with.
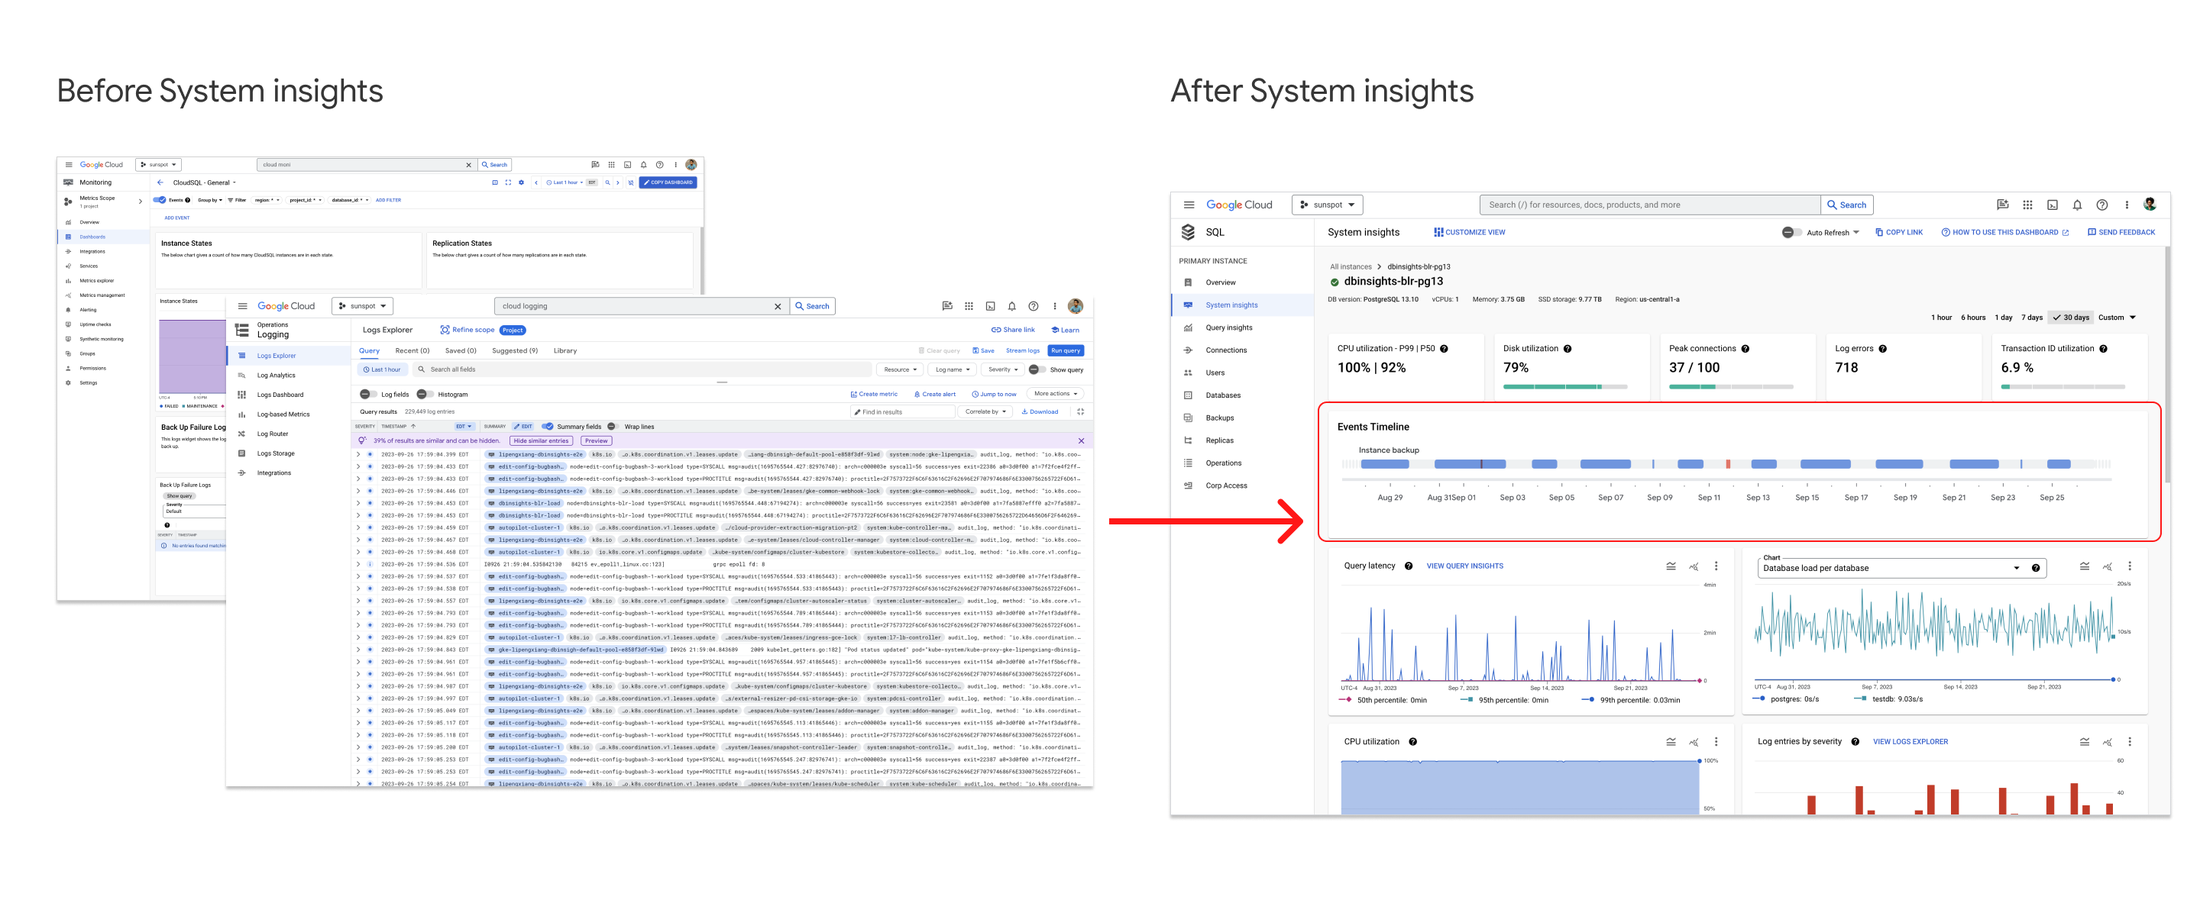
Fig 4: Events timeline brings metrics and logs together
With System insights, we simplified this journey for users. Instead of expecting users to maneuver between multiple tools, we integrated events into the System insights dashboard. Key system operations are filtered from cloud logs and presented to users as a visual timeline, referred to as the ‘events timeline’. It’s a dynamic experience that allows users to naturally scroll through time and correlate metrics with system events.
Customizable views for specialist use cases
The dashboard defaults are a great starting point for most users. But for those who need more control over what metrics to monitor, we also provide customizable views. Users can add to the default selection of metrics, or choose a specific set of metrics that are more relevant to them. As System insights continues to expand its telemetry coverage and adds more dimensions to customize, this feature will address more of the needs of database specialists without making the default experience daunting for generalists.
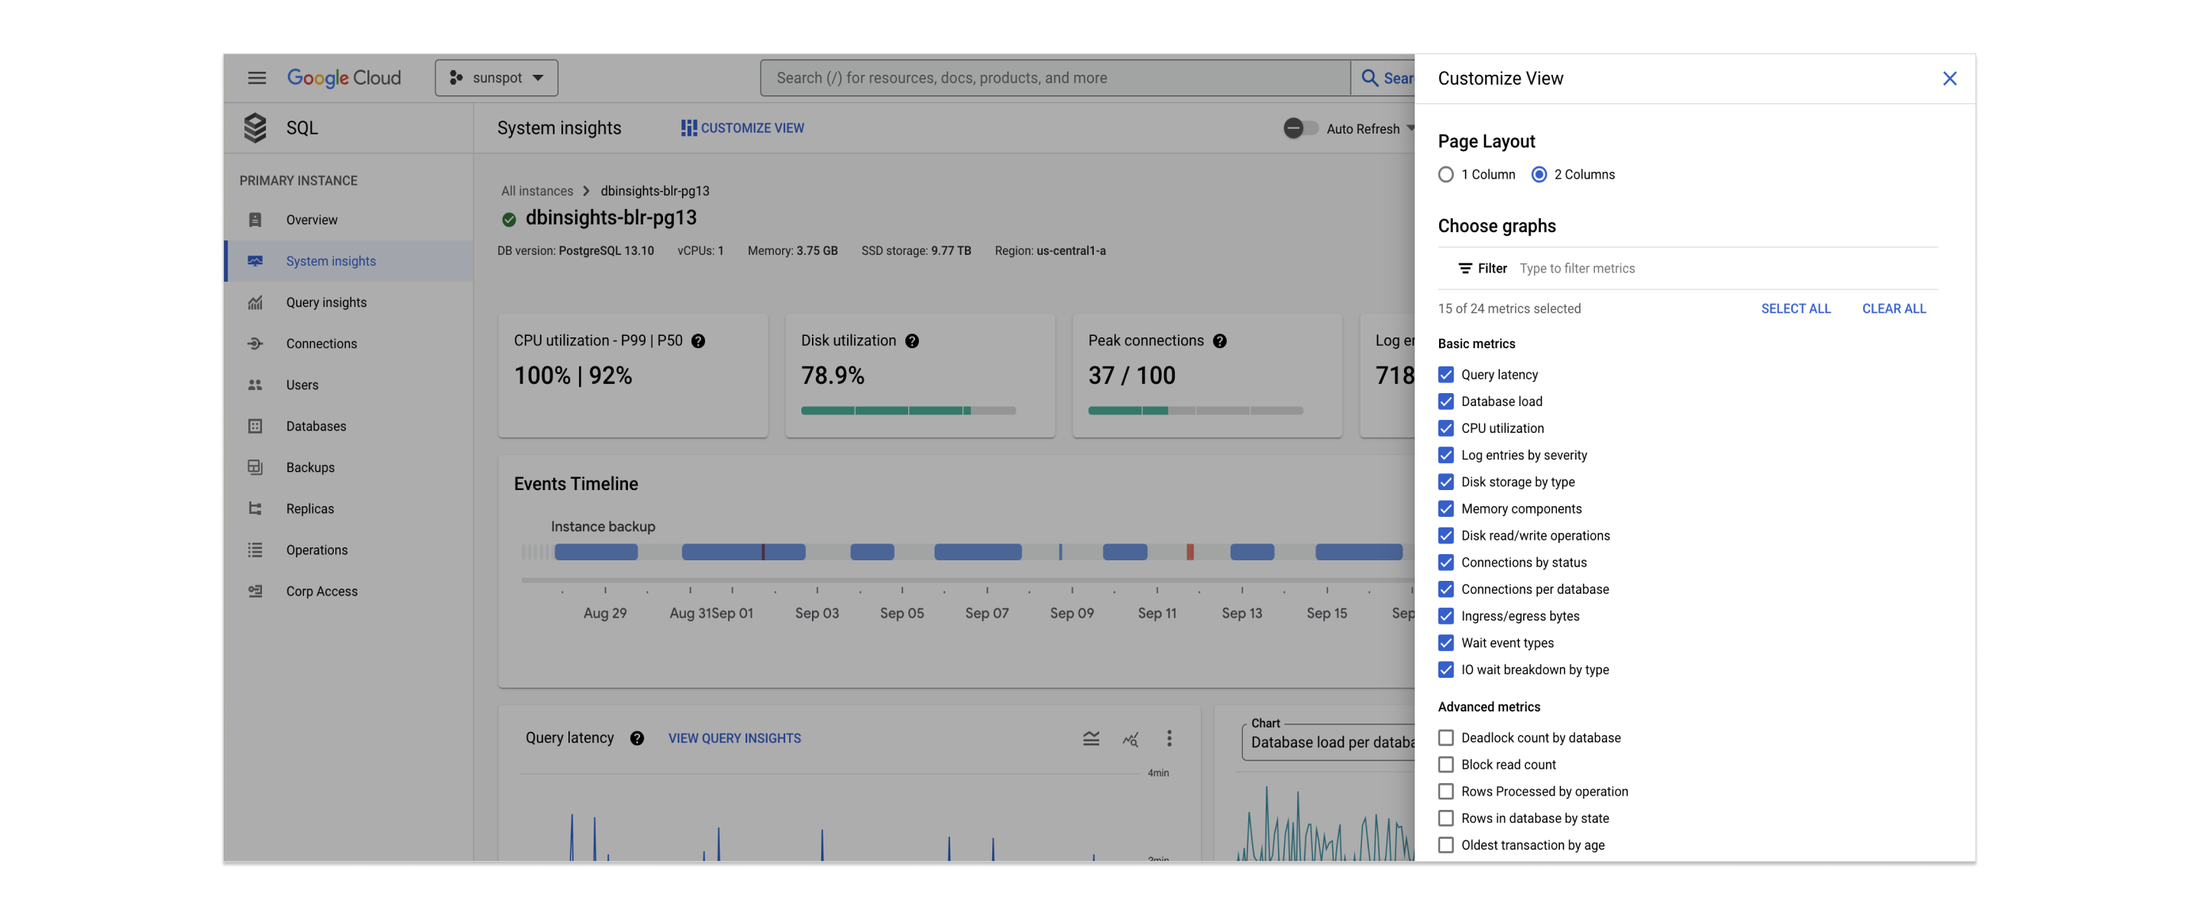
Fig 5: Customisable views
To summarize, no matter where you are in your database system observability journey, System insights provides an easy to use starting point for generalists as well as provides customisable views for specialist use cases.
What next?
Our observability strategy is to build on a foundation of telemetry depth and ease of use. This effort began with Query Insights, a tool that helps developers fix query inefficiencies through visual query plans and latency analysis. In 2022, we launched proactive database wellness recommenders to help you increase the security, performance, reliability, and cost efficiency of your Cloud SQL fleet. Now, System insights extends that capability to system resource monitoring and troubleshooting.
We are actively working on improving complex troubleshooting journeys. Stay tuned for more!