| title | description | author | tags | date_published |
|---|---|---|---|---|
Learn Google Kubernetes Engine networking fundamentals with hands-on exercises |
Learn from first principles how pod networking operates in Google Kubernetes Engine. |
bernieongewe |
Google Kubernetes Engine, Kubernetes |
2019-05-31 |
Bernie Ongewe | Technical Solutions Engineer | Google
Contributed by Google employees.
The goal of the exercises below is to develop hands-on familiarity with how the container networks are connected in Google Kubernetes Engine (GKE). With this knowledge, you will be better able to troubleshoot networking issues.
- This document is current for all versions of Google Kubernetes Engine at the time of publication or refresh.
- This document assume that network policy enforcement is not enabled for the cluster. Enabling network policy enforcement changes how pod networking operates.
This tutorial uses billable components of Google Cloud Platform (GCP), including the following:
- Google Kubernetes Engine (GKE)
- Cloud Load Balancing
Use the Pricing Calculator to generate a cost estimate based on your projected usage.
-
Create or select a Google Cloud project on the Manage resources page of the Cloud Console.
-
Enable billing for your project.
For details, see Enable billing for a project.
-
Enable the GKE and Resource Manager APIs.
Click this link to go to the Cloud Console and enable the APIs.
This document includes four exercises:
- Exercise 1: "Introduction to network namespaces" introduces Linux virtual network devices. In this exercise, you configure devices, connect them, and configure the iptables rules that facilitate connectivity. This exercise also introduces techniques for interrogating the connection states.
- Exercise 2: "Introduction to GKE networking" explains the creation of a simple HTTP service in GKE. Using the techniques you learned in the previous exercise, you rerun captures.
- Exercise 3: "GCP load balancing and GKE" introduces the ingress controller as implemented by GKE, building on the load balancer service from the previous exercise.
- Exercise 4: "Visiting namespaces in GKE" demonstrates how to visit a pod's namespace directly.
This first exercise introduces virtual networking concepts that are important to understand before diving into GKE networking.
We'll look at Linux virtual networking devices and how these are configured to build a virtual network within a host.
Visit your project at https://console.cloud.google.com, launch and SSH into a standard Debian instance with a public IP. We will need to install some packages:
sudo apt update -y
sudo apt install -y bridge-utils # Install Linux Bridge Tools.
sudo apt install -y tcpdump
sudo apt install -y screen
sudo apt install  -y conntrack #Tool to interrogate connection tracking table
PATH=$PATH:/sbin # Get brctl in your path (you may include this in your .profile)
List your networking devices:
ip address show
You should see eth0 and the loopback device lo. No surprises here.
Create virtual devices, tap0 and tap1 and see how they appear:
sudo ip tuntap add tap0 mode tap
sudo ip tuntap add tap1 mode tap
ip address show
These aren't used in GKE, but we include them here to drive the discussion. To begin to understand how they might be used, visit the Linux documentation for Universal TUN/TAP device driver.
We just created two virtual network devices. We can assign IP addresses, ping them, and so on, just like regular Ethernet ports. However, in their current state, they don't do much since they aren't connected to anything.
Let's now create a virtual bridge and issue some commands on it that will help us to understand what it does.
First, add a virtual bridge called cbr0:
sudo brctl addbr cbr0
This now shows up in the list of devices:
ip address show
We can bring it up just as we would any other interface and assign an IP address to it:
sudo ip link set dev cbr0 up
sudo ip address add  192.168.255.1/24 dev cbr0
ip address show
ping 192.168.255.1
Let's add the ports we just created to cbr0:
sudo brctl addif cbr0 tap0
sudo brctl addif cbr0 tap1
sudo brctl show cbr0
We created a virtual bridge and connected two of the ports to it. This behaves like a regular Ethernet switch,
providing connectivity between attached devices, in this case tap0 and tap1.
This is what the environment looks like now:

View other brctl commands:
sudo brctl -h
Let's now consider network namespaces. Similarly, we'll create one and issue commands against it that help us to understand what network namespaces do for us.
For now, let's take a look at the configured network namespaces. There shouldn't be any:
sudo ip netns list
Now, let's add a namespace called demo-ns and check to see that it's in the list of available namespaces:
sudo ip netns add demo-ns
sudo ip netns list
A network namespace is a segregated network environment, complete with its own network stack. To see this, start bash in
our new namespace and look for interfaces that it knows about:
sudo ip netns exec demo-ns bash
ip address show
ip route show
Attempt to to ping cbr0:
ping 192.168.255.1
From this namespace, we can only see a local loopback interface. We can no longer see or ping eth0 or cbr0.
Furthermore, since we don't have any other networking devices in this namespace, we have no routes to anywhere. However, we can still perform all of the system tasks we're used to, including bringing up and pinging virtual network devices and machines.
Already, we can see how this will be crucial for tenant isolation; it allows us to raise, for example, namespaces ns-1 and
ns-2, which host pods pod-1 and pod-2, respectively. By default, pod-1 and pod-2 will be completely isolated
from each other and the outside world.
This isn't useful in itself. Ultimately, namespaced pods still need to be able to access the outside world. The key is that we make deliberate choices on how to deliver this connectivity. This is where the virtual bridge comes in, as well as another type of virtual networking device.
Let's exit out to the default namespace and create another type of a virtual device.
Exit out of the demo-ns namespace:
exit
Confirm that you can see the interfaces in the default namespace:
ip address show
Create veth0 and veth1, paired to each other:
sudo ip link add veth0 type veth peer name veth1
Raise both interfaces:
sudo ifconfig veth0 up
sudo ifconfig veth1 up
Observe how their relationship is displayed:
ip address show
Observe that the new devices are listed as veth0@veth1 and veth1@veth0.
We may think of this relationship as a pipe or virtual wire; whatever enters one end exits the other. Let's see how we can
use this to provide access to the demo-ns namespace from the outside world.
First, we attach veth0 to the bridge:
sudo brctl addif cbr0 veth0
Observe that cbr0 now has veth0 also listed as an interface:
sudo brctl show
Now let's move veth1 to the demo-ns namespace.
sudo ip link set veth1 netns demo-ns
Observe that veth1 has now disappeared from the default namespace:
ip address show
Let's head back into demo-ns:
sudo ip netns exec demo-ns bash
View network interfaces:
ip address show
Observe that veth1, the other end of the virtual wire, is not in here. Generally, this end will be attached to a pod and
its IP address will be allocated and configured by GKE. However, for this demonstration, we can assign an IP address
directly to it. Let's assign it an address in the same subnet as cbr0 and make sure that veth1 and lo are up:
sudo ip netns exec demo-ns bash  # switch to the namespace
sudo ip address add 192.168.255.2/24 dev veth1
sudo ifconfig veth1 up
sudo ifconfig lo up
Observe that we can now ping not just veth1 but also cbr0 which we can't even see from here:
ping 192.168.255.2
ping 192.168.255.1
Let's understand how the connectivity looks from the namespace's layer 2 perspective. Confirm that, from demo-ns, the
MAC address of192.168.255.1 is learned over veth1. This is expected:
sudo arp
Now exit out to the default namespace and confirm that, from there, 192.168.255.2's MAC address is similarly learned
over cbr0:
exit
sudo arp
Furthermore, demonstrate that this MAC address is in the bridge's forwarding database:
sudo brctl showmacs cbr0
We should be able to see 192.168.255.2's MAC address with a non-zero aging timer (assuming we stopped the ping less
than five minutes ago).
This is the environment we just brought up:
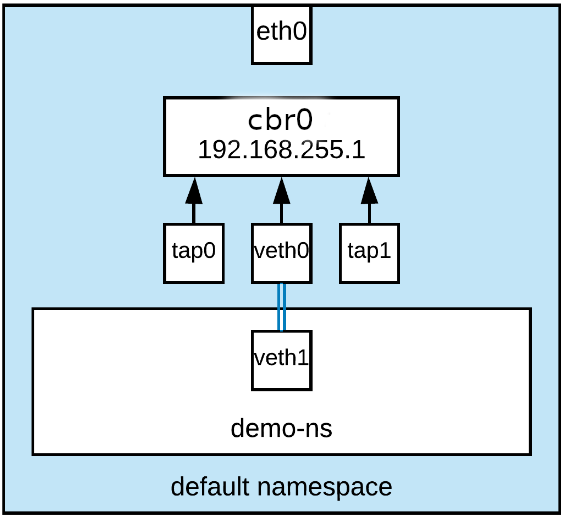
Let's stop and consider what we've just done:
- We’ve created a new network namespace (
demo-ns) and demonstrated that it's completely isolated from the default namespace. - We’ve created a pair of network devices, which behave like opposite ends of a virtual wire.
- We’ve attached one end of the wire (
veth0) to a virtual bridge in the default namespace. - We’ve moved the opposite end of this wire (
veth1) to thedemo-nsnamespace and supplied it with an IP address in the same subnet ascbr0. - We’ve demonstrated that we could now reach across namespaces using this virtual wire.
Now that we've given demo-ns access to the default namespace, we can go ahead and give it access to the outside world.
Recall that the host has its own IP address, so we will have to accommodate this somehow.
Let's start a virtual terminal session so we follow packets between namespaces.
First, open a screen session we shall call vterm-demo:
screen -S vterm-demo
Within this session, enter the demo-ns namespace:
sudo ip netns exec demo-ns bash
Try to ping Google's public DNS server:
ping 8.8.8.8
Why are we unsuccessful? What error do we get?
Check the routes that this namespace knows about:
netstat -rn
Observe that we have no route out of the namespace, so we don't know how to get to 8.8.8.8 from here.
Add a default route through 192.168.255.1(cbr0), then start a ping to Google's public DNS:
sudo route add -net 0.0.0.0/0 gw 192.168.255.1
ping 8.8.8.8
Observe that we still get no response.
Do we get an error now? What do we still have to do?
Leave the ping running, and exit out of the screen session:
CTRL+A, Z
Confirm that vterm-demo is still running and detached:
screen -list
Confirm that the ping is still running and that both veth0 and cbr0 can see the ICMP packets in the default
namespace:
sudo tcpdump -ni veth0  icmp -c 4
sudo tcpdump -ni cbr0  icmp -c 4
Now check whether eth0 can see the ICMP packets:
sudo tcpdump -ni eth0 icmp -c 4
Why are we able to see the packets at the bridge but not at eth0? This is because Linux, by default, doesn't forward
packets between interfaces.
Turn forwarding on:
sudo sysctl net.ipv4.conf.all.forwarding=1
Now run tcpdump against eth0 again.
sudo tcpdump -ni eth0 icmp -c 4
We now see packets from 192.168.255.2 to 8.8.8.8 but no responses coming back.
Why don't we see responses coming back from 8.8.8.8? This is because the rest of the VPC's routing doesn't know how to
get back to 192.168.255.2. Later, we fix this with secondary IP ranges.
For now, let's make all outgoing packets from the host look like they're coming from the host's eth0 IP address.
Install a masquerade rule that does this:
sudo iptables -t nat -A POSTROUTING -o eth0 -j MASQUERADE
Sniff eth0 again:
sudo tcpdump -ni eth0 icmp
Why didn't this change anything? This is because iptables applies new rules to new flows and leaves ongoing flows
alone. Since we didn't stop the ping, that flow is still ongoing. Let's see how it looks with conntrack:
$ sudo conntrack -L |grep 8.8.8.8
icmp     1 29 src=192.168.255.2 dst=8.8.8.8 type=8 code=0 id=24606 [UNREPLIED] src=8.8.8.8 dst=192.168.255.2 type=0 code=0 id=24606 mark=0 use=2
conntrack v1.4.4 (conntrack-tools): 38 flow entries have been shown.
We include the output here to draw attention to the fact that there's still an outbound flow from 192.168.255.2
to 8.8.8.8 with no replies.
By default, conntrack entries age out ICMP flows after 5 seconds.
Reconnect to the vterm-demo terminal session:
screen -r vterm-demo
Press CTRL+C to stop the ping, wait at least five seconds, and then restart the ping:
ping 8.8.8.8
Observe that we're now getting ping responses. Can you tell why?
Exit the terminal session:
CTRL+A, Z
In the default namespace, capture a few ICMP packets from the respective interfaces:
sudo tcpdump -ni veth0 icmp -c 4
sudo tcpdump -ni cbr0 icmp -c 4
sudo tcpdump -ni eth0 icmp -c 4
Take a very close look at the IP addresses.
Notice that the source IP on eth0 is no longer 192.168.255.2 but the eth0 IP address.
Let's take another look at how this flow looks in conntrack:
sudo conntrack -L |grep 8.8.8.8
Sample output:
conntrack v1.4.4 (conntrack-tools): 38 flow entries have been shown.
icmp     1 29 src=192.168.255.2 dst=8.8.8.8 type=8 code=0 id=24853 src=8.8.8.8 dst=10.142.0.2 type=0 code=0 id=24853 mark=0 use=1
Note how the translation to 10.142.0.2 in the case above (yours might be different) is represented.
Look at other conntrack options:
sudo conntrack -h
Rather than jumping into the demo-ns namespace to stop the ping and age out the conntrack entry, how might we have
deleted it from the conntrack table?
How might this be valuable in troubleshooting?
sudo conntrack -D -s 192.168.255.2
In this exercise, we've introduced the salient components of container networking. Further along, you'll find that Kubernetes just combines these in more elaborate ways.
Once you're satisfied with what you've learned, you may log out and terminate the instance and proceed to Exercise 2.
Click the Activate Cloud Shell button at the top of the GCP Console to start a Cloud Shell session, and confirm that a project that you want to use is set for this session:
Welcome to Cloud Shell! Type "help" to get started.
Your Cloud Platform project in this session is set to [YOUR PROJECT ID]
and:
echo $DEVSHELL_PROJECT_ID
Set the project and zone you'll work from:
gcloud config set compute/zone $COMPUTE_ZONE
Create a Kubernetes cluster called lab-cluster:
gcloud container clusters create lab-cluster
Configure kubectl to use this cluster (this creates credentials in ~/.kube/config):
gcloud container clusters get-credentials lab-cluster
Describe the cluster:
gcloud container clusters describe lab-cluster
Note that it has three nodes by default. Use kubectl to describe the nodes:
kubectl get nodes
Run a deployment called hello-server on this cluster. We'll use a demo web server image from the registry and
launch this on container port 8080.
Create a file named hello-server-deployment.yaml and copy the following into it:
apiVersion: apps/v1
kind: Deployment
metadata:
  name: hello-server
spec:
  replicas: 1
  selector:
    matchLabels:
      app: hello-server
  template:
    metadata:
      labels:
        app: hello-server
    spec:
      containers:
      - name: hello-server
        image: gcr.io/google-samples/hello-app:1.0
        ports:
        - containerPort: 8080
Apply the file to the cluster:
kubectl apply -f hello-server-deployment.yaml
Recall that a namespace is created for these pods. Use SSH to connect to the node hosting the pod to see how these look:
sudo ip netns list
We were just assured that pods are launched in Linux network namespaces. Why don't we see them here?
Unfortunately, Kubernetes doesn't register the network namespace in a way that it is visible by the ip netns command. We
can track down the namespace and visit it by PID. If it interests you, there is a walkthrough of this in Exercise 4, at the
end of this document.
In general, however, we should never have to visit the network namespace, since we can get all of the networking information from the pod itself.
Patch the deployment to include network administrator capabilities within the container:
kubectl patch deployment hello-server --patch '{ "spec": { "template": { "spec": { "containers": [ { "name": "hello-server", "securityContext": { "capabilities": { "add": ["NET_ADMIN"] } } } ] } } } }'
From kubectl, let's get the name of the pod, then start a shell within and look at the same network information. Exit
once you're convinced that it's all the same information we'd see from the underlying namespace:
kubectl get pods
export PODNAME=`kubectl get pods -o=jsonpath='{.items[0].metadata.name}'`
kubectl exec -it $PODNAME -- /bin/sh
ip address show
ip route show
apk update
apk add iptables
apk add sudo
sudo iptables -L
sudo iptables -L -tnat
exit
This is how one of the nodes on the cluster might look. Its peers are largely identical except for a varying number of pods and namespaces, depending on pod placement.

The rest of this exercise extends our work with iptables to help understand how all the pods are reachable.
This is a good time to familiarize yourself with the kubectl command:
From the default namespace on the node, try to ping any address.
What result did you get?
GKE instances are lightweight container-optimized images. As such, a lot of the commands you rely on for troubleshooting
may be missing. To perform general troubleshooting, we use the toolbox container launched in the default namespace. This
is approached with the toolbox command.
Look at some toolbox options:
sudo toolbox -h
The first time you invoke this, the container image will be downloaded from the repository.
Note: Take note of the advice to "Press ^] three times within 1s to kill container."
Confirm that this container is running in the default network namespace:
sudo toolbox ip address show
A lot of network troubleshooting options not available on the node are accessible in the toolbox container.
Send three pings to localhost from toolbox:
sudo toolbox ping 127.0.0.1 -c 3
Invoke bash in the container, and then install tcpdump and conntrack before exiting:
sudo toolbox bash
apt install -y tcpdump
apt install -y conntrack
apt install -y screen
exit
Now, going back and forth between the hello-server shell (the shell you entered with kubectl exec in a previous step)
and the toolbox shell, use ping, ip address show, ip route show, sudo brctl show, and sudo brctl showmacs cbr0
to get an understanding of how we might answer the following types of questions:
- Which bridge in the host's default namespace is the pod attached to?
- Which port on the bridge is the pod's MAC address learned on?
- What is each namespace's next hop to the other?
First, confirm that the web server is still running on port 8080 on the container and accessible from the node:
curl $CONTAINERIP:8080
By now, we should understand how the node is able to get to the container. (Hint: ip route show).
It's encouraging that we can do this from the node, but we need to expose the service to the outside world. We already have
a hint from the previous exercise that we can do this with iptables. Rather than install and maintain those rules
ourselves, we let Kubernetes do so.
Using kubectl in Cloud Shell, use the following command to install rules that forward port 80 on the node to
service port 8080:
kubectl expose deployment hello-server --type LoadBalancer \
  --port 80 --target-port 8080
Take a look at the effect of this from the node's perspective. First, look at the associated log entry:
sudo tail /var/log/kube-proxy.log
I0714 19:46:00.458616       1 proxier.go:329] Adding new service port "default/hello-server:" at 10.43.246.223:80/TCP
I0714 19:46:00.475799       1 proxier.go:1754] Opened local port "nodePort for default/hello-server:" (:31830/tcp)
I0714 19:46:50.399071       1 proxier.go:331] Updating existing service port "default/hello-server:" at 10.43.246.223:80/TCP
Here again, we include sample output so that we see the log entry associated with the new service
(10.43.246.223:80 in this example above).
Generally, however, we'd get the service IP address from kubectl. Here again, we include sample output to drive the
discussion.
kubectl get service hello-server
NAME           TYPE           CLUSTER-IP      EXTERNAL-IP     PORT(S)        AGE
hello-server   LoadBalancer   10.43.246.223   35.231.121.11   80:31830/TCP   5h
We see more detail with the describe sub-command:
kubectl describe service hello-server
Name:                     hello-server
Namespace:                default
Labels:                   run=hello-server
Annotations:              <none>
Selector:                 run=hello-server
Type:                     LoadBalancer
IP:                       10.43.246.223
LoadBalancer Ingress:     35.231.121.11
Port:                     <unset>  80/TCP
TargetPort:               8080/TCP
NodePort:                 <unset>  31830/TCP
Endpoints:                10.40.0.6:8080
Session Affinity:         None
External Traffic Policy:  Cluster
Events:                   <none>
Find the node(s) on which the endpoint is hosted:
kubectl get pods -o wide
NAME                            READY     STATUS    RESTARTS   AGE       IP          NODE
hello-server-579859fb5b-szrwh   1/1       Running   0          5d        10.40.0.6   gke-lab-cluster-default-pool-9e4ce61e-2jdh
Now get NodeIP, the IP address of this node:
kubectl describe node gke-lab-cluster-default-pool-9e4ce61e-2jdh \
| grep -A 2 Addresses
Addresses:
  InternalIP:  10.142.0.8
  ExternalIP:  35.231.173.178
Take note of the various IP addresses and ports. In the example given:
IP=10.43.246.223 (service IP address)
EndPoint=10.40.0.6
NodeIP=10.142.0.8
NodePort=31380
ExternalIP=35.231.121.11
On any node, confirm that the service is available at the service IP address (10.43.246.223 above):
curl $SERVICEIP
On any node, also confirm that the pod endpoints are available (10.40.0.6 above):
curl $Endpoint:8080
On any node, also confirm that we can reach the service on NodePort (31830 above) of any other node:
curl $OtherNodeIP:$NodePort
We can now briefly open up GCP firewall rules that allow us to reach the service by its public IP address and $NodePort.
Go ahead and do this.
Confirm that this is because kube-proxy is listening on NodePort:
sudo netstat -tnlp |grep $NodePort
Look at the iptables entries that contribute to this mesh of availability:
sudo iptables -L
sudo iptables -L -tnat
In the next section, we follow packets around and do a detailed walkthrough of the configuration elements that deliver this.
To get a quick feel for some of the tasks involved in this, visit the toolbox container on a node pod and look at a
tcpdump of traffic filtered for all of these IP addresses:
sudo toolbox tcpdump -ni any \
 '(port 80 or port 8080 or port $NodePort)' and \
 '(host $Endpoints or host $IP or host $LoadBalancer)'
Using the values from the example above:
sudo toolbox tcpdump -ni any \
 '(port 80 or port 8080 or port 31380)' and \
 '(host 10.40.0.6 or host 10.43.246.223 or host 35.231.121.11)'
Open a browser session to http://$Loadbalancer and watch the tcpdump output.
Pay attention to the transformation of IP addresses and ports from the node's perspective versus the configuration we just looked at. You will understand what's happening by the end of the document.
In this section, we'll look at the details of the curl commands we just issued and try to understand the exact
configuration elements that facilitate connectivity in each case. Again, we'll provide examples of the output to drive the
explanations.
In this example the node IP addresses are as follows:
10.142.0.610.142.0.710.142.0.8
We found that the container is hosted on 10.142.0.8.
First, let's try to understand why any node can reach the service on NodeIP:NodePort on the node hosting the container.
The example below uses two nodes:
10.142.0.8: Hosts the container with the endpoint, in this case10.40.0.6:808010.142.0.6: Access the service by connecting to10.142.0.8:31830
We'll be doing a lot of this from the toolbox container on each.
Start bash in the toolbox container on both nodes. We'll be doing a lot of this section from there:
sudo toolbox bash
Start a screen session called ncscreen on the client node:
screen -S ncscreen
Leave some curl commands running:
while true ; do curl 10.142.0.8:31830 ; sleep 2; done
Leave that up and exit out of this screen session so we can track the connection:
CTRL+A,Z
Try to find the conntrack entry for this:
conntrack -L|grep 10.40.0.6
conntrack v1.4.2 (conntrack-tools): 101 flow entries have been shown.
conntrack v1.4.2 (conntrack-tools): tcp      6 86394 ESTABLISHED src=10.142.0.6 dst=10.40.0.6 sport=41244 dport=8080 src=10.40.0.6 dst=10.142.0.6 sport=8080 dport=41244 [ASSURED] mark=0 use=1
97 flow entries have been shown.
See how this looks on the node hosting the endpoint (10.142.0.8 in our example):
conntrack -L |grep 10.142.0.6
Since we have a curl command going every 2 seconds, you'll see a number of conntrack entries that look like this:
tcp 6 51 TIME_WAIT src=10.142.0.6 dst=10.142.0.8 sport=46078 dport=31830 src=10.40.0.6 dst=10.40.0.1 sport=8080 dport=46078 [ASSURED] mark=0 use=1
This entry translates packets from 10.142.0.6:46078 to 10.142.0.8:31830 on eth0 in the root namespace to 10.40.0.1.
To confirm this, let's watch the packets go by the interfaces on the host node. Of course, the source ports are going to change, so we don't filter for those.
First, on eth0:
tcpdump -ni eth0 host 10.142.0.6 and host 10.142.0.8 and port 31830
tcpdump: verbose output suppressed, use -v or -vv for full protocol decode
listening on eth0, link-type EN10MB (Ethernet), capture size 262144 bytes
22:30:52.944093 IP 10.142.0.6.48648 > 10.142.0.8.31830: Flags [S], seq 1615789609, win 28400, options [mss 1420,sackOK,TS val 439777833 ecr 0,nop,wscale 7], length 0
22:30:52.944202 IP 10.142.0.8.31830 > 10.142.0.6.48648: Flags [S.], seq 1772049419, ack 1615789610, win 28160, options [mss 1420,sackOK,TS val 439777988 ecr 439777833,nop,wscale 7], length 0
22:30:52.944373 IP 10.142.0.6.48648 > 10.142.0.8.31830: Flags [.], ack 1, win 222, options [nop,nop,TS val 439777834 ecr 439777988], length 0
22:30:52.944435 IP 10.142.0.6.48648 > 10.142.0.8.31830: Flags [P.], seq 1:81, ack 1, win 222, options [nop,nop,TS val 439777834 ecr 439777988], length 80
22:30:52.944473 IP 10.142.0.8.31830 > 10.142.0.6.48648: Flags [.], ack 81, win 220, options [nop,nop,TS val 439777988 ecr 439777834], length 0
22:30:52.944699 IP 10.142.0.8.31830 > 10.142.0.6.48648: Flags [P.], seq 1:187, ack 81, win 220, options [nop,nop,TS val 439777989 ecr 439777834], length 186
22:30:52.944796 IP 10.142.0.6.48648 > 10.142.0.8.31830: Flags [.], ack 187, win 231, options [nop,nop,TS val 439777834 ecr 439777989], length 0
22:30:52.944988 IP 10.142.0.6.48648 > 10.142.0.8.31830: Flags [F.], seq 81, ack 187, win 231, options [nop,nop,TS val 439777834 ecr 439777989], length 0
22:30:52.945041 IP 10.142.0.8.31830 > 10.142.0.6.48648: Flags [F.], seq 187, ack 82, win 220, options [nop,nop,TS val 439777989 ecr 439777834], length 0
22:30:52.945097 IP 10.142.0.6.48648 > 10.142.0.8.31830: Flags [.], ack 188, win 231, options [nop,nop,TS val 439777834 ecr 439777989], length 0
^C
Then, on cbr0:
tcpdump -ni cbr0 host 10.40.0.6 and port 8080
tcpdump: verbose output suppressed, use -v or -vv for full protocol decode
listening on cbr0, link-type EN10MB (Ethernet), capture size 262144 bytes
23:15:54.130540 IP 10.40.0.1.55100 > 10.40.0.6.8080: Flags [S], seq 621207778, win 28400, options [mss 1420,sackOK,TS val 442479019 ecr 0,nop,wscale 7], length 0
23:15:54.130629 IP 10.40.0.6.8080 > 10.142.0.6.55100: Flags [S.], seq 2670459926, ack 621207779, win 28160, options [mss 1420,sackOK,TS val 442479174 ecr 442479019,nop,wscale 7], length 0
23:15:54.130764 IP 10.40.0.1.55100 > 10.40.0.6.8080: Flags [.], ack 2670459927, win 222, options [nop,nop,TS val 442479020 ecr 442479174], length 0
23:15:54.130844 IP 10.40.0.1.55100 > 10.40.0.6.8080: Flags [P.], seq 0:80, ack 1, win 222, options [nop,nop,TS val 442479020 ecr 442479174], length 80: HTTP: GET / HTTP/1.1
23:15:54.130859 IP 10.40.0.6.8080 > 10.142.0.6.55100: Flags [.], ack 81, win 220, options [nop,nop,TS val 442479175 ecr 442479020], length 0
23:15:54.131147 IP 10.40.0.6.8080 > 10.142.0.6.55100: Flags [P.], seq 1:187, ack 81, win 220, options [nop,nop,TS val 442479175 ecr 442479020], length 186: HTTP: HTTP/1.1 200 OK
23:15:54.131249 IP 10.40.0.1.55100 > 10.40.0.6.8080: Flags [.], ack 187, win 231, options [nop,nop,TS val 442479020 ecr 442479175], length 0
^C
How does this translation happen? Let's look at iptables packet processing for the packets on this node.
Note: After the OUTPUT and KUBE-SERVICES chains below, the rest of the chains will be named differently on your system.
iptables -L | less
Node tries to route packets to 10.43.234.223 and send them to the OUTPUT chain. All OUTPUT packets are forwarded to the KUBE_SERVICES chain because of this rule:
Chain OUTPUT (policy ACCEPT)
target     prot opt source               destination
KUBE-SERVICES  all  --  anywhere             anywhere             /* kubernetes service portals */
Also consider the translation configuration:
iptables -L -tnat | less
It doesn't match anything else in the KUBE-SERVICES chain, so it goes to the KUBE-NODEPORTS chain:
Chain KUBE-SERVICES (2 references)
target     prot opt source               destination
..
KUBE-NODEPORTS  all  --  anywhere             anywhere             /* kubernetes service nodeports; NOTE: this must be the last rule in this chain */ ADDRTYPE match dst-type LOCAL
First match in KUBE-NODEPORTS makes us masquerade/SNAT the packets with the outbound IP (cbr0 in this case)
and sent to KUBE-SVC-AZMBASOGS4B7PAAL:
Chain KUBE-NODEPORTS (1 references)
target     prot opt source               destination
..
KUBE-MARK-MASQ  tcp  --  anywhere             anywhere             /* default/hello-server: */ tcp dpt:31830
KUBE-SVC-AZMBASOGS4B7PAAL  tcp  --  anywhere             anywhere             /* default/hello-server: */ tcp dpt:31830
KUBE-SVC-AZMBASOGS4B7PAAL just sends to KUBE-SEP-WGEM4BP3ARCHJ5MF
Chain KUBE-SVC-AZMBASOGS4B7PAAL (3 references)
target     prot opt source               destination
KUBE-SEP-WGEM4BP3ARCHJ5MF  all  --  anywhere             anywhere             /* default/hello-server: */
KUBE-SEP-WGEM4BP3ARCHJ5MF DNATs to the EndPointIP and port:
Chain KUBE-SEP-WGEM4BP3ARCHJ5MF (1 references)
target     prot opt source               destination
KUBE-MARK-MASQ  all  --  10.40.0.6            anywhere             /* default/hello-server: */
DNAT       tcp  --  anywhere             anywhere             /* default/hello-server: */ tcp to:10.40.0.6:8080
You will find a similar configuration on every node.
We should stop here and make sure that we understand why the service is available of every node’s $NodePort TCP port and
how connections get forwarded for $NodePort to the EndPoint on every node.
Having the service available on the same port on every node is good, but it still leaves us having to track down which node is up.
Revisit the kubectl describe service output:
kubectl describe service hello-server
Sample output:
Name:                     hello-server
Namespace:                default
Labels:                   run=hello-server
Annotations:              <none>
Selector:                 run=hello-server
Type:                     LoadBalancer
IP:                       10.43.246.223
LoadBalancer Ingress:     35.231.121.11
Port:                     <unset>  80/TCP
TargetPort:               8080/TCP
NodePort:                 <unset>  31830/TCP
Endpoints:                10.40.0.6:8080
Session Affinity:         None
External Traffic Policy:  Cluster
Events:                   <none>
We claim here that the service is available on $IP:$Port on every node. In this example, this is 10.43.246.223.
- Pick one of the GKE nodes and add a VPC static route, with
$IPas “Destination” and the chosen GKE node as “Next hop”. Click this link to open the VPC network > Routes page in the GCP COnsole. - Start another non-GKE node in the same subnet and issue continuous
curlcommands for$IP:$PORT. - On the target node, confirm that you see these packets coming in on
eth0:
tcpdump -ni eth0 port 80 and host 10.43.246.223
Sample output:
tcpdump: verbose output suppressed, use -v or -vv for full protocol decode
listening on eth0, link-type EN10MB (Ethernet), capture size 262144 bytes
21:53:45.598767 IP 10.142.0.2.48156 > 10.43.246.223.80: Flags [S], seq 4078280255, win 28400, options [mss 1420,sackOK,TS val 216982483 ecr 0,nop,wscale 7], length 0
21:53:45.598901 IP 10.43.246.223.80 > 10.142.0.2.48156: Flags [S.], seq 248336157, ack 4078280256, win 28160, options [mss 1420,sackOK,TS val 610350643 ecr 216982483,nop,wscale 7], length 0
21:53:45.599563 IP 10.142.0.2.48156 > 10.43.246.223.80: Flags [.], ack 1, win 222, options [nop,nop,TS val 216982484 ecr 610350643], length 0
21:53:45.599602 IP 10.142.0.2.48156 > 10.43.246.223.80: Flags [P.], seq 1:78, ack 1, win 222, options [nop,nop,TS val 216982484 ecr 610350643], length 77: HTTP: GET / HTTP/1.1
21:53:45.599619 IP 10.43.246.223.80 > 10.142.0.2.48156: Flags [.], ack 78, win 220, options [nop,nop,TS val 610350643 ecr 216982484], length 0
21:53:45.599951 IP 10.43.246.223.80 > 10.142.0.2.48156: Flags [P.], seq 1:187, ack 78, win 220, options [nop,nop,TS val 610350644 ecr 216982484], length 186: HTTP: HTTP/1.1 200 OK
21:53:45.600018 IP 10.142.0.2.48156 > 10.43.246.223.80: Flags [.], ack 187, win 231, options [nop,nop,TS val 216982484 ecr 610350644], length 0
21:53:45.600547 IP 10.142.0.2.48156 > 10.43.246.223.80: Flags [F.], seq 78, ack 187, win 231, options [nop,nop,TS val 216982484 ecr 610350644], length 0
21:53:45.600623 IP 10.43.246.223.80 > 10.142.0.2.48156: Flags [F.], seq 187, ack 79, win 220, options [nop,nop,TS val 610350644 ecr 216982484], length 0
21:53:45.600739 IP 10.142.0.2.48156 > 10.43.246.223.80: Flags [.], ack 188, win 231, options [nop,nop,TS val 216982484 ecr 610350644], length 0
Confirm that we also see the translations on cbr0:
tcpdump -ni cbr0 port 8080
Sample output:
tcpdump: verbose output suppressed, use -v or -vv for full protocol decode
listening on cbr0, link-type EN10MB (Ethernet), capture size 262144 bytes
21:55:32.237262 IP 10.40.0.1.48170 > 10.40.0.6.8080: Flags [S], seq 1923108487, win 28400, options [mss 1420,sackOK,TS val 217009143 ecr 0,nop,wscale 7], length 0
21:55:32.237325 IP 10.40.0.6.8080 > 10.142.0.2.48170: Flags [S.], seq 1020350181, ack 1923108488, win 28160, options [mss 1420,sackOK,TS val 610457281 ecr 217009143,nop,wscale 7], length 0
21:55:32.237869 IP 10.40.0.1.48170 > 10.40.0.6.8080: Flags [.], ack 1020350182, win 222, options [nop,nop,TS val 217009143 ecr 610457281], length 0
21:55:32.237902 IP 10.40.0.1.48170 > 10.40.0.6.8080: Flags [P.], seq 0:77, ack 1, win 222, options [nop,nop,TS val 217009143 ecr 610457281], length 77: HTTP: GET / HTTP/1.1
21:55:32.237914 IP 10.40.0.6.8080 > 10.142.0.2.48170: Flags [.], ack 78, win 220, options [nop,nop,TS val 610457282 ecr 217009143], length 0
21:55:32.238160 IP 10.40.0.6.8080 > 10.142.0.2.48170: Flags [P.], seq 1:187, ack 78, win 220, options [nop,nop,TS val 610457282 ecr 217009143], length 186: HTTP: HTTP/1.1 200 OK
21:55:32.238268 IP 10.40.0.1.48170 > 10.40.0.6.8080: Flags [.], ack 187, win 231, options [nop,nop,TS val 217009144 ecr 610457282], length 0
21:55:32.238575 IP 10.40.0.1.48170 > 10.40.0.6.8080: Flags [F.], seq 77, ack 187, win 231, options [nop,nop,TS val 217009144 ecr 610457282], length 0
21:55:32.238946 IP 10.40.0.6.8080 > 10.142.0.2.48170: Flags [F.], seq 187, ack 79, win 220, options [nop,nop,TS val 610457283 ecr 217009144], length 0
Once again, telnet from the client to $IP port 80 to hold that connection up and see how that flow entry looks on the node:
conntrack -L | grep 10.43.246.223
Sample output:
tcp 6 86359 ESTABLISHED src=10.142.0.2 dst=10.43.246.223 sport=48316 dport=80 src=10.40.0.6 dst=10.40.0.1 sport=8080 dport=48316 [ASSURED] mark=0 use=1
Once again, let's look at the iptables rules that allow this.
Use iptables -L and iptables -L --tnat to find this processing order.
After the OUTPUT and KUBE-SERVICES chains below, the rest of the chains will be named differently on
your system.
Node tries to route packets to 10.43.234.223 and send them to the OUTPUT chain. All OUTPUT packets are forwarded
to the KUBE_SERVICES chain because of this rule:
Chain OUTPUT (policy ACCEPT)
target     prot opt source               destination
KUBE-SERVICES  all  --  anywhere             anywhere             /* kubernetes service portals */
10.43.236.223 matches this rule in KUBE-SERVICES, which forwards to KUBE-SVC-AZMBASOGS4B7PAAL:
Chain KUBE-SERVICES (2 references)
...
KUBE-SVC-AZMBASOGS4B7PAAL  tcp  --  anywhere             10.43.246.223        /* default/hello-server: cluster IP */ tcp dpt:http
In KUBE-SVC-AZMBASOGS4B7PAAL, we send everything to the KUBE-SEP-WGEM4BP3ARCHJ5MF chain:
Chain KUBE-SVC-AZMBASOGS4B7PAAL (3 references)
target     prot opt source               destination
KUBE-SEP-WGEM4BP3ARCHJ5MF  all  --  anywhere             anywhere             /* default/hello-server: */
KUBE-SEP-WGEM4BP3ARCHJ5MF DNATs to the EndPointIP and port:
Chain KUBE-SEP-WGEM4BP3ARCHJ5MF (1 references)
target     prot opt source               destination
KUBE-MARK-MASQ  all  --  10.40.0.6            anywhere             /* default/hello-server: */
DNAT       tcp  --  anywhere             anywhere             /* default/hello-server: */ tcp to:10.40.0.6:8080
Once you're satisfied that you understand this, don't forget to remove the static route for $IP to the test node before
proceeding to the next section.
We will now demonstrate how your service is made available to the outside world.
Again, revisit the kubectl describe service output:
kubectl describe service hello-server
Sample output:
Name:                     hello-server
Namespace:                default
Labels:                   run=hello-server
Annotations:              <none>
Selector:                 run=hello-server
Type:                     LoadBalancer
IP:                       10.43.246.223
LoadBalancer Ingress:     35.231.121.11
Port:                     <unset>  80/TCP
TargetPort:               8080/TCP
NodePort:                 <unset>  31830/TCP
Endpoints:                10.40.0.6:8080
Session Affinity:         None
External Traffic Policy:  Cluster
Events:                   <none>
We can find the load-balancer IP address from gcloud like so:
gcloud compute forwarding-rules list
Sample output:
NAME                              REGION    IP_ADDRESS          IP_PROTOCOL  TARGET
a88cd35f5879e11e892a242010a8e007  us-east1  35.231.121.11       TCP          us-east1/targetPools/a88cd35f5879e11e892a242010a8e007
Describe the forwarding rule to see the target pool:
gcloud compute forwarding-rules describe a88cd35f5879e11e892a242010a8e007
Sample output:
IPAddress: 35.231.121.11
IPProtocol: TCP
creationTimestamp: '2018-07-14T12:46:30.883-07:00'
description: '{"kubernetes.io/service-name":"default/hello-server"}'
id: '6076245142483234297'
kind: compute#forwardingRule
loadBalancingScheme: EXTERNAL
name: a88cd35f5879e11e892a242010a8e007
networkTier: PREMIUM
portRange: 80-80
region: https://www.googleapis.com/compute/v1/projects/bernieongewe-dev1/regions/us-east1
selfLink: https://www.googleapis.com/compute/v1/projects/bernieongewe-dev1/regions/us-east1/forwardingRules/a88cd35f5879e11e892a242010a8e007
target: https://www.googleapis.com/compute/v1/projects/bernieongewe-dev1/regions/us-east1/targetPools/a88cd35f5879e11e892a242010a8e007
Describe the target pool where we should see instances:
gcloud compute target-pools describe a88cd35f5879e11e892a242010a8e007
Sample output:
creationTimestamp: '2018-07-14T12:46:26.956-07:00'
description: '{"kubernetes.io/service-name":"default/hello-server"}'
healthChecks:
- https://www.googleapis.com/compute/v1/projects/bernieongewe-dev1/global/httpHealthChecks/k8s-c1f99c83f2e87324-node
id: '5659079057831620093'
instances:
- https://www.googleapis.com/compute/v1/projects/bernieongewe-dev1/zones/us-east1-b/instances/gke-lab-cluster-default-pool-9e4ce61e-2jdh
- https://www.googleapis.com/compute/v1/projects/bernieongewe-dev1/zones/us-east1-b/instances/gke-lab-cluster-default-pool-9e4ce61e-m69d
- https://www.googleapis.com/compute/v1/projects/bernieongewe-dev1/zones/us-east1-b/instances/gke-lab-cluster-default-pool-9e4ce61e-33fg
Launch tcpdump sessions on all the nodes watching for 80/TCP on eth0 while being careful to filter out conversations
with the metadata server:
tcpdump -ni eth0 port 80 and not '(host 169.254.169.254)'
Visit http://$LoadBalancerIP from any browser. Hit refresh a few times as you watch the tcpdump sessions. An example appears below:
3:03:42.410455 IP 104.132.154.90.39295 > 35.231.121.11.80: Flags [S], seq 1041591234, win 29200, options [mss 1338,sackOK,TS val 547281946 ecr 0,nop,wscale 7], length 0
23:03:42.410517 IP 35.231.121.11.80 > 104.132.154.90.39295: Flags [S.], seq 417328023, ack 1041591235, win 28160, options [mss 1420,sackOK,TS val 614547454 ecr 547281946,nop,wscale 7], length 0
23:03:42.478018 IP 104.132.154.90.53948 > 35.231.121.11.80: Flags [.], ack 2, win 229, options [nop,nop,TS val 547281963 ecr 614547454], length 0
23:03:42.478186 IP 104.132.154.90.60333 > 35.231.121.11.80: Flags [.], ack 2, win 229, options [nop,nop,TS val 547281963 ecr 614547454], length 0
23:03:42.478238 IP 104.132.154.90.39295 > 35.231.121.11.80: Flags [.], ack 1, win 229, options [nop,nop,TS val 547281963 ecr 614547454], length 0
What do you notice about the IPs? How is this possible? Can you track down the packet processing rules that facilitate this connection on your own?
This is a good place to stop and watch The ins and outs of networking in Google Container Engine and Kubernetes (Google Cloud Next '17) as a refresher on the work you've done.
In Exercise 2, we already configured a service with type LoadBalancer. This section introduces you to the ingress
controller as implemented by GKE.
We already defined LoadBalancer with the command below (repeated here for reference; no need to enter it again):
kubectl expose deployment hello-server --type LoadBalancer \
  --port 80 --target-port 8080
Observe that a kubectl command was used to build a Google Cloud object. How is this?
Here we introduce the concept of an ingress. An ingress is a logical layer 7 traffic path rather than the layer 4 service. At present, it’s HTTP(S) only, but could include other layer 7 protocols in the future.
https://kubernetes.io/docs/concepts/services-networking/ingress/
"GCE/Google Kubernetes Engine deploys an ingress controller on the master... In environments other than GCE/Google Kubernetes Engine, you need to deploy a controller as a pod"
This means that we want to edit this rule with kubectl. Any change made directly with gcloud will be reverted by
the master.
This is the environment we have created, with the service deployed in pods across the available nodes:

So where is this master? We can find out with this command:
kubectl cluster-info
Sample output:
Kubernetes master is running at https://35.231.234.26
GLBCDefaultBackend is running at https://35.231.234.26/api/v1/namespaces/kube-system/services/default-http-backend:http/proxy
Heapster is running at https://35.231.234.26/api/v1/namespaces/kube-system/services/heapster/proxy
KubeDNS is running at https://35.231.234.26/api/v1/namespaces/kube-system/services/kube-dns:dns/proxy
kubernetes-dashboard is running at https://35.231.234.26/api/v1/namespaces/kube-system/services/https:kubernetes-dashboard:/proxy
Metrics-server is running at https://35.231.234.26/api/v1/namespaces/kube-system/services/https:metrics-server:/proxy

To further debug and diagnose cluster problems, use 'kubectl cluster-info dump'.
Here we see an unfamiliar IP address. Something else that GKE did for us was to create a master node.
For now, it's only important to appreciate that GKE takes care of building the master node and ingress for us. However, this difference will become important when we begin to integrate with external environments.
This is also a good place to bring attention to the fact that the on-VM forwarding configurations we've seen so far are also GKE artifacts. The customer may introduce plugins to other network drivers. See the Kubernetes documentation for some examples.
How might some of these extend the reach and capabilities of GKE?
Observe that many of these allow integration with on-premises technologies (VMware, etc.).
This talk gives good insight: Kubernetes Webinar Series - Everything About Ingress
Let's now take a close look at the ingress configuration.
Now let's look at the front-end configuration that provides access from the outside world. We can find the load-balancer
IP address from gcloud like so:
gcloud compute forwarding-rules list
Sample output:
NAME                              REGION    IP_ADDRESS          IP_PROTOCOL  TARGET
..
a88cd35f5879e11e892a242010a8e007  us-east1  35.231.121.11       TCP          us-east1/targetPools/a88cd35f5879e11e892a242010a8e007
In the example above, we recognize the forwarding rule by its IP address. This is the same as the LoadBlancerIngress value
reported in kubectl describe service hello-server. Follow the example below, swapping out the name of the pool and the
region as appropriate for your environment:
gcloud compute target-pools describe a88cd35f5879e11e892a242010a8e007 --region us-east1
Sample output:
creationTimestamp: '2018-07-14T12:46:26.956-07:00'
description: '{"kubernetes.io/service-name":"default/hello-server"}'
healthChecks:
- https://www.googleapis.com/compute/v1/projects/bernieongewe-dev1/global/httpHealthChecks/k8s-c1f99c83f2e87324-node
id: '5659079057831620093'
instances:
- https://www.googleapis.com/compute/v1/projects/bernieongewe-dev1/zones/us-east1-b/instances/gke-lab-cluster-default-pool-9e4ce61e-2jdh
- https://www.googleapis.com/compute/v1/projects/bernieongewe-dev1/zones/us-east1-b/instances/gke-lab-cluster-default-pool-9e4ce61e-m69d
- https://www.googleapis.com/compute/v1/projects/bernieongewe-dev1/zones/us-east1-b/instances/gke-lab-cluster-default-pool-9e4ce61e-33fg
kind: compute#targetPool
name: a88cd35f5879e11e892a242010a8e007
region: https://www.googleapis.com/compute/v1/projects/bernieongewe-dev1/regions/us-east1
selfLink: https://www.googleapis.com/compute/v1/projects/bernieongewe-dev1/regions/us-east1/targetPools/a88cd35f5879e11e892a242010a8e007
sessionAffinity: NONE
Here, we recognize the instances participating in the cluster. Consider the health check:
gcloud compute http-health-checks describe k8s-c1f99c83f2e87324-node
Sample output:
checkIntervalSec: 2
creationTimestamp: '2018-07-14T12:46:23.030-07:00'
description: '{"kubernetes.io/service-name":"k8s-c1f99c83f2e87324-node"}'
healthyThreshold: 1
host: ''
id: '1481905899963936224'
kind: compute#httpHealthCheck
name: k8s-c1f99c83f2e87324-node
port: 10256
requestPath: /healthz
selfLink: https://www.googleapis.com/compute/v1/projects/bernieongewe-dev1/global/httpHealthChecks/k8s-c1f99c83f2e87324-node
timeoutSec: 1
unhealthyThreshold: 5
Notice the path and the port. How to confirm that this what we see coming into the instances? Let's visit one of them and capture 10 packets on this port (adjust for your environment):
sudo toolbox tcpdump -ni eth0 port 10256 -A -c 10
Visit the LoadBalacerIP on this port, both from one of the nodes and from outside the VPC. As usual, aim at an IP
address and port appropriate to your setup:
curl 35.231.121.11:10256/healthz
What do you notice about the source and destination IPs in the tcpdump output? Have we seen the health check port defined
anywhere else? How about the requestPath? And the returned page?
This exercise assumes that you just finished deploying the hello-server container from Exercise 2 and demonstrates how to
visit the pod's namespace directly.
Since these aren't registered, we have to hunt down them down and visit them by PID. To do this, we must go through the following:
- Get the pod name from
kubectl. - Given the pod name, get the container ID and host IP address.
- Use SSH to connect to the host and get the PID from the container ID.
- Jump into the namespace by PID.
First, get the pod name Cloud Shell:
kubectl get pod
Then, from the pod name, get the Docker ID:
kubectl get pod $PODNAME -o=json| jq '[.status.containerStatuses[0].containerID]'
We only need the first 12 characters of this. Take note of the output of this command:
kubectl get pod $PODNAME -o=jsonpath='{.status.containerStatuses[0].containerID}'|cut -c 10-21
Get the IP address of the host running the container:
kubectl get pod $PODNAME -o=jsonpath='{.status.hostIP}'
Now that you have the IP address, use SSH to connect to the host running the container, then get the PID of the container:
PID=$(docker inspect --format '{% verbatim %}{{ .State.Pid }}{% endverbatim %}' $ContainerID)
Get the host running the container:
sudo nsenter -t ${PID} -n bash
Look around the namespace taking special note of its IP as well as the default route IP.
ip address show
ip route show
sudo iptables -L
sudo iptables -L -tnat
Exit when you're satisfied:
exit
Consider what we just had to do just to look at the pod's namespace. This was not as straightforward as in Exercise 1. Fortunately, there should never be a need to directly visit the namespace in this manner.