Accelerate data science workflows with Looker, plus free training to help get started
Shingi Samudzi
Data Analyst Consultant, Google Cloud
Looker, the modern business intelligence (BI) and analytics platform that is now a part of Google Cloud, is more than a BI reporting tool. It’s a full-fledged data application and visualization platform. Looker allows users to curate and publish data, integrating with a wide range of endpoints in many different formats ranging from CSV, JSON, Excel, files to SaaS and in-house built custom applications.
In this post, I’ll explain how data analysts and data scientists can use Looker to help with data governance, which is the process of managing the availability, usability, integrity, and security of data in enterprise systems. Data governance is the first, necessary step in supporting scalable, automated machine learning operations. For a live demonstration and real life examples of how to use Looker to automate and productionalize data science workflows, sign up here for my March 4 webinar. You can also watch the webinar on-demand after March 4.
Data scientists spend 45% of their time on data preparation tasks like loading and cleaning data, which is a large operational and financial burden. Data analysts and data scientists are also often under pressure to quickly show business value to stakeholders skeptical of the return in the investment in data science, which is difficult given that they have to take the time to build their own data pipelines for each project.
At the same time, data silos continue to persist as different teams create competing reports with different data sources and even reporting tools. As the businesses mature and require reporting involving machine learning or AI, things become even more complex. There’s a strong need for data governance in these situations but it’s often forgotten or considered at the last minute.
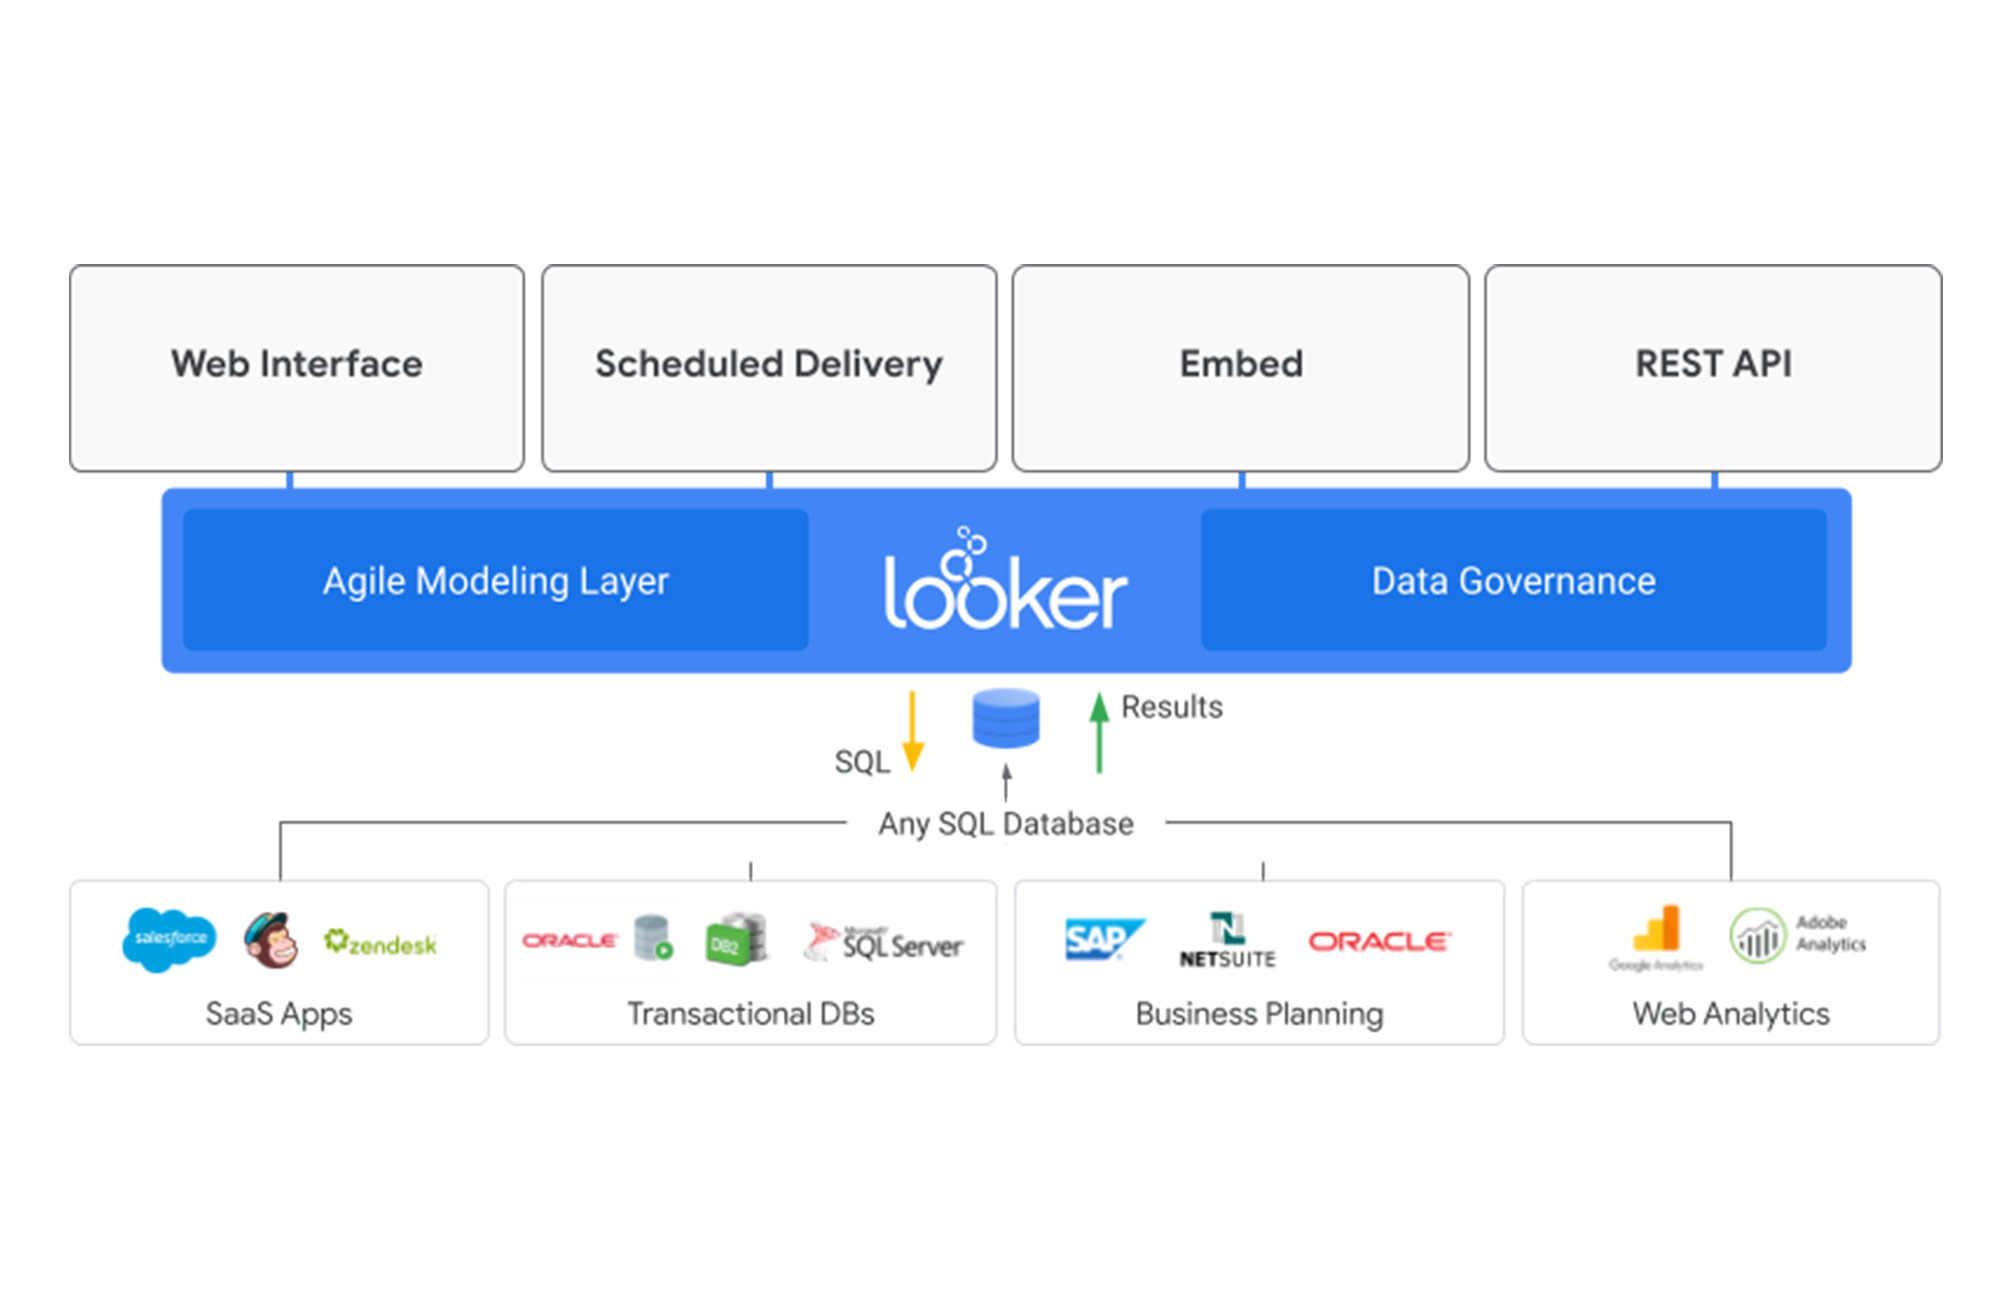
With Looker’s platform and publishing capabilities, business users, data analysts and scientists can use it as a central data clearinghouse for the entire organization. Moreover, LookML, Looker’s modeling language which abstracts SQL queries, provides an easy way to implement data governance as a service that sits on top of multiple SQL based data warehouses.
With data governance and data publishing all in one place, you can significantly reduce the time data analysts and scientists spend in the acquisition and basic cleaning of data.
Here’s an analogy to help you visualize how this works. Imagine a room with three people: One wants to build a house, one wants to build a piece of furniture, and one wants to build a picture frame. Which is more efficient: each person cutting down their own trees, preparing the timber separately, and then making their own lumber pieces every time they want to make something or going to a home improvement store, buying the desired lumber off the shelf, and spending all of their time building what they want to build?
In the first scenario, they each need to do all the work of processing the raw materials into usable lumber pieces before then building what they actually want to build. It’s more efficient for all of them to share the same upstream supply chain processes since their work inputs all come from the same original source.
In this analogy, Looker is the home improvement store. It’s your data retail space that centralizes the process of acquiring, QA’ing, warehousing, and ultimately making data available in a format ready to use for each type of end user and end use by acting as a semantic layer that flexibly reshapes data from an underlying data warehouse into formats that can be consumed directly by each type of end-user.
Now, instead of each organization or function within your business building its own data pipelines, excel reports, or reporting tools, everyone can source their data from the same place and focus their effort on distribution or applying last-mile transformation specific to their end use.
With fully governed data across the entire enterprise, data acquisition transforms from days spent arm-wrestling data from disparate sources to ensure that basic standards of cleanliness are met (transforming column types, making sense of column names, removing NA’s, and even validating that the desired data is present within the dataset), into a well laid out data retail space where performing very simple queries to get already-vetted datasets into an AI Notebook takes minutes.
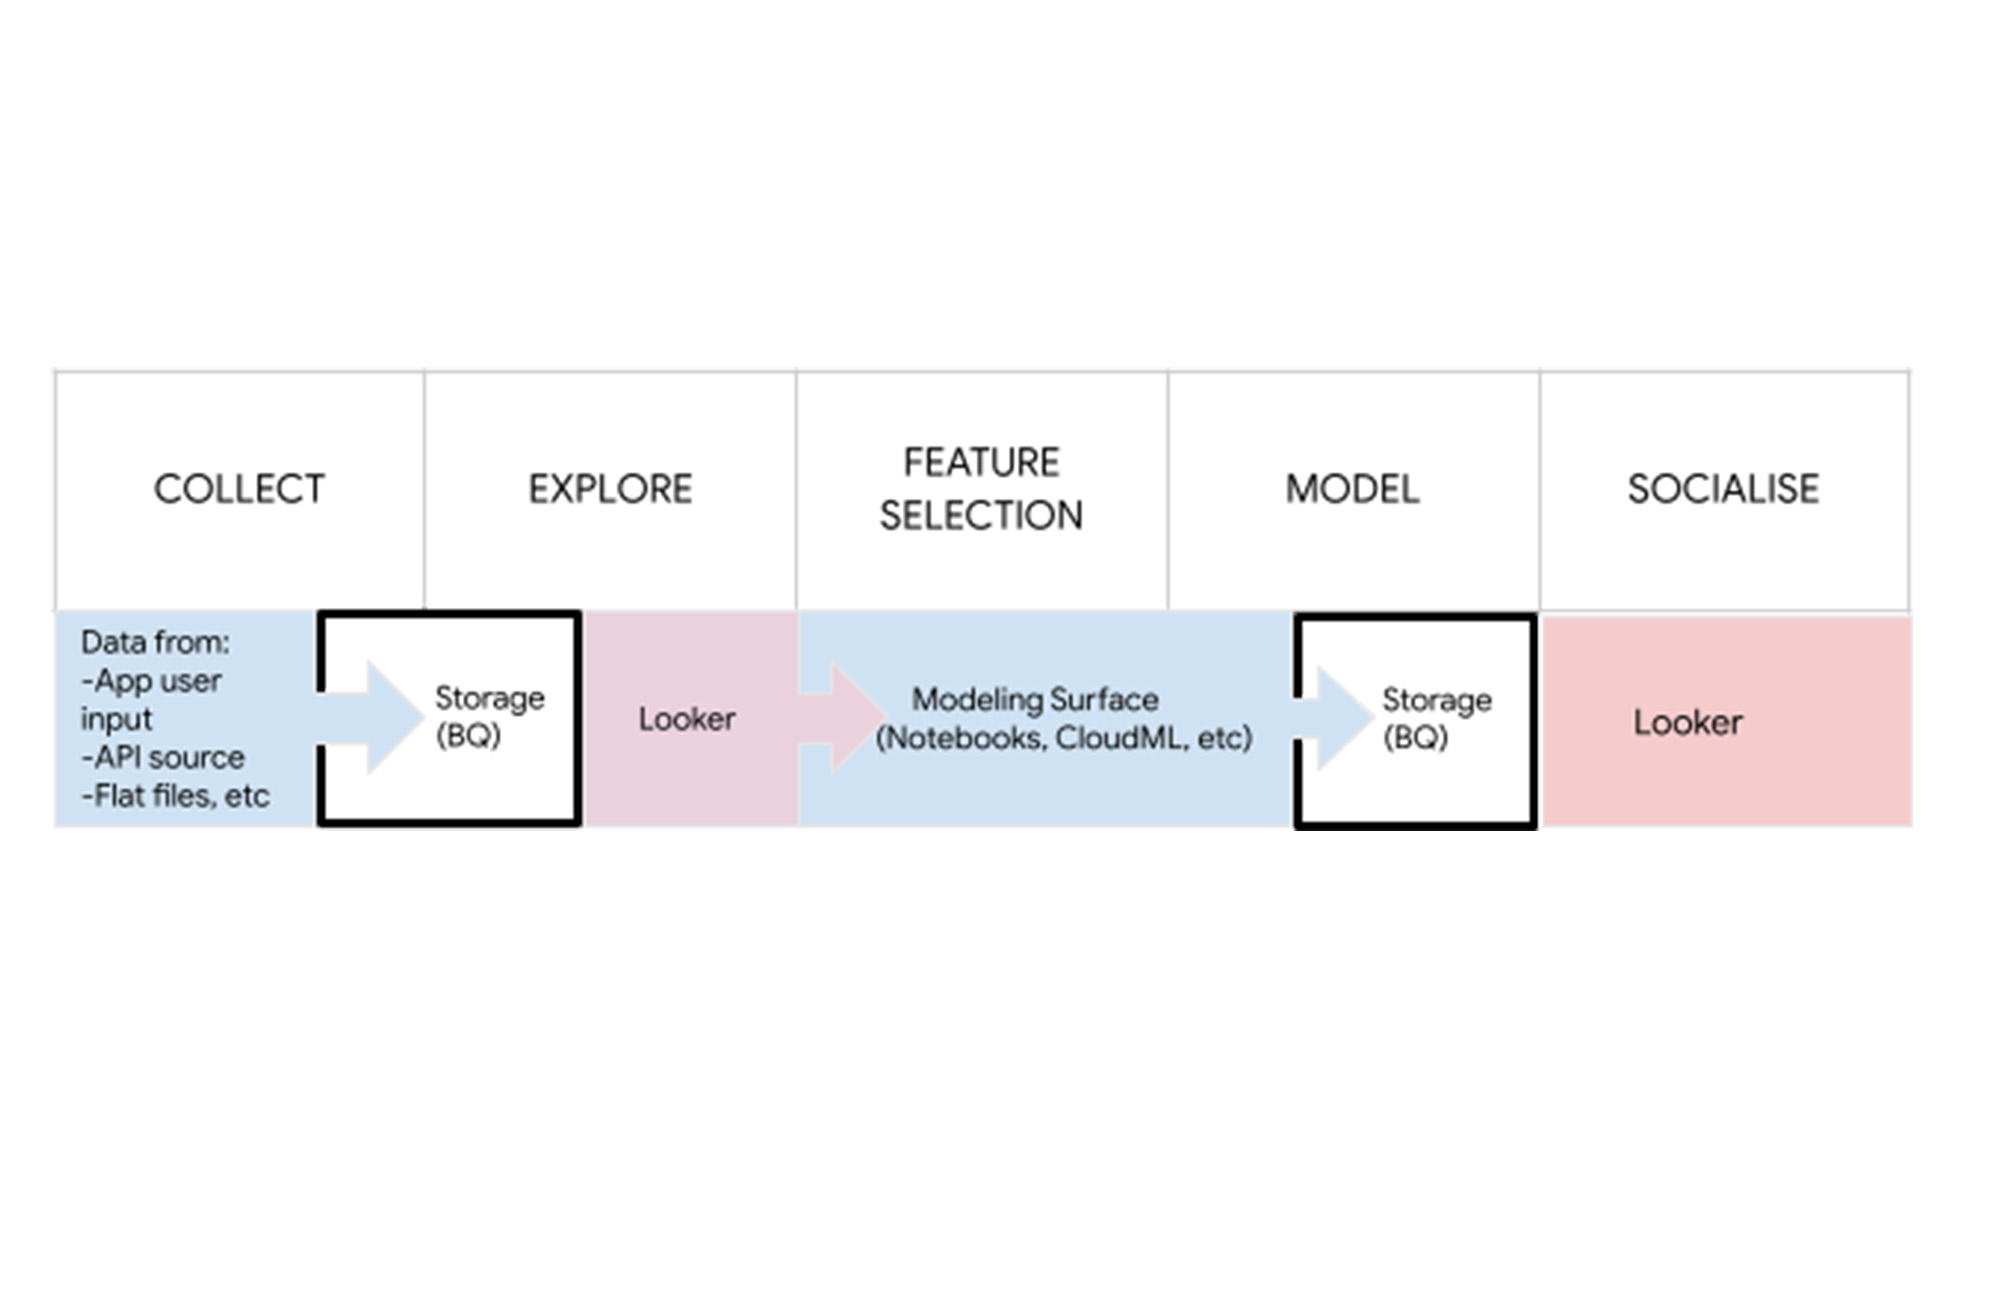
Looker fits into the back-end of the data science workflow as well, in both sharing model performance as well as sharing model results in an easily explorable manner across the organization.
Interested in learning more about how to use Looker? Join me on March 4 to walk through working examples of how Looker and Google Cloud can be leveraged to help automate and productionalize data science workflows. You can also watch the webinar on-demand after March 4.