Debugging Complex Malware that Executes Code on the Heap
Mandiant
Written by: Michael Bailey
Introduction
In this blog, I will share a simple debugging tactic for creating “save points” during iterative remote debugging of complex multi-stage samples that execute code in heap memory at non-deterministic addresses. I’ll share two examples: one contrived, and the other a complex, modular malware sample (MD5 hash: 830a09ff05eac9a5f42897ba5176a36a) from a family that we call POISONPLUG. I will focus on IDA Pro and WinDbg, but I’ll explain how to achieve the same effect with other tools as well. With this tactic, you can also hand off program execution between multiple debuggers using the strengths of different tools (e.g. unpacking a binary, dumping memory maps, combatting anti-RE, or normal debugging).
The essence is merely suspending the malware. To set the stage, I must first explain how malware influences our debugging tactics to necessitate this. This explanation will serve as a review of common techniques that make malware debugging easier and culminate in the case study of POISONPLUG. If you’re already a seasoned analyst using IDA Pro to remotely debug malware, and you’re only interested in the bottom line of how to suspend and snapshot live malware, then skip to the Summary section at the end.
VMs and Snapshots as Save Points
To prevent malware from doing damage, most malware reverse engineers debug in an isolated VM. This gives rise to the powerful tactic of capturing VM snapshots throughout the debugging process to be able to return to a “save point” after making a mistake. The analyst is then free to be aggressively experimental about exploring malware behavior. The only consequence of an error is that the analyst must revert the VM and avoid making the same mistake again.
Remote Debugging
Debugging malware on the same system where static analysis artifacts are stored is dangerous; malware (e.g. ransomware) can destroy notes and disassembly databases, or malware anti-RE measures can inflict data loss (e.g. by rebooting). Consequently, it makes sense to use separate systems for debugging versus disassembly and note-taking. Depending on the tools used, this can force the analyst to flip back and forth between viewing disassembler output and the debugger, like a spectator at a tennis match. These transitions are distracting.
Unifying Static and Dynamic Analysis with IDA Pro as a Front-End
Fortunately, IDA Pro (and probably most modern disassemblers) can act as a debugging front-end, superimposing disassembly annotations over live memory and register state in a running program. This lets the analyst see and directly alter disassembly annotations in response to their observations, without switching back and forth.
Malware that Modifies its Memory Map at Runtime
There is one frequent scenario that further shapes the requirements for a dynamic analysis methodology: malware that allocates heap memory, writes code to that memory, and executes that code. Consider Figure 1, which shows a simple program written in C.
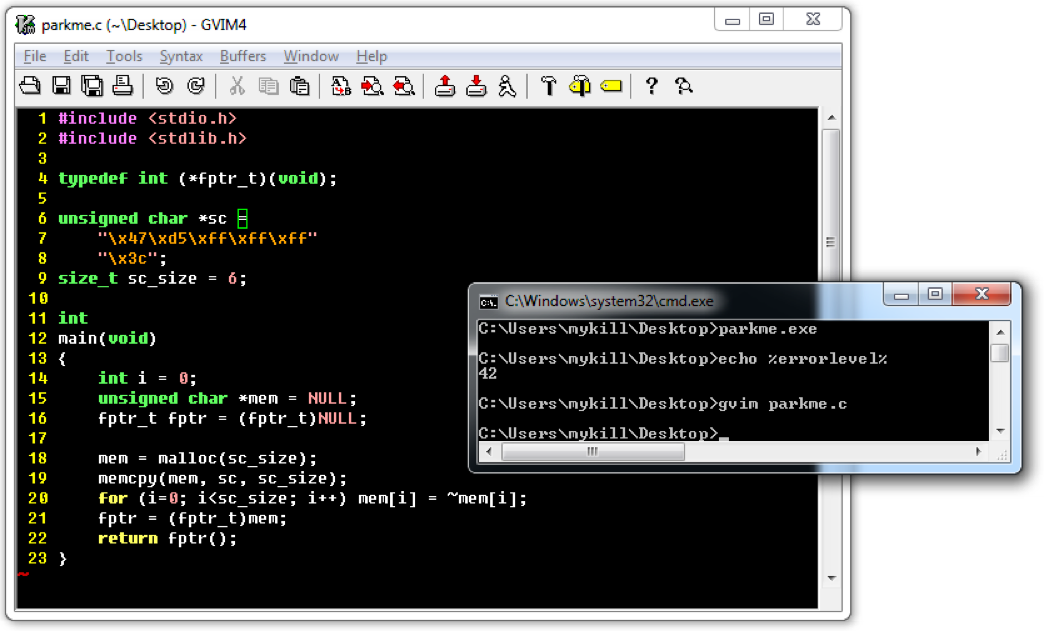

Figure 1: Simple shellcode example program
The program allocates memory using malloc, copies six bytes to that location using memcpy, logically inverts each byte, calls the buffer as a function, and finally returns the shellcode’s return value (error checking omitted both for brevity and realism). Figure 2 shows the decoded shellcode in memory.
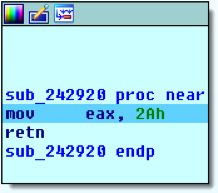

Figure 2: Simple shellcode function returns 42
Without this code, the disassembly database is missing useful information about the malware’s code, leaving its behavior as a bit of a black box. This simple example demonstrates a common pattern, but its trivial nature isn’t compelling enough to consider this a serious problem. A more realistic example will provide more substantial motivation for the debugging tactic at hand.
Case Study: POISONPLUG
For a realistic example, consider the sample with MD5 hash 830a09ff05eac9a5f42897ba5176a36a (which is available from VirusTotal). This malware creates a thread that decodes and calls shellcode, which unpacks and calls into the entry point of a modified DLL module. The module in turn unpacks six additional modules before finally calling a function within one of those modules. The DllEntryPoint functions of several modules each create several anti-RE threads that attempt to detect common analyst tools and terminate the malware in response. After completely unpacking the malware, tools such as Tyler Dean’s injectfind for flare-dbg or my own flare-qdb (Query-Oriented Debugger) can expose all the read/write/execute (R/W/X) mappings in memory that, in this case, point directly to the malware modules. Figure 3 shows the output from flare-qdb debugging a subset of the malware to this point and dumping its R/W/X allocations.


Figure 3: POISONPLUG R/W/X memory locations after unpacking
Figure 4 shows the unpacked shellcode-based loader from this sample, which is intricate, obfuscated, and time-consuming to annotate.


Figure 4: POISONPLUG’s shellcode-based loader
This shellcode implements several anti-RE features specific to this malware family, and a copy of this is used to unpack seven modules altogether with modified/custom PE-COFF headers. A common response to finding an entire executable file in memory is to dump the file and create its own disassembly database. However, the modules use a list of function pointers stashed in a mapping of the paging file to locate and call into one-another’s function “exports” in spaghetti code fashion to deliberately obfuscate control flow and functional semantics. Figure 5 shows an example, where each lane represents one executable code module, and the boxes inside each lane represent distinct function entry point RVAs within that module.
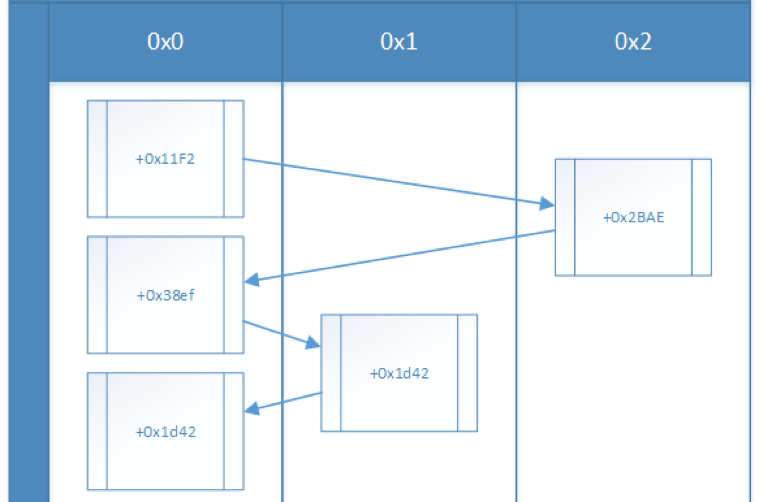

Figure 5: Partial interaction diagram for retrieving and decoding configuration
The code at offset 0x11f2 in module 0 is simply calling into other modules to eventually arrive at code within its own module (at offset 0x1d42). Dumping to separate disassembly databases creates distractions for the analyst as they must Alt+Tab between entirely different disassembly databases to follow the path of execution.
These types of complex samples create a dual problem for the debugging tactics described so far…
Challenge 1: Syncing Code from the Heap
The first problem is that the code written to memory is generally not readily available in the original disassembly output, and dumping to separate disassembly databases is not always appropriate. It can also be a lot of work to neutralize anti-reversing measures and shepherd a sample to the point where it has unpacked all its encoded modules into heap memory. A debugging mistake can entail a lot of additional work to fix and resume analysis. Live memory is a resource that could hasten reverse engineering if it can be preserved beyond the life of the debug session. Luckily, this first problem of making unpacked modules conveniently available in a single disassembly database can be solved trivially, at least in IDA Pro:
- Visit each dynamically allocated code region to change its segment attributes (Alt+S) and mark each as a Loader segment
- Pull the dynamically allocated memory into the disassembly database (Debugger > Take memory snapshot > Loader Segments)
If you are following along without having started a debugging session, IDA’s Change segment attributes dialog will omit the Loader segment checkbox. Figure 6 shows this dialog during a debugging session, with the Loader segment checkbox highlighted.


Figure 6: Change segment attributes dialog during debugging session
After pulling in live memory, it is possible to read and annotate unpacked modules and code in heap allocations even after terminating the debugging session, as shown in Figure 7.
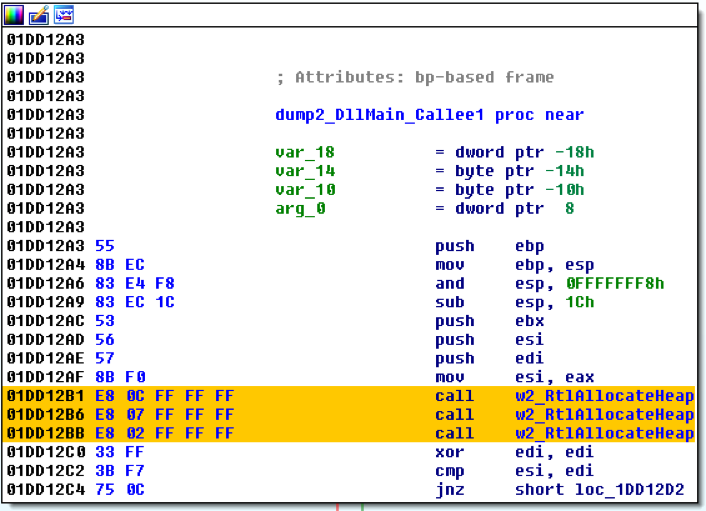

Figure 7: Function code from heap saved from a debug memory snapshot
Challenge 2: Non-Deterministic Memory Maps
A second problem arises from samples that execute code in dynamically allocated memory. Recovering from a debugging mistake still requires debugging the program again, but modules frequently occupy varying addresses across different executions. Consequently, the helpful annotations created in IDA Pro at the original addresses are absent from the new code locations. Figure 8 shows an example containing the same code as in Figure 7, but loaded at a different address during a subsequent execution of the program. The analyst must then recognize and/or relabel everything to continue the analysis. This can be scripted, but it is a time-consuming distraction.
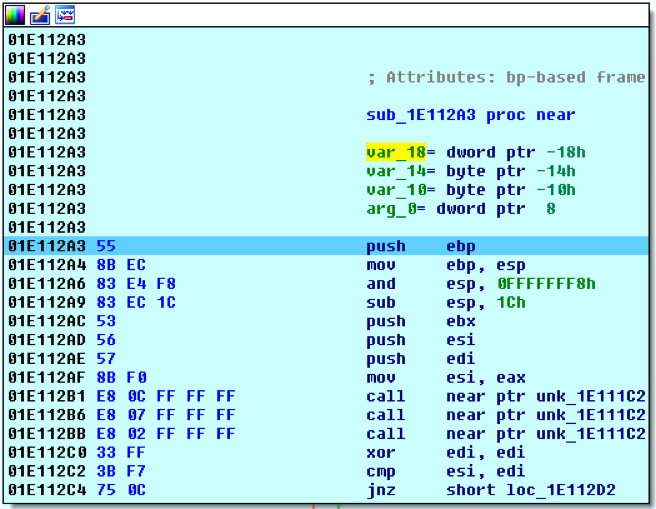

Figure 8: Same code at a different address lacks annotations
The reason the code appears at varying addresses across debugging sessions is that Windows’ memory allocation functions such as VirtualAlloc do not always return consistent addresses from one execution of a program to the next. For example, the first time a program runs, it may obtain memory at address 0xe000, the second time at 0x11a000, et cetera. For complex malware with several modules, this presents a problem.
We’d like the memory map to be uniform from one debug session to another so we can continue to build on our existing static analysis annotations, each of which IDA Pro has associated with a single virtual address. Alas, even though VirtualAlloc accepts an optional lpAddress parameter to indicate the starting address of the region to allocate, this is merely a suggestion unless memory was already reserved and uncommitted at that address. Forcing the lpAddress parameter to a desired value rarely (in my experience, never) yields success.
Alternately, it would be nice to go back to using virtual machine snapshots to create “save points” like before. Unfortunately, when debugging remotely over a network, the process of reverting a virtual machine snapshot breaks the TCP connection between the debug server and IDA Pro and prevents the malware from continuing under the control of the debugger.
…Where we Lay our Scene
The stage is now set to introduce the new technique. First, a short recap of how we got here:
- Need to debug in a VM to avoid damage to the host system
- Prefer to use IDA Pro as the debugging front-end to unify static and dynamic analysis
- Need to use remote debugging to avoid damage to static analysis artifacts and documentation
- Need to debug iteratively across multiple debug sessions
- Disassembly annotations must align with the memory map in the debug session to be useful
Malware behavior and analyst preferences seem to have painted us into a corner. Running the malware repeatedly results in a non-deterministic memory map that does not align with the annotations in the disassembly database, and using IDA Pro to unify the static view with live remote debugging appears impede the use of VM snapshots to act as save points. What should an analyst do?
Park Your Malware
To capture a VM snapshot that allows us to repeatedly reattach to and resume debugging, we’ll increase the suspend count of all the threads in the program and detach the debugger. The debug server will gracefully close its TCP connection, and the program will stay suspended until we reattach. We then capture a VM snapshot. Finally, we can repeatedly revert the VM, reattach, and resume execution to continue our analysis. This way, you can park your malware once, and then crash it over and over again until you understand its behavior.
As it turns out, IDA Pro’s facility for suspending threads (right-click -> Suspend) doesn’t maintain its effect after detaching the debugger. Instead, we’ll specifically use WinDbg as IDA’s debugger back-end (see the directions at Hex-Rays’ site).
The WinDbg command for viewing thread status is ~ (tilde). The ~ command accepts an optional numeric argument to specify which thread to display (e.g. ~3), or you can specify ~* to display full status for all threads. WinDbg also supports commands ~n and ~m for suspending and resuming threads. These also permit numeric or asterisk arguments, so we can use ~*n to suspend all threads before detaching, and ~*m to resume them upon reattaching. Figure 9 shows IDA/WinDbg output after viewing thread status, suspending all threads, and finally viewing their status once more.
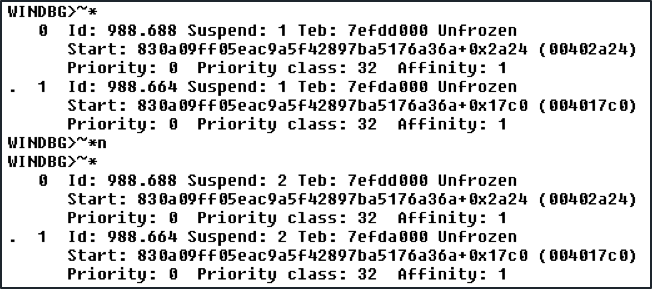

Figure 9: Viewing thread status, suspending, and viewing again
The suspend count increases from 1 to 2 after issuing the ~*n command. Now, when the debugger detaches from the process and decrements the suspend count of all threads (as usual), the artificially elevated suspend count of each thread will remain greater than zero. Consequently, the NT dispatcher will not schedule any threads in the process to run, and the process will continue to exist in a suspended state.
Now, we can capture a VM snapshot that can be repeatedly reverted to resume debugging from where we left off. Figure 10 shows the process attachment dialog in IDA Pro after reverting the VM snapshot and clicking Debugger -> Attach to process…


Figure 10: Attaching to the suspended process
You can create these “save points” at various junctures – as many as you have disk space to store.
The one caveat to this procedure is that it is easy to forget to resume threads between reattaching and attempting to continue debugging. If you forget this step, then the “Please wait…” modal dialog in Figure 11 will appear.
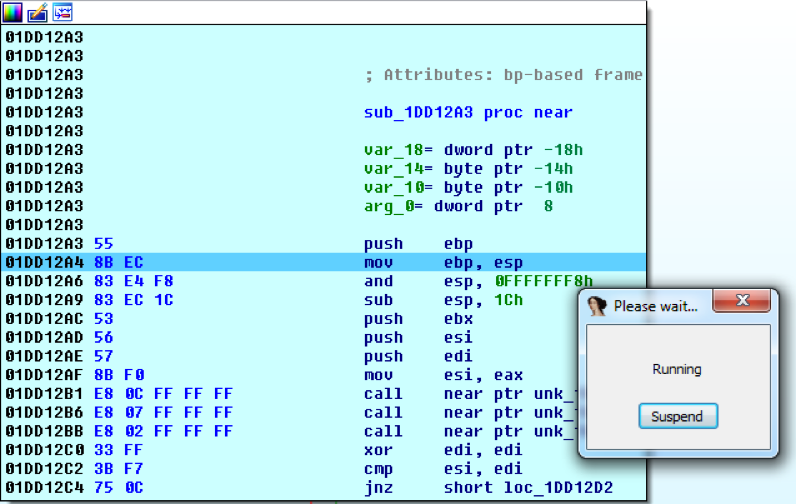

Figure 11: Debugging a suspended process
A reverse engineer might be accustomed to seeing this dialog only after making a mistake and allowing malware to run free, but in this case, the program is not actually executing any instructions. To fix it, simply click the Suspend button in IDA Pro’s “Please wait…” dialog and then resume all threads (WinDbg: ~*m) to decrease their suspend count. Then, execution can continue as normal.
Summary
To suspend a program that you are running within an IDA Pro + WinDbg remote debug session to capture a reusable VM snapshot:
- Suspend all threads (WinDbg: ~*n)
- Detach from the process (IDA Pro: Debugger -> Detach from process)
- Capture your VM snapshot
To resume the suspended program:
- Attach to the remote process (IDA Pro: Debugger -> Attach to process…)
- Resume all threads (WinDbg: ~*m)
- Resume debugging as normal
If you aren’t interested in using WinDbg commands, you can instead use SysInternals’ Process Explorer to suspend the process in your debugging VM and simply detach using IDA Pro. You could also write a Python ctypes script or native program to directly use the relevant Windows APIs if you prefer (specifically via CreateToolhelp32Snapshot with the TH32_SNAPTHREAD flag, OpenThread, SuspendThread, and ResumeThread).
This tactic allows us to cope with complex multi-stage shellcode or modular malware that has several (sometimes cascading) unpacked code regions. It lets us create save points in our debug session while maintaining the same memory map so our disassembly annotations always remain aligned with the memory map in the debug session. It also allows us to suspend malware execution in one debugger and pick it up in another, provided each debugger allows thread suspend count to remain at a non-zero value before detaching.
Before closing, I’d like to give credit to Tarik Soulami for his explanation of WinDbg thread management in his book, “Inside Windows Debugging” (Microsoft Press, 2012). If you’re starting to confront more difficult debugging scenarios in your journey as a reverse engineer, I strongly encourage you to pick up “Inside Windows Debugging” to augment your repertoire and further understand the powerful debugging capabilities of WinDbg and Windows itself.
