End-to-end monitoring for web and mobile applications with Sentry
Aron Eidelman
Developer Relations Engineer, Security Advocate
Lazar Nikolov
Developer Advocate, Sentry
You can identify and fix performance issues quickly by monitoring your applications "end-to-end" using Sentry performance monitoring and Google Cloud. We’ll explore how Sentry can help identify errors and crashes in your application, and how Google Cloud can help you identify performance issues by tracking metrics such as CPU and memory usage. You can also use this information to identify potential issues and take steps to prevent them proactively.
In this blog post, you will learn:
The different parts of the monitoring chain
How they work together
The benefits of implementing full coverage instead of just focusing on systems metrics
By the end of this blog post, you will have a better understanding of why and how to monitor your applications from end-to-end and improve their availability and performance; resulting in happier users and developers alike. We will use Sentry to illustrate some points and as a resource in this blog post.
We'll cover the three main parts of the monitoring chain today for web and mobile applications: the client-side, the network, and the server-side.
Client-side monitoring
Client-side monitoring tracks how users interact with your application. It measures things like response times, error rates, and user satisfaction.
Many different factors outside of the application owner’s control may contribute to degradation in client-side performance, such as latency due to the last-mile ISP or the condition of the user’s device.
Some of the specific metrics and details that client-side monitoring can track include:
JavaScript error tracking
Performance metrics, such as:
Web vitals including First Paint, First Contentful Paint, Cumulative Layout Shift, Largest Contentful Paint, First Input Delay, Time To First Byte
Mobile vitals including App Start, Slow and Frozen frames, TTID, TTFD for mobile
Metrics such as Apdex, Failure Rate, Throughput, Latency, User Misery for all types of projects
Browser name and version
IP address
Device type (including desktop and mobile)
Release number / commit SHA
Stack trace of the error
Breadcrumbs (user navigation and interaction)
Profiling
Profiling is another important aspect of client-side monitoring. Profiling allows you to capture a snapshot of your application's resource usage, called a profile, and connect that snapshot to your codebase so you can directly map resource usage to lines of code. This helps you identify performance bottlenecks and zero in on the exact cases. The following image is a screenshot of a dashboard in Sentry that shows a profile captured during the execution of end-to-end tests of an Android app:
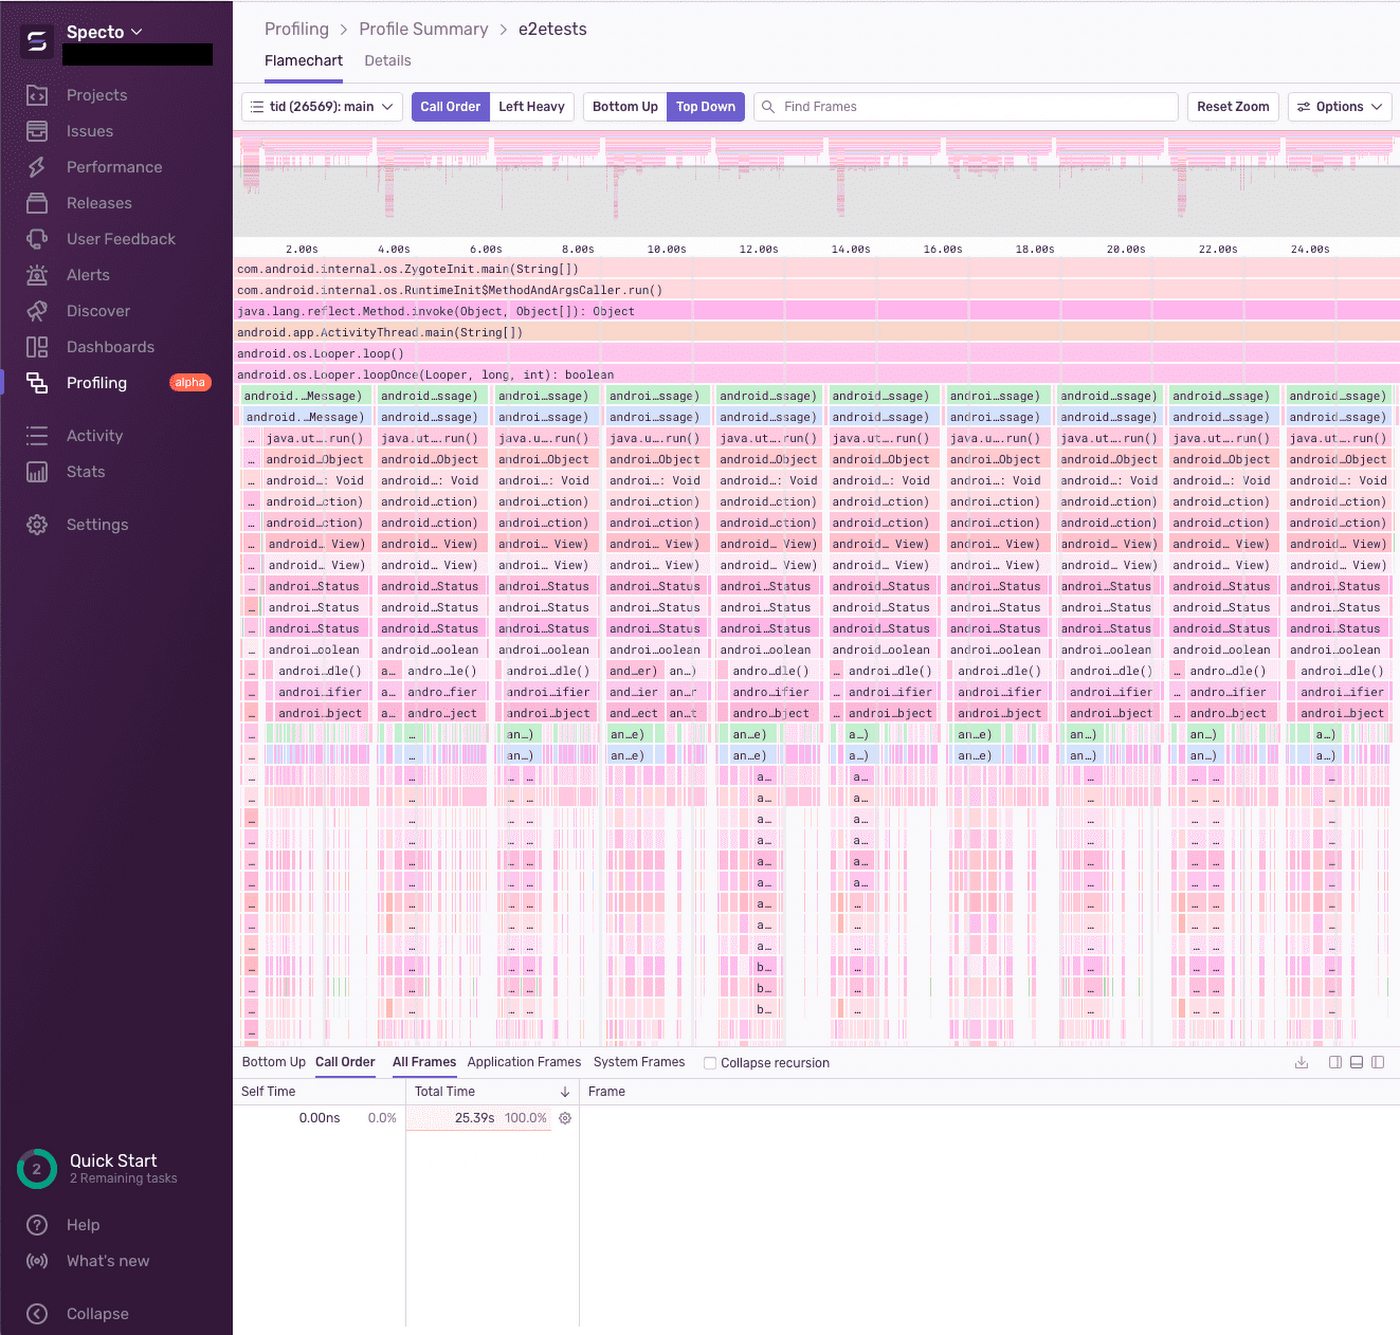

When profiling, you can choose to capture a profile for every n sessions, or you can specify a tracing sample rate. The tracing sample rate is the percentage of sessions your tool tracks. For example, if the tracing sample rate is 0.4, then 40% of sessions will be traced.
Stack traces
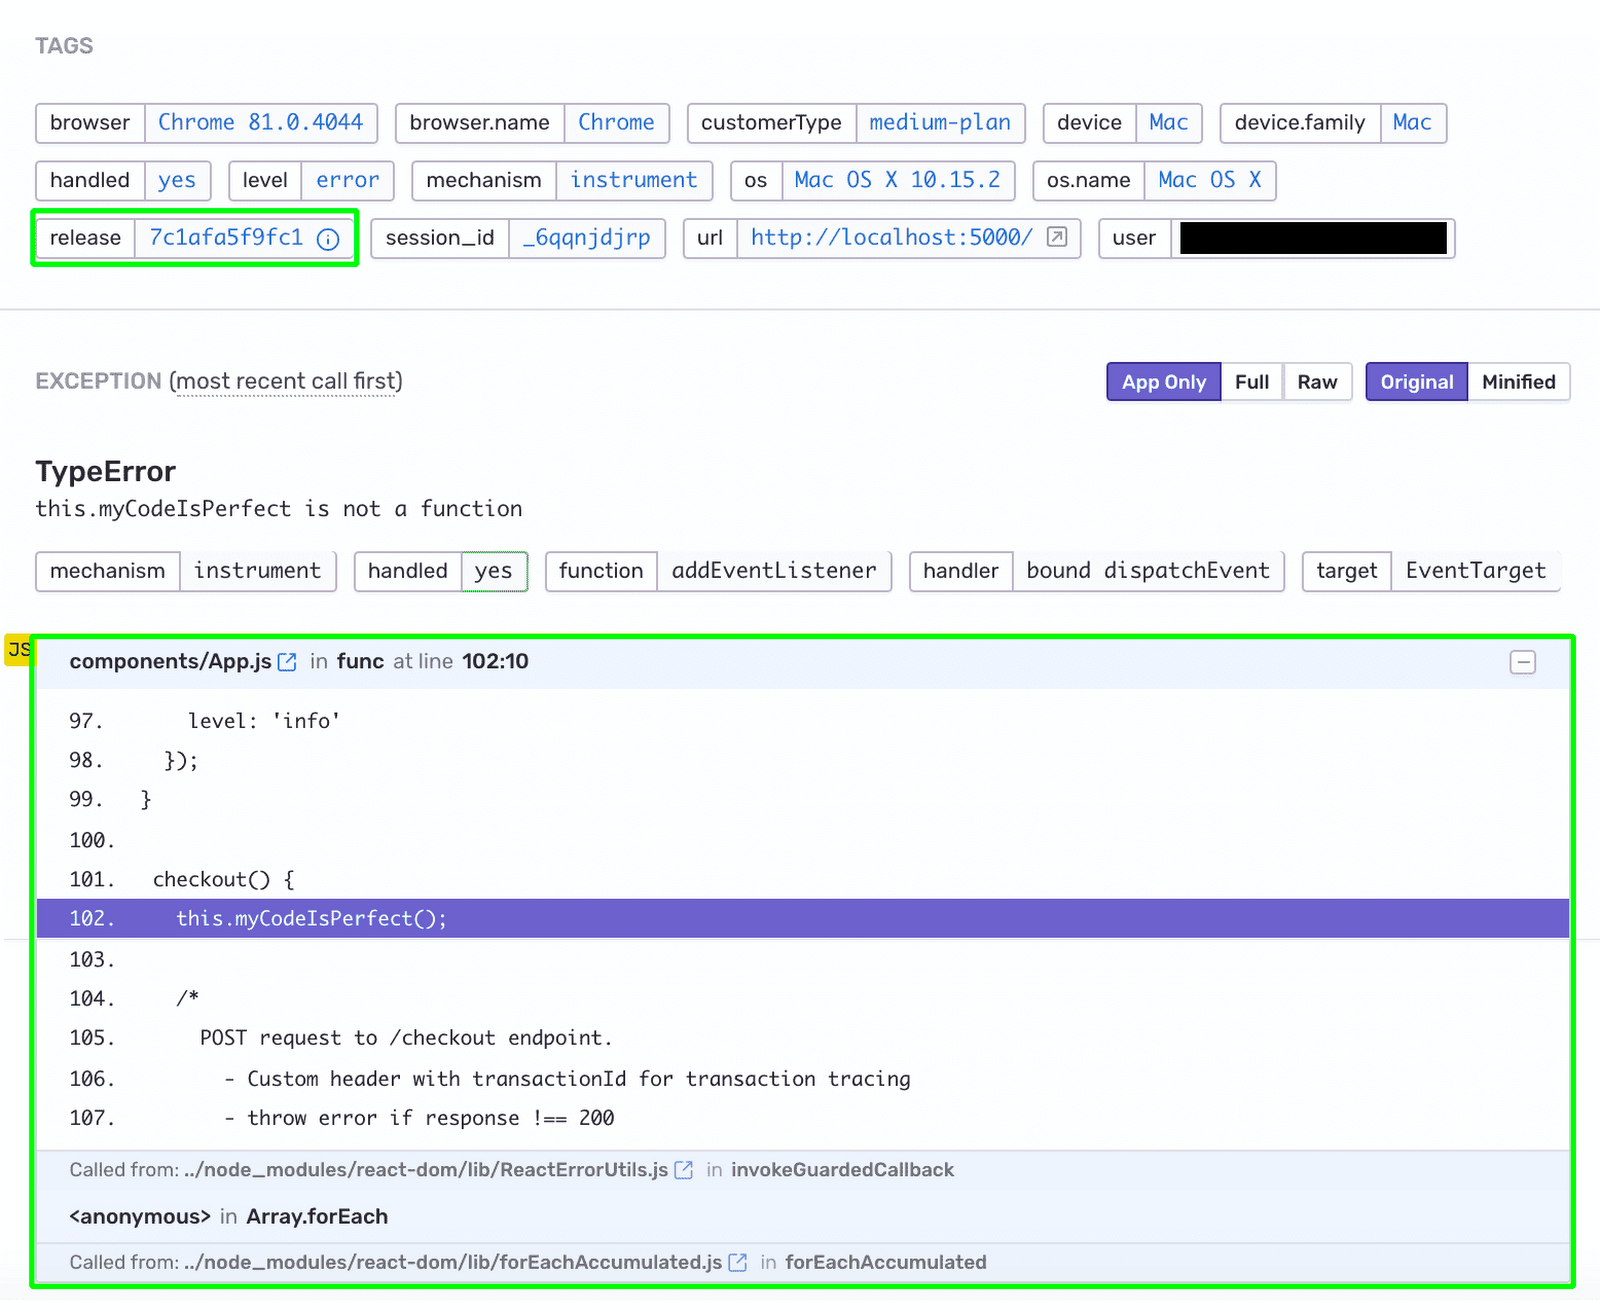
Another critical aspect of client-side monitoring is tracking stack traces. A stack trace is a list of all the functions that the application called leading up to an error, and this information can help identify the root cause of an error. The following image is a screenshot of Sentry’s Issue Details page that shows the captured stack trace of a certain error:

Session replay and user interaction tracking
Finally, client-side monitoring can also track user interactions. This information can help identify user-specific issues, such as errors that only occur on specific devices or browsers.
On mobile, client-side monitoring can snap a quick screenshot when an error happens. This ability can help us see what the user was doing when the error occurred.
For web applications, client-side monitoring can also record a session replay. This ability is a DOM recorder that captures all user interactions during a session. This information can help identify the steps that led to an error.
Overall, client-side monitoring is valuable for tracking how users interact with your application. It can help you identify performance bottlenecks, errors, and user-specific issues.
Now that we’ve considered client-side issues, we need to look at what happens between the client and our application.
Network monitoring
Network monitoring is collecting and analyzing data about a system network's performance. We can use this data to identify and troubleshoot problems, as well as plan for future capacity needs.
Many different types of metrics can help monitor a network, including:
Packet loss: The percentage of packets lost in transit.
Latency: The time it takes for a packet to travel from one point on the network to another.
Throughput: The amount of data that transfers over the network per unit of time.
Utilization: The proportion of total network resources used.
Google Cloud products that can help monitor these signals include:
Cloud Monitoring: Provides visibility into the performance, uptime, and overall health of your applications and infrastructure.
Cloud Logging: Collects and stores logs from your applications and infrastructure, so you can troubleshoot problems and identify trends.
These products can be used to collect and analyze metrics related to specific network types and applications. For example, you could use Cloud Monitoring to collect metrics on latency and throughput for a web application, or you could use Cloud Profiler to identify performance bottlenecks in a file-sharing application.
Some potential points of failure to monitor include:
Load balancers: Load balancers distribute traffic across multiple servers. If a load balancer performs incorrectly, all traffic may flood to a single server, leading to performance problems.
Content Delivery Networks (CDNs): CDNs are networks of servers that deliver content to users based on their geographic location. If a CDN fails, users in certain areas may experience slow performance or be unable to access the content.
DNS servers: DNS servers translate domain names into IP addresses. If a DNS service fails, users cannot access websites by name.
Routers: Routers route traffic between different networks. If a router fails, traffic will be unable to flow between networks.
Virtual private clouds (VPCs): VPCs are networks on public clouds used by a single organization. If a virtual private cloud fails or restricts network access, all the organization's applications and data may be unavailable.
Network monitoring can help identify and troubleshoot problems with these and other network components. By monitoring network performance, organizations can prevent outages and improve the overall reliability of their networks.
In addition to the above, network monitoring can also be used to:
Plan for capacity upgrades
Benchmark network performance
Track trends over time
Optimize network performance
Network monitoring is a critical part of maintaining a reliable and efficient network. Organizations can identify and troubleshoot problems by monitoring network performance, planning for capacity upgrades, and tracking trends over time. We can use this information to optimize network performance and improve network reliability.
Many different network monitoring tools and solutions are available, ranging from simple, free tools to complex, enterprise-grade solutions. The best tool for a particular organization will depend on the size and complexity of the network, the specific metrics that need monitoring, and the budget available.
Server-side monitoring
Server-side monitoring is the process of tracking the performance of a server and its applications. It can identify and troubleshoot problems while ensuring that the server is meeting performance expectations.
There are two main server-side metric types: system and application.
System monitoring tracks the performance of the hardware components, such as the CPU, memory, disk, and throughput. This monitoring type can help identify problems with the server's hardware or software, such as a failing hard drive or a software bug.
Application monitoring tracks the performance of the software components, such as web apps, databases, and email servers. This monitoring type can help identify problems with the application's code, such as a memory leak or a race condition.
Here are some other things that count as "server-side" monitoring:
Application performance: includes things like page load times, error rates, and user satisfaction.
Intra-application latency: the time it takes for requests to process within an application.
Uptime Checks: whether or not the application is reachable, using an imitation of a user request
Crons: These are scheduled tasks that run regularly.
Google Cloud Monitoring provides features for server-side monitoring (especially system metrics) by collecting data from many different compute offerings, including:
Google Cloud Monitoring also provides a variety of alerting options, so you can be notified of potential problems as soon as they occur.
Why end-to-end monitoring works
By combining client-side monitoring, network monitoring, and server-side monitoring, you can get a clearer picture of the performance of an application to efficiently identify and fix problems quickly.
In some situations, such as determining the causes for round-trip time (RTT), it helps to have deep observability of each aspect of the whole request flow.
One implementation of this concept is distributed tracing, which tracks the flow and timing of requests as they pass through our system. That awareness helps us understand the system’s performance and identify bottlenecks throughout the chain of connections.
Each part of the request flow can provide context to the others, so there are fewer gaps or mysteries when troubleshooting. Knowing what you are monitoring enables you to develop a standard step-by-step approach before an issue occurs so that you have a reliable guide once something happens.
An example of end-to-end monitoring
If you are troubleshooting a slow response time, you can use Distributed Tracing to see which parts of the request flow are taking the longest. This can help you identify the specific component that is causing the problem.
Similarly, if you are troubleshooting a dropped connection, you can use Distributed Tracing to see which part of the request flow was interrupted. This can help you identify the specific step in the process that failed.
By understanding the entire request flow, you can quickly and easily troubleshoot any problems that occur.
Consider the following scenario. Users start to experience an issue navigating a site that they frequently visit. The developer gets alerted to a spike in errors when the client makes a request that goes through Cloud CDN. Here are the steps they use for debugging:
The developer first checks the client-side monitoring data to see whether a specific browser, device type, or IP range is affected. They know the problem occurs consistently across platforms and locations but started happening at a particular time.
The developer then checks the network monitoring data to see what happens between the user's browser and the server. In this case, the network monitoring shows that the failed request happens between Cloud CDN and the client relatively early in the request-response cycle.
The developer then checks the server-side monitoring data to see what is happening on the server. They see a recent deployment coinciding with the time the errors started to occur. Everything is fine server-side, so they deduce the problem relates to the deployment and Cloud CDN.
The developer discovered that some of the code used to create a cookie for the client had been altered and that clients were no longer sending the cookie; hence reverting the change and finding a more stable way to deploy it will unblock them.
Using client-side monitoring, network monitoring, and server-side monitoring in tandem, the developer could quickly identify the root cause of the issue: the ability to generate the cookie had been removed in a recent deployment.
From there, they can roll back the deployment, implement, test, and then redeploy.
Ideally, they could use their monitoring to automate rollback in future situations where similar issues occur. For example, if errors start to spike after a new deployment, roll back to the previous one while debugging takes place.
Better yet, they can make a pre-production environment as close to production as possible for testing and to implement monitoring (even in a pre-prod environment) to help ensure they have the highest fidelity testing possible.
Want to give this a try? Check out this quick 7-part YouTube series on Distributed Tracing using a real Next.js application example.
The 5 key benefits of end-to-end monitoring
Beyond help in troubleshooting, there are many benefits to end-to-end monitoring that justify the time and focus it takes to implement, including:
Identifying bottlenecks to improve performance: By tracing the requests and operations between and within different parts of our application, distributed tracing can help to identify where and which factors are causing the most performance problems.
Reducing time to respond to issues: By clearly identifying how each part of a system is behaving, it becomes easier to move from symptoms to causes consistently, allowing runbooks and step-by-step troubleshooting.
Improving user satisfaction: By tracking the user experience, end-to-end monitoring can help identify and fix the problems causing users to have a negative experience with an application, no matter where those issues originate from or what team is responsible for managing them.
Comparing to competitors and tracking performance: By tracking the performance of an application relative to its competitors, end-to-end monitoring can help to identify the areas in which the application can improve.
Making informed decisions: By providing a comprehensive view of the performance of an application, end-to-end monitoring can help to make informed decisions about the application, such as whether to invest in new features, make changes to the infrastructure, or hire more people.-
If you want to improve your application's performance, reliability, and user experience, consider implementing end-to-end monitoring with Sentry. It is a powerful tool that can give you the data and insights you need to make informed decisions about your application.
You can check out the free YouTube series where Lazar, Sentry Developer Advocate, walks you through creating a Next.js app, instrumented with Sentry and demonstrating distributed tracing. Before jumping into the course, consider signing up for Sentry. To make it easier for you to give Sentry a try, if you register a new org with Sentry using this sign up link, you will get a $75 credit.
