Introducing Sqlcommenter: An open source ORM auto-instrumentation library
Bala Chandrasekeran
Software Engineer
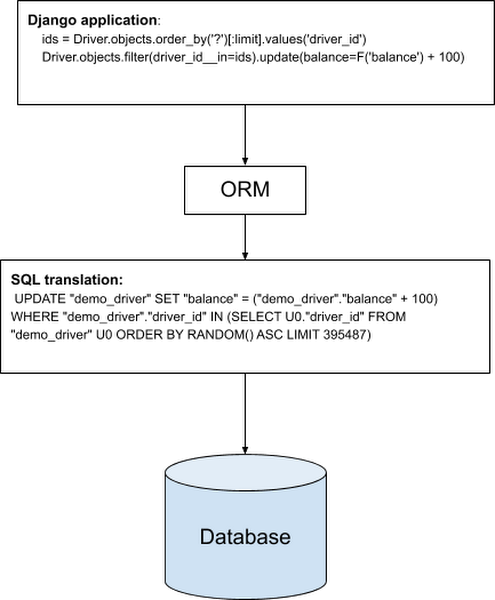
Object-relational mapping (ORM) helps developers to write queries using an object-oriented paradigm, which integrates naturally with application code in their preferred programming language. Many full-stack developers rely on ORM tools to write database code in their applications, but since the SQL statements are generated by the ORM libraries, it can be harder for application developers to understand the application code resulting in slow query. The following example shows a snippet of code where 2 lines of Django application code are translated by an ORM library to a single SQL statement.
Introducing Sqlcommenter
Today, we are introducing Sqlcommenter, an open source library that addresses the gap between the ORM libraries and understanding database performance. Sqlcommenter gives application developers visibility into which application code is generating slow queries and maps application traces to database query plans.
Sqlcommenter is an open source library that enables ORMs to augment SQL statements before execution, with comments containing information about the code that caused its execution. This helps in easily correlating slow queries with source code and giving insights into backend database performance. In short, it provides observability into the state of client-side applications and their impact on database performance. Application developers need to do very little application code change to enable Sqlcommenter for their applications using ORMs. Observability information from Sqlcommenter can be used by application developers directly using slow query logs, or it can be integrated into other products or tools, such as Cloud SQL Insights, to provide application-centric monitoring.
Getting started with Sqlcommenter
Sqlcommenter is available for Python, Java, Node.js and Ruby languages and supports Django, Sqlalchemy, Hibernate, Knex, Sequelize and Rails ORMs. Let’s go over an example of how to enable Sqlcommenter for Django and look at how it helps to analyze Django application performance.
Python Installation
Sqlcommenter middleware for Django can be installed using the pip3 command.
pip3 install --user google-cloud-sqlcommenter
Enabling Sqlcommenter for Django
To enable Sqlcommenter in a Django application, you can edit yoursettings.py file to include google.cloud.sqlcommenter.django.middleware.SqlCommenter in the MIDDLEWARE section:Augment slow query logs with ORM information
Slow query logs provided by databases like PostgreSQL and MySQL help in finding and troubleshooting slow running queries. For example, in PostgreSQL, you can set the log_min_duration_statement database flag, and PostgreSQL will log the queries where the duration is equal or greater than the value specified in log_min_duration_statement.
By augmenting slow query logs with application tags from the ORM, Sqlcommenter helps developers determine what application code is associated with a slow query. Here is an example of a query log from a PostgreSQL database that is used by a Django application with Sqlcommenter for Django enabled.
In the above log, you can see an UPDATE statement being executed. At the end of the SQL statement, SQL style comments have been added in the form of key=value pairs, and we call the keys application tags. This comment is added by Sqlcommenter to the SQL query that was generated by the Django ORM.
As you can see from the comments, it provides information about the controller, which in this example is “assign_order.” This is the controller method that sent the query. In the case of Django, the Controller in an MVC pattern maps to the View in a Django application. It also provides information about the Route through which this View in Django was called. Using this information, application developers can immediately relate which View method created this query. Since this query has taken 400 msec, an application developer can reason why this query created by the “assign_order” View method is expensive.
Trace ORMs with OpenTelemetry integration
Sqlcommenter allows OpenCensus and OpenTelemetry trace context information to be propagated to the database, enabling correlation between application traces and database query plans.
The following example shows a query log with SQL comments added by Sqlcommenter for the Sequelize ORM.
From the example query log above, you can see traceparent tags as part of the comment. The traceparent application tag is based on W3C Trace Context, which defines the standard for trace context propagation with trace id and span id. The traceparent application tag is created by Sqlcommenter using the context. Using the query log and traces from applications, application developers can relate their traces to a specific query. For more information on Context and Trace propagation, please see the OpenTelemetry specification.
Application-centric monitoring with Cloud SQL Insights with the help of Sqlcommenter
Let us look at how the recently launched Cloud SQL Insights integrated with Sqlcommenter to help developers quickly understand and resolve query performance issues on Cloud SQL. Cloud SQL Insights helps you detect and diagnose query performance problems for Cloud SQL databases. It provides self-service, intuitive monitoring, and diagnostic information that goes beyond detection to help you to identify the root cause of performance problems.
You can monitor performance at an application level and trace the source of problematic queries across the application stack by model, view, controller, route, user, and host. Cloud SQL Insights uses the information sent by Sqlcommenter to identify the top application tags (controller, route, etc.) that are sent by the application.
The following example is an Insights dashboard for the Cloud SQL instance connected to the Django application we saw earlier. As you can see from the table in the screenshot below, top controller and route application tags are provided along with the other metrics for the application tags. These application tags are generated by the Sqlcommenter enabled in the Django application and Cloud SQL PostgreSQL uses these tags to identify the top application tags. This information is shown in the Cloud SQL Insights dashboard and also exported to Cloud Monitoring.
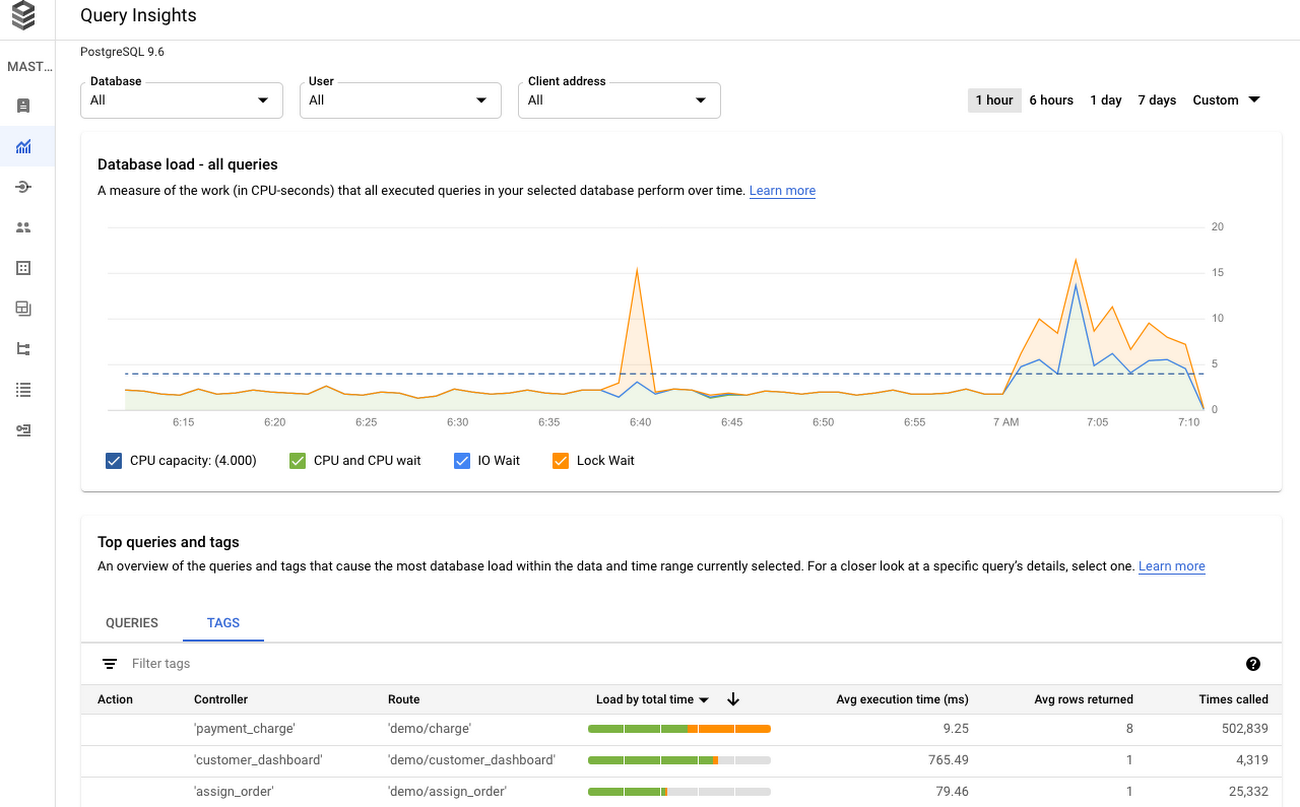
The “assign_order” controller, which we saw earlier, is shown along with the route “demo/assign_order” as one of the top tags that is contributing to the database load. For more details on you can use Insights, see the Cloud SQL Insights documentation.
Using end-to-end traces in Cloud SQL Insights
One issue with using query logs with traceparent is that it’s hard to visualize the query plan and application traces. With Cloud SQL Insights, query plans are generated as Cloud Traces with the traceparent context information from the SQL comments. Since the trace id is created by the application, and the parent span id is sent to the database as SQL comments, end-to-end tracing from application to database is now possible. You can visualize the end-to-end trace with a query plan as spans in the Cloud Trace dashboard. The example below shows application trace spans from OpenTelemetry along with query plan trace spans from the NodeJS Express Sqlcommenter library .
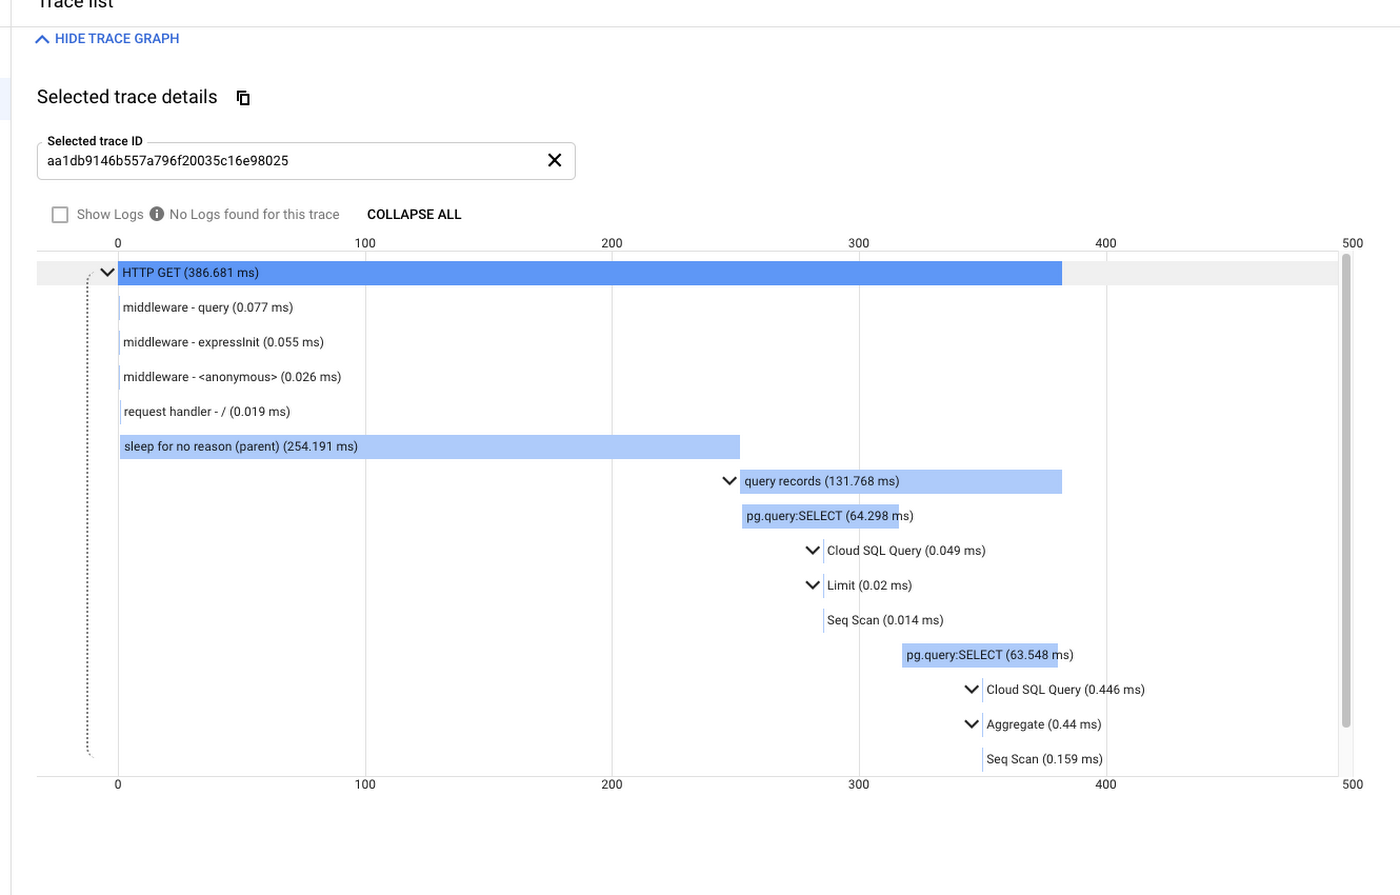
Using this information, application developers can not only know the queries created by their application code, they can relate the query plan with application traces to diagnose their application performance issues.
You can access these traces in Cloud SQL Insights by selecting an item in the Top Tags table.
Summary
Sqlcommenter provides application developers using ORM tools the ability to diagnose performance issues in their application code impacting databases. With Cloud SQL Insights' integration with Sqlcommenter, application developers can visualize the top application tags contributing to database load as well as trace end to end application performance problems. For more information on languages and ORM support for Sqlcommenter, or if you would like to contribute to the project, please visit the Sqlcommenter github repo.