How to optimize training performance with the TensorFlow Profiler on Vertex AI
Nikita Namjoshi
Developer Advocate
Bruno Mendez
Software Engineer, GCP Cloud AI and Industry Solutions
Here are five ways you can use the TensorFlow Profiler on Vertex AI to debug bottlenecks and make your training jobs run faster
Training ML models can be computationally expensive. If you’re training models on large datasets, you might be used to model training taking hours, or days, or even weeks. But it’s not just a large volume of data that can increase training time. Nonoptimal implementations such as an inefficient input pipeline or low GPU usage can dramatically increase your training time.
Making sure your programs are running efficiently and without bottlenecks is key to faster training. And faster training makes for faster iteration to reach your modeling goals. That’s why we're excited to introduce the TensorFlow Profiler on Vertex AI, and share five ways you can gain insights into optimizing the training time of your model. Based on the open source TensorFlow Profiler, this feature allows you to profile jobs on the Vertex AI training service in just a few steps.
Let’s dive in and see how to set this feature up, and what insights you can gain from inspecting a profiling session.
Setting up the TensorFlow Profiler
Before you can use the TensorFlow Profiler, you’ll need to configure Vertex AI TensorBoard to work with your custom training job. You can find step by step instructions on this setup here. Once TensorBoard is set up, you’ll make a few changes to your training code, and your training job config.
Modify training code
First, you’ll need to install the Vertex AI Python SDK with the cloud_profiler plugin as a dependency for your training code. After installing the plugin, there are three changes you’ll make to your training application code.
First, you’ll need to import the cloud_profiler in your training script:
Then, you’ll need to initialize the profiler with cloud_profiler.init(). For example:
Finally, you’ll add the TensorBoard callback to your training loop. If you’re already a Vertex AI TensorBoard user, this step will look familiar.
You can see an example training script here in the docs.
Configure Custom Job
After updating your training code, you can create a custom job with the Vertex AI Python SDK.
Then, run the job specifying your service account and TensorBoard instance.
Capture Profile
Once you launch your custom job, you’ll be able to see it in the Custom jobs tab on the Training page.
When your training job is in the Training / Running state, a new experiment will appear in the experiments page, click it to open your TensorBoard Instance.
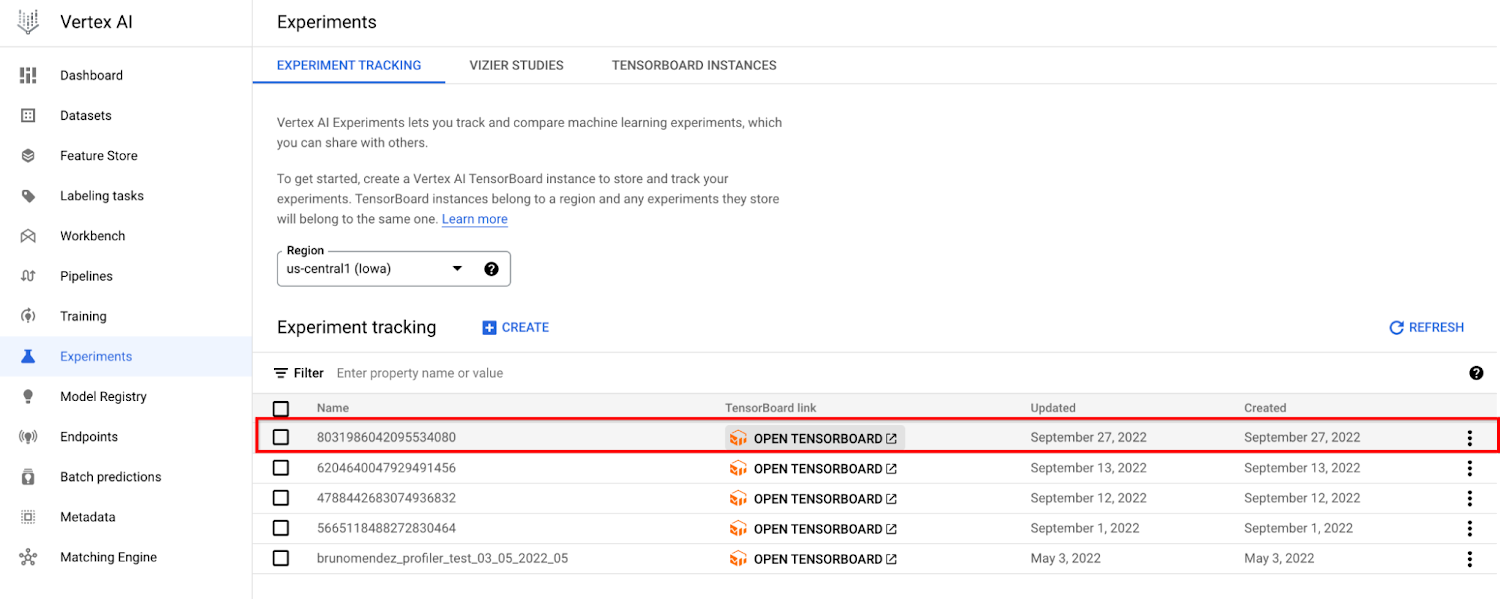

- Once you’re there go to the Profiler tab and click Capture profile
- In the Profile Service URL(s) or TPU name field, enter
workerpool0-0 - Select IP address for the Address type
- Click CAPTURE
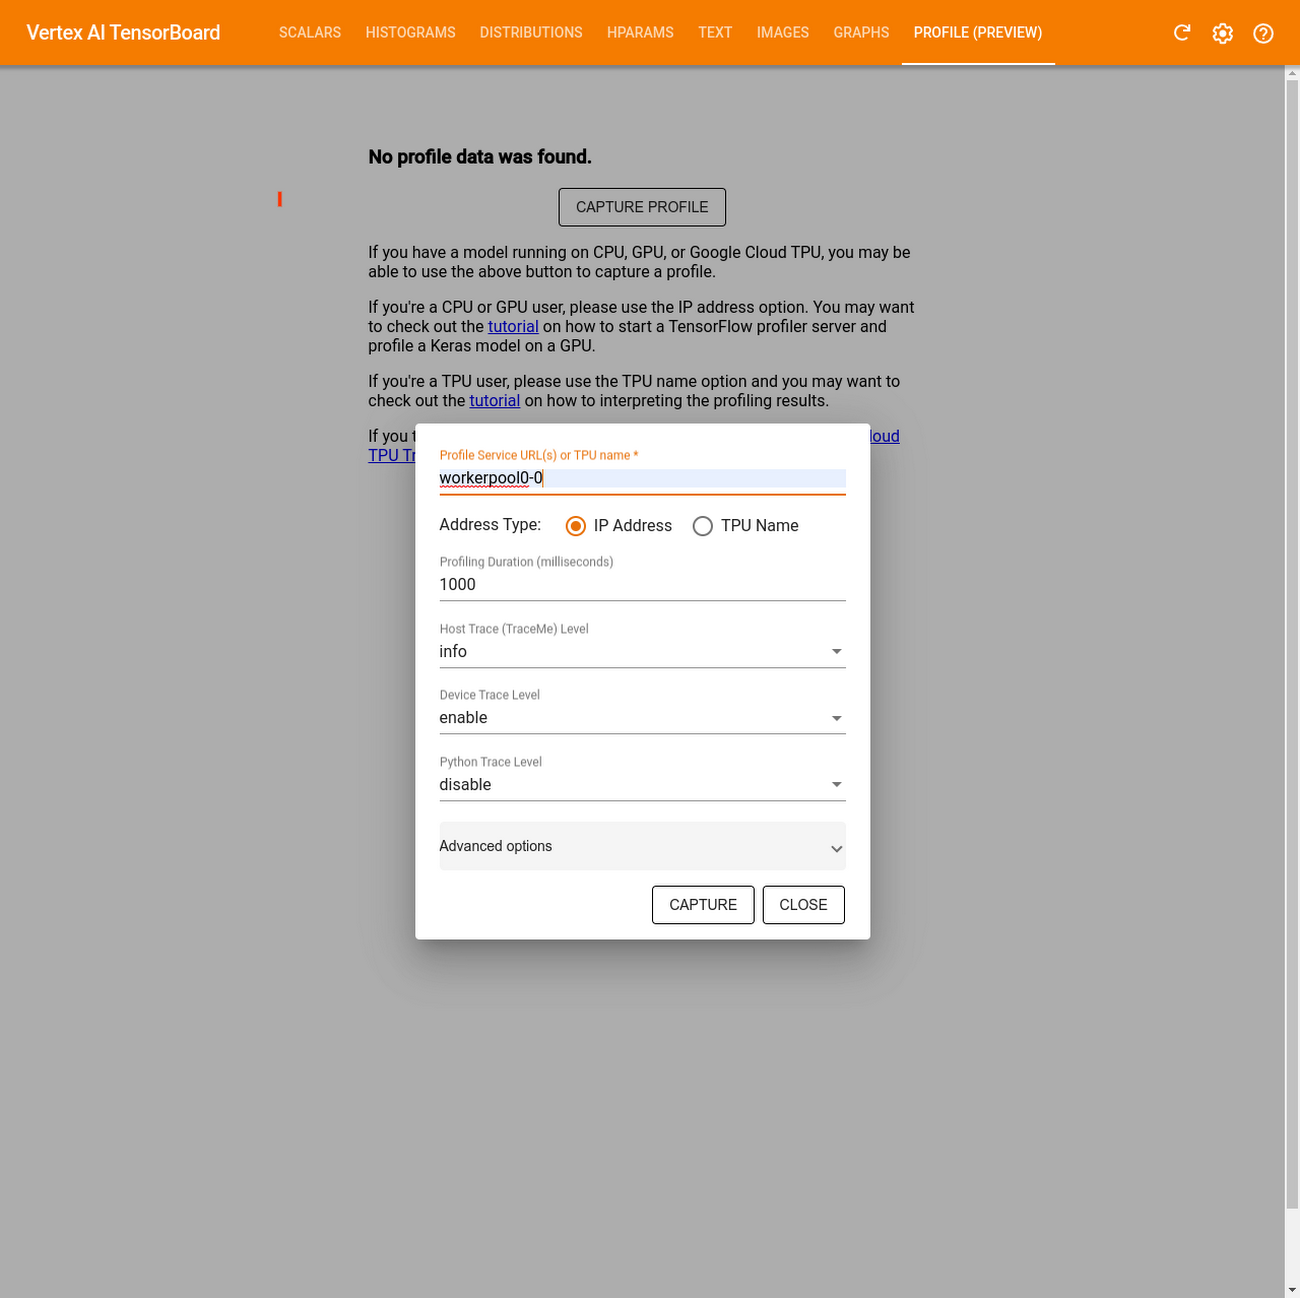

Note that you can only complete the above steps when your job is in the Training/Running state.
Using the TensorBoard Profiler to analyze performance
Once you’ve captured a profile, there are numerous insights you can gain from analyzing the hardware resource consumption of the various operations in your model. These insights can help you to resolve performance bottlenecks and, ultimately, make the model execute faster.
The TensorFlow Profiler provides a lot of information and it can be difficult to know where to start. So to make things a little easier, we’ve outlined five ways you can get started with the profiler to better understand your training jobs.
Get a high level understanding of performance with the overview page
The TensorFlow Profiler includes an overview page that provides a summary of your training job performance.
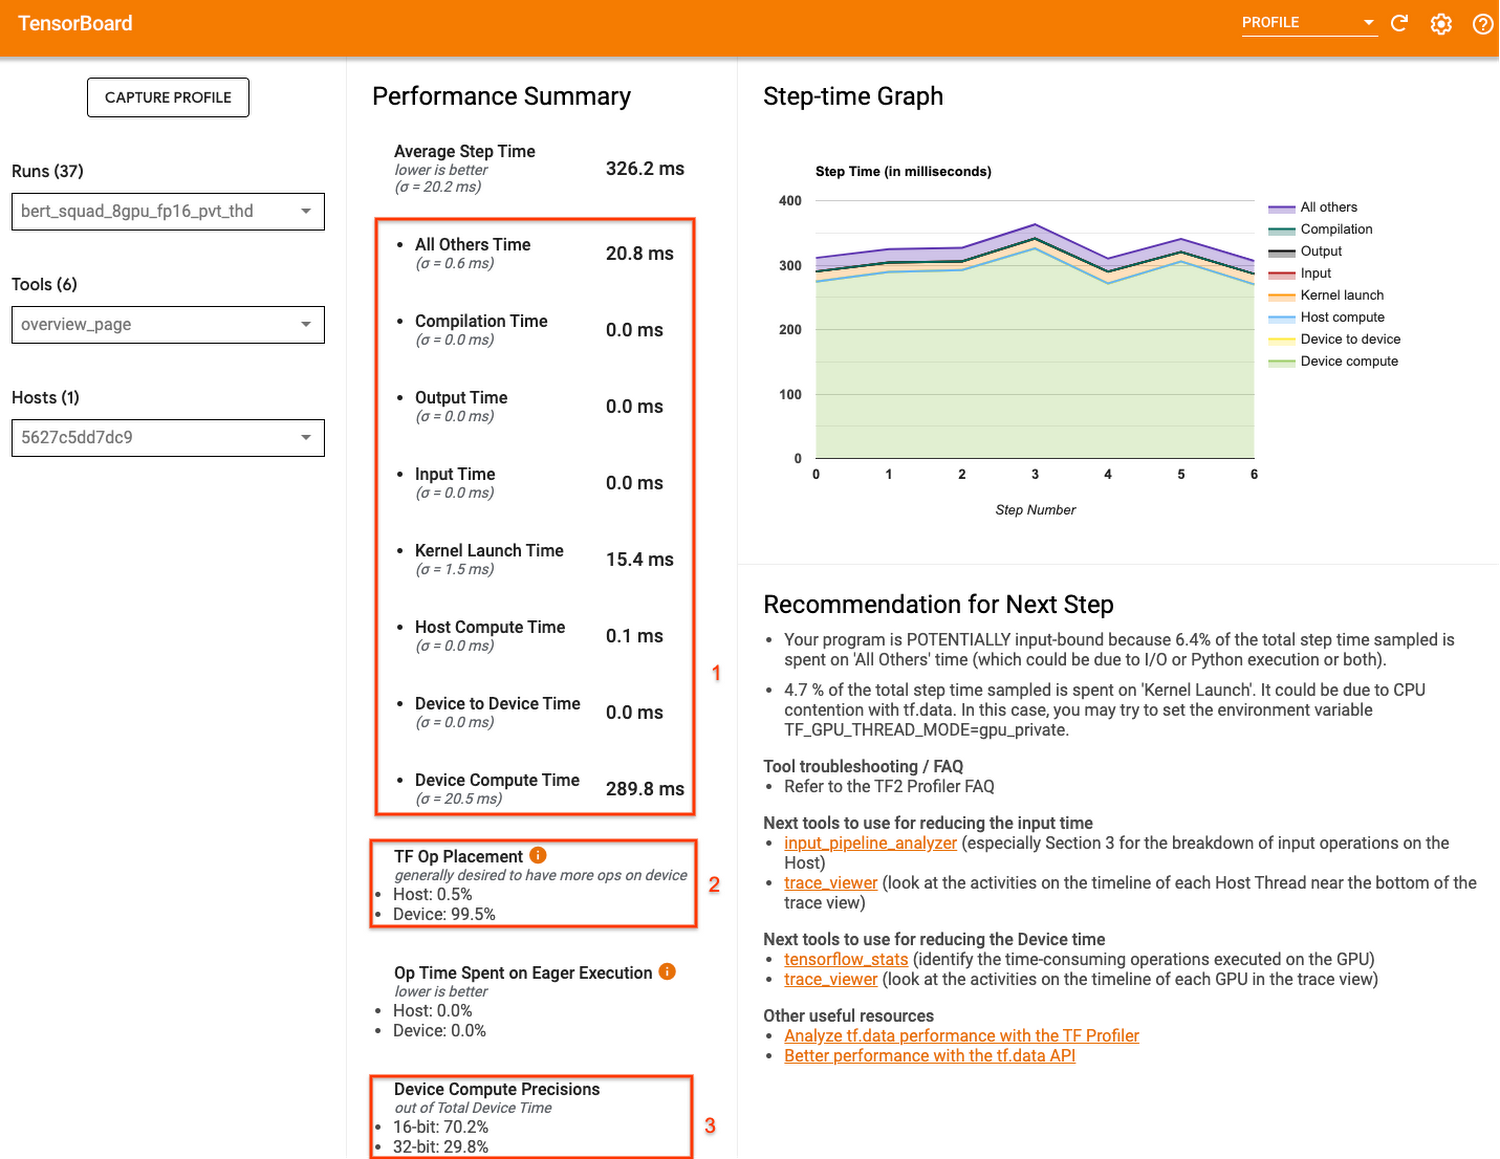

Don’t get overwhelmed by all the information on this page! There are three key numbers that can tell you a lot: Device Compute Time, TF Op placement, and Device Compute Precision.
The device compute time lets you know how much of the step time is from actual device execution. In other words, how much time did your device(s) spend on the computation of the forward and backward passes, as opposed to sitting idle waiting for batches of data to be prepared. In an ideal world, most of the step time should be spent on executing the training computation instead of waiting around.
The TF op placement tells you the percentage of ops placed on the device (eg GPU), vs host (CPU). In general you want more ops on the device because that will be faster.
Lastly, the device compute precision shows you the percentage of computations that were 16 bit vs 32 bit. Today, most models use the float32 dtype, which takes 32 bits of memory. However, there are two lower-precision dtypes–float16 and bfloat16– which take 16 bits of memory instead. Modern accelerators can run operations faster in the 16-bit dtypes. If a reduced accuracy is acceptable for your use case, you can consider using mixed precision by replacing more of the 32 bit opts by 16 bit ops to speed up training time.
You’ll notice that the summary section also provides some recommendations for next steps. So in the following sections we’ll take a look at some more specialized profiler features that can help you to debug.
Deep dive into the performance of your input pipeline
After taking a look at the overview page, a great next step is to evaluate the performance of your input pipeline, which generally includes reading the data, preprocessing the data, and then transferring data from the host (CPU) to the device (GPU/TPU).
GPUs and TPUs can reduce the time required to execute a single training step. But achieving high accelerator utilization depends on an efficient input pipeline that delivers data for the next step before the current step has finished. You don’t want your accelerators sitting idle as the host prepares batches of data!
The TensorFlow Profiler provides an Input-pipeline analyzer that can help you determine if your program is input bound. For example, the profile shown here indicates that the training job is highly input bound. Over 80% of the step time is spent waiting for training data. By preparing the batches of data before the next step is finished, you can reduce the amount of time each step takes, thus reducing total training time overall.
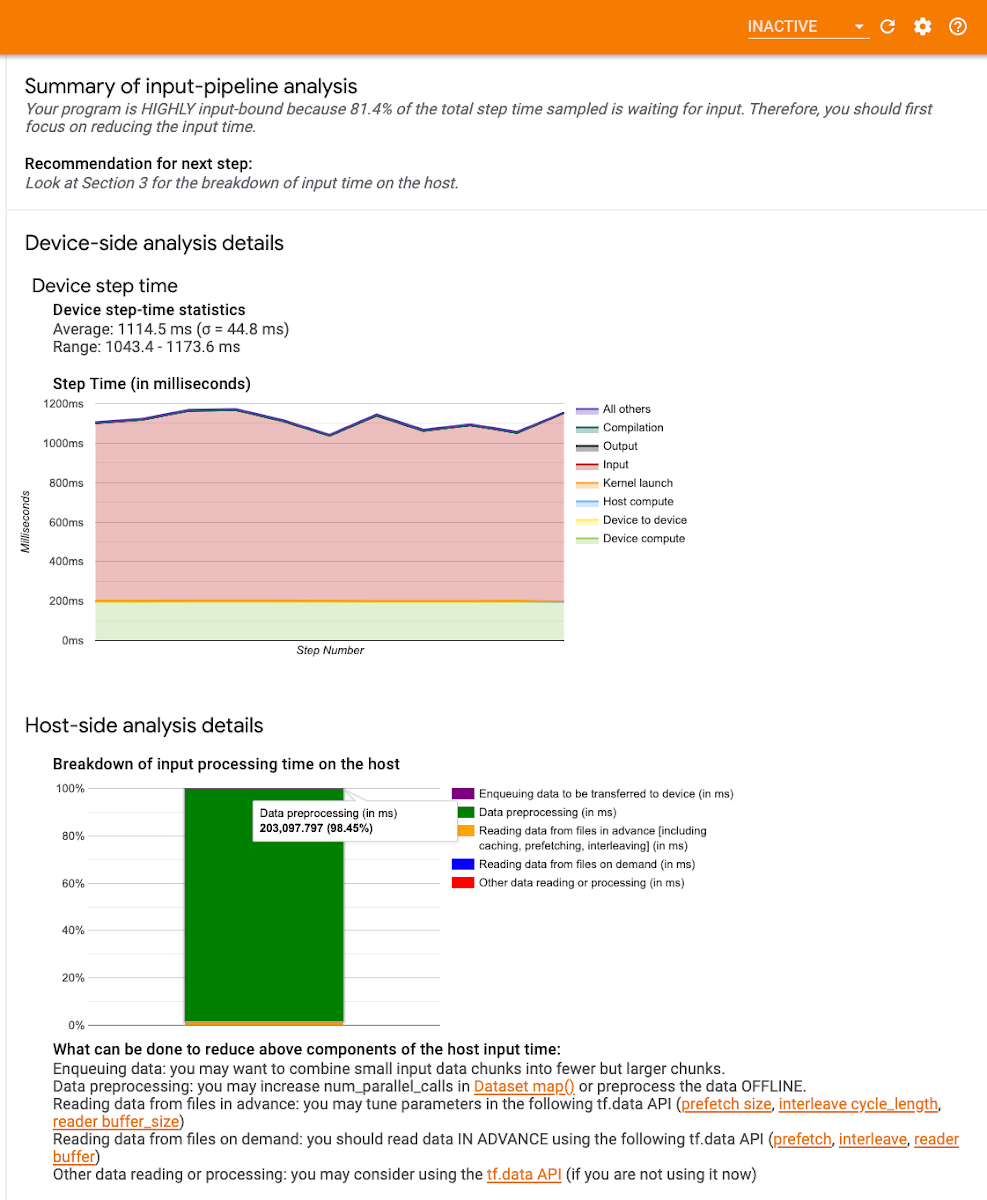

Input-pipeline analyzer
This section of the profiler also provides more insights into the breakdown of step time for both the device and host.
For the device-side graph, the red area corresponds to the portion of the step time the devices were sitting idle waiting for input data from the host. The green area shows how much of the time the device was actually working. So a good rule of thumb here is that if you see a lot of red, it’s time to debug your input pipeline!
The Host-side analysis graph shows you the breakdown of processing time on the CPU. For example, the graph shown here is majority green indicating that a lot of time is being spent preprocessing the data. You could consider performing these operations in parallel or even preprocess the data offline.
The Input-pipeline analyzer even provides specific recommendations. But to learn more about how you can optimize your input pipeline, check out this guide or refer to the tf.data best practices doc.
Use the trace viewer to maximize GPU utilization
The profiler provides a trace viewer, which displays a timeline that shows the durations for the operations that were executed by your model, as well as which part of the system (host or device) the op was executed. Reading traces can take a bit of time to get used to, but once you do you’ll find that they are an incredibly powerful tool for understanding the details of your program.
When you open the trace viewer, you’ll see a trace for the CPU and for each device. In general, you want to see the host execute input operations like preprocessing training data and transferring it to the device. On the device, you want to see the ops that relate to actual model training.
On the device, you should see timelines for three stream:
- Stream 13 is used to launch compute kernels and device-to-device copies
- Stream 14 is used for host-to-device copies
- Stream 15 for device to host copies.
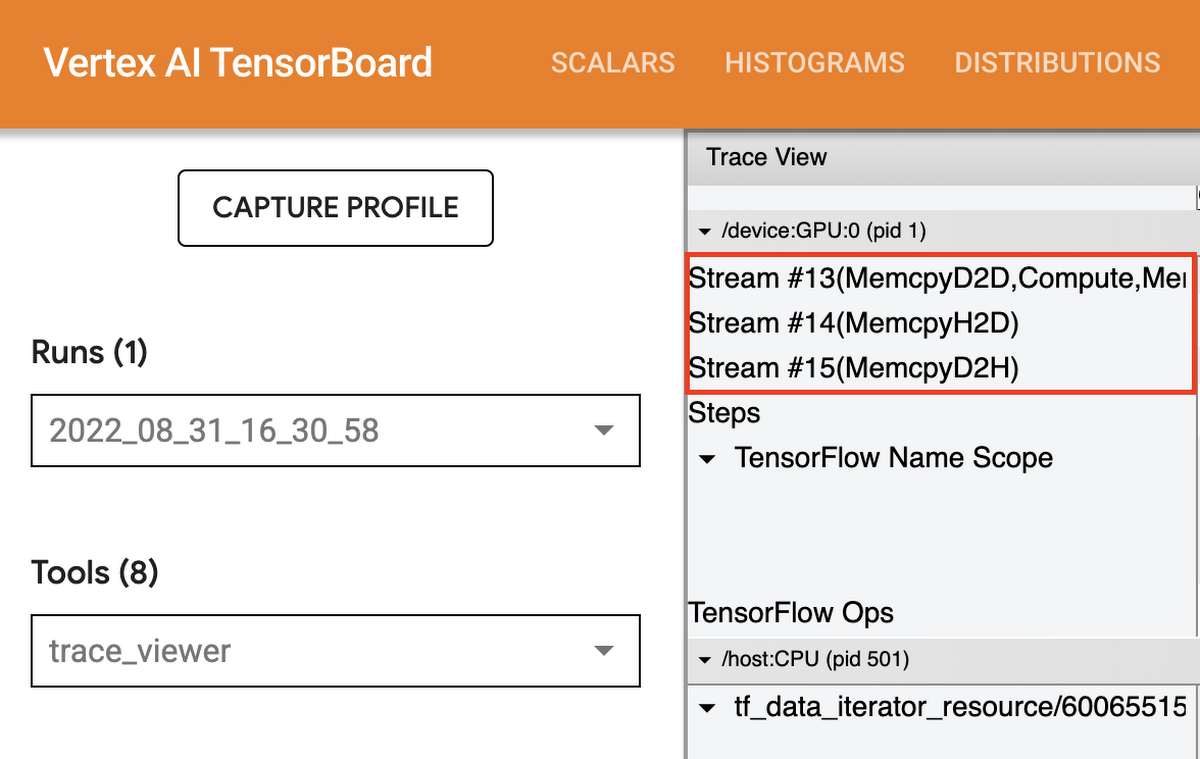

Trace viewer streams
In the timeline, you can see the duration for your training steps. A common observation when your program is not running optimally is gaps between training steps. In the image of the trace view below, there is a small gap between the steps.
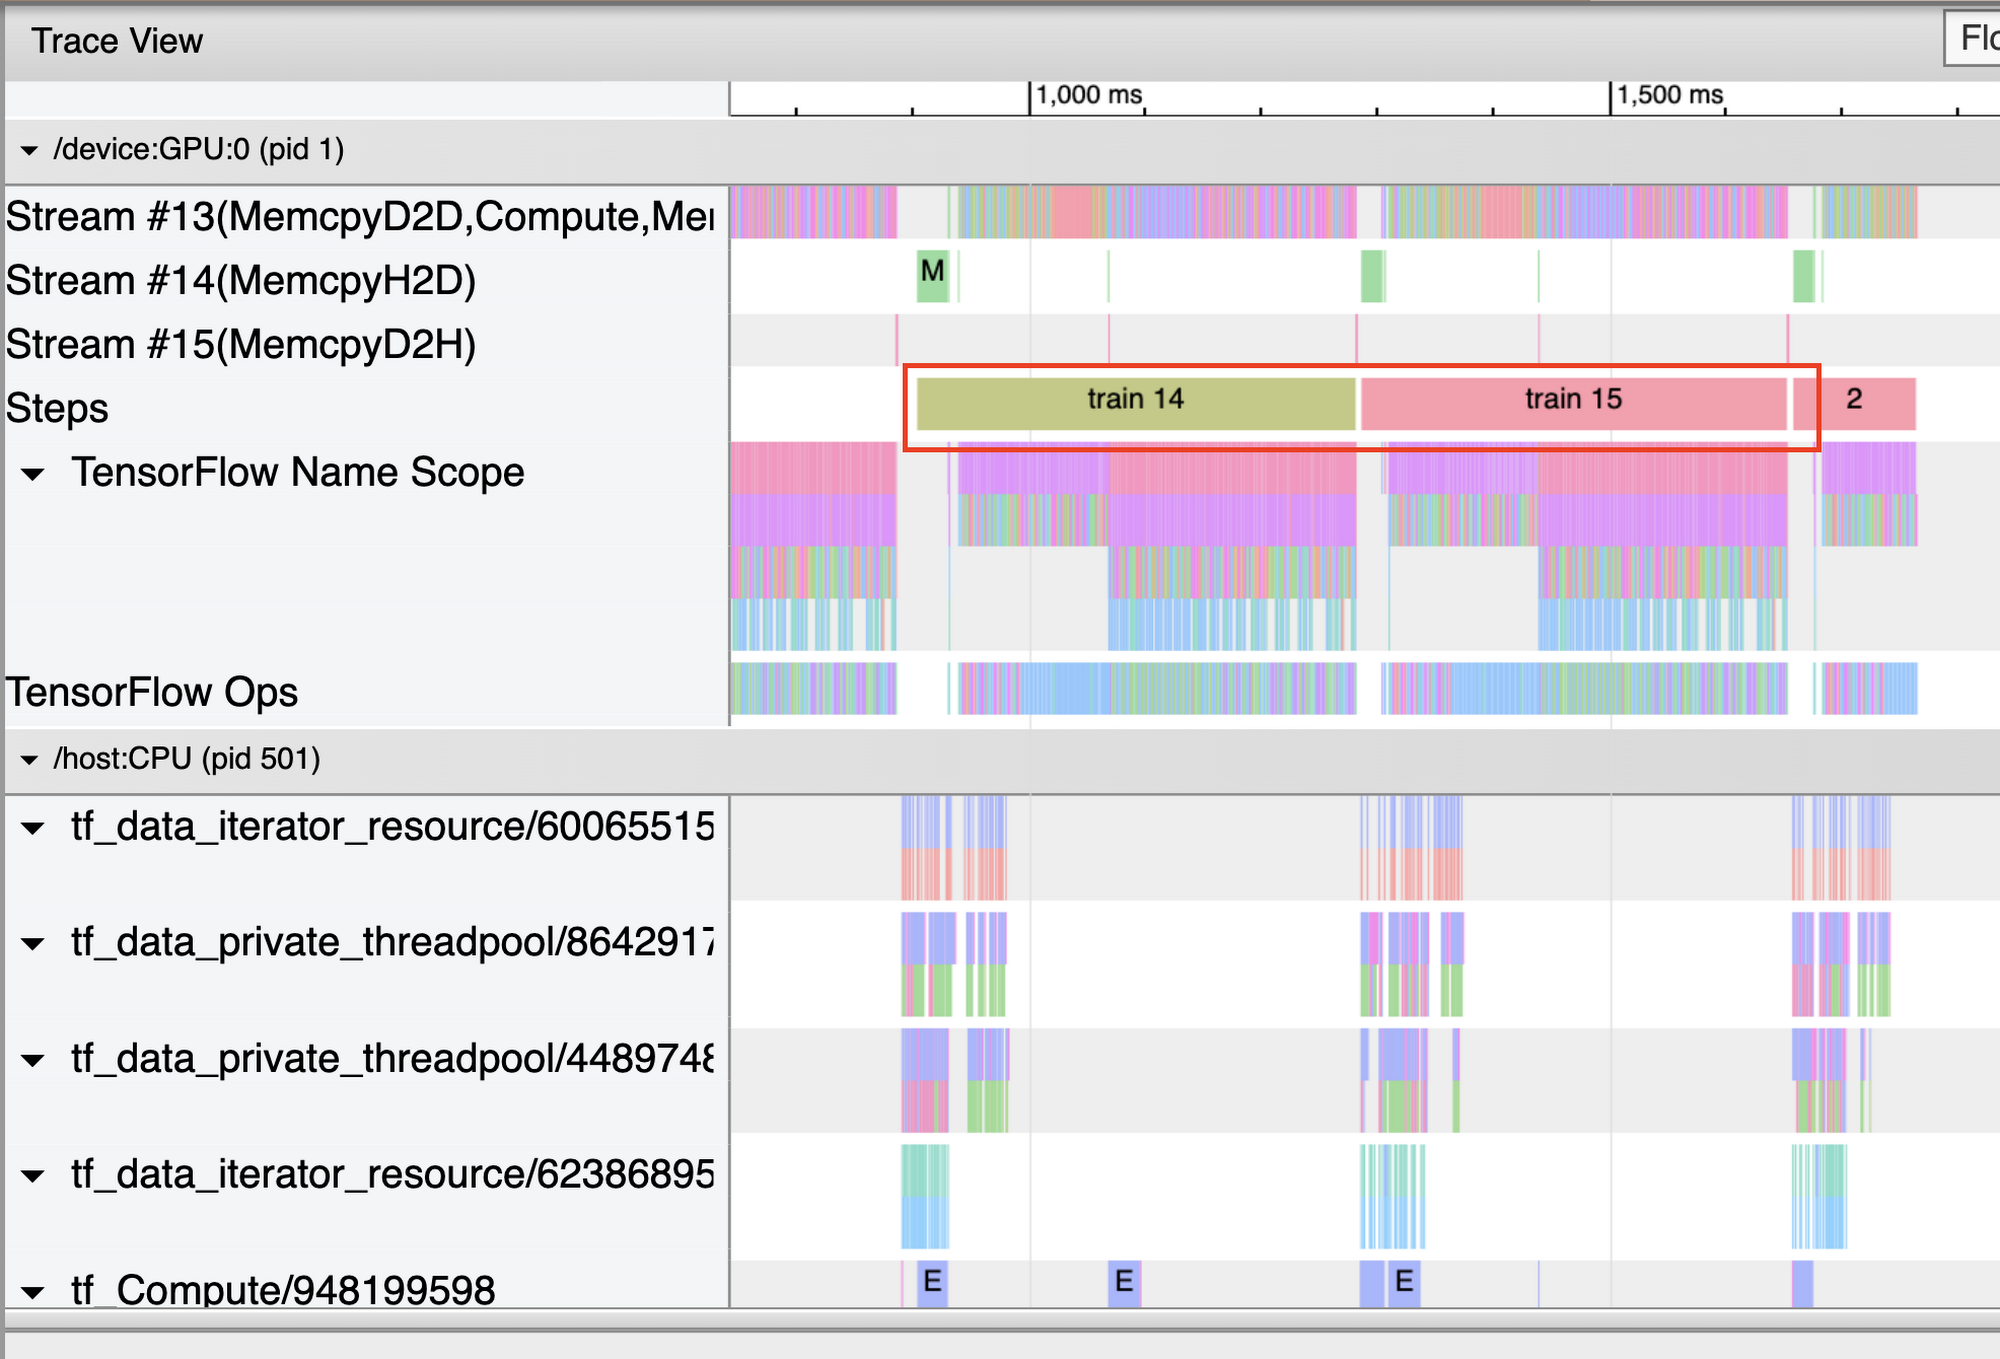

Trace viewer steps
But if you see a large gap as shown in the image below, your GPU is idle during that time. You should double check your input pipeline, or make sure you aren’t doing unnecessary calculations at the end of each step (such as executing callbacks).


For more ways to use the trace viewer to understand GPU performance, check out the guide in the official TensorFlow docs.
Debug OOM issues
If you suspect your training job has a memory leak, you can diagnose it on the memory profile page. In the breakdown table you can see the active memory allocations at the point of peak memory usage in the profiling interval.


In general, it helps to maximize the batch size, which will lead to higher device utilization, and if you’re doing distributed training, amortize the costs of communication across multiple GPUs. Using the memory profiler helps get a sense of how close your program is to peak memory utilization.
Optimize gradient AllReduce for distributed training jobs
If you’re running a distributed training job and using a data parallelism algorithm, you can use the trace viewer to help optimize the AllReduce operation. For synchronous data parallel strategies, each GPU computes the forward and backward passes through the model on a different slice of the input data. The computed gradients from each of these slices are then aggregated across all of the GPUs and averaged in a process known as AllReduce. Model parameters are updated using these averaged gradients.
When going from training with a single GPU to multiple GPUs on the same host, ideally you should experience the performance scaling with only the additional overhead of gradient communication and increased host thread utilization. Because of this overhead, you will not have an exact 2x speedup if you move from 1 to 2 GPUs, for example.
You can check the GPU timeline in your program's trace view for any unnecessary AllReduce calls, as this results in a synchronization across all devices. But you can also use the trace viewer to get a quick check as to whether the overhead of running a distributed training job is as expected, or if you need to do further performance debugging.
The time to AllReduce should be:
(number of parameters * 4bytes)/ (communication bandwidth)
Note that each model parameter is 4 bytes in size since TensorFlow uses fp32 (float32) to communicate gradients. Even when you have fp16 enabled, NCCL AllReduce utilizes fp32 parameters. You can get the number of parameters in your model from Model.summary.
If your trace indicates that the time to AllReduce was much longer than this calculation, that means you’re incurring additional and likely unnecessary overheads.
What’s next?
The TensorFlow Profiler is a powerful tool that can help you to diagnose and debug performance bottlenecks, and make your model train faster. Now you know five ways you can use this tool to understand your training performance. To get a deeper understanding of how to use the profiler, be sure to check out the GPU guide and data guide from the official TensorFlow docs. It’s time for you to profile some training jobs of your own!
