Tips for troubleshooting Google Cloud Load Balancing backends
Disha Madaan
Technical Solutions Specialist, Google Cloud
Is your Google Cloud load balancer up and running, but those backends just won't turn green and healthy? Don't worry, you're not alone! This post is packed with handy tips to help you troubleshoot those unhealthy backends, potentially saving you a call to Cloud Support.
Lets understand how health checks work:
Just like a doctor checks your vital signs during a checkup, your load balancer regularly probes its backends to make sure they're in a healthy state. These "health checks" are simply test probes sent to each backend. If a backend responds correctly within the configured thresholds, it is marked as healthy and turns green.
But if a backend fails to respond within the configured thresholds, the load balancer marks it as "unhealthy." The overall health state of each backend determines eligibility to receive new requests or connections.
You can configure the criteria in the health check configuration that define a successful probe.This is discussed in detail in the section How health checks work.
Know your troubleshooting tools
To help you uncover why your backends aren't healthy, the Google Cloud console provides you with a suite of troubleshooting tools. These tools can help you get to the root cause of the issue and bring your backends back to a healthy state.
Consider the problem statement: You have a load balancer with backends which are not turning healthy indicating that they are failing to pass health checks. What are your options?

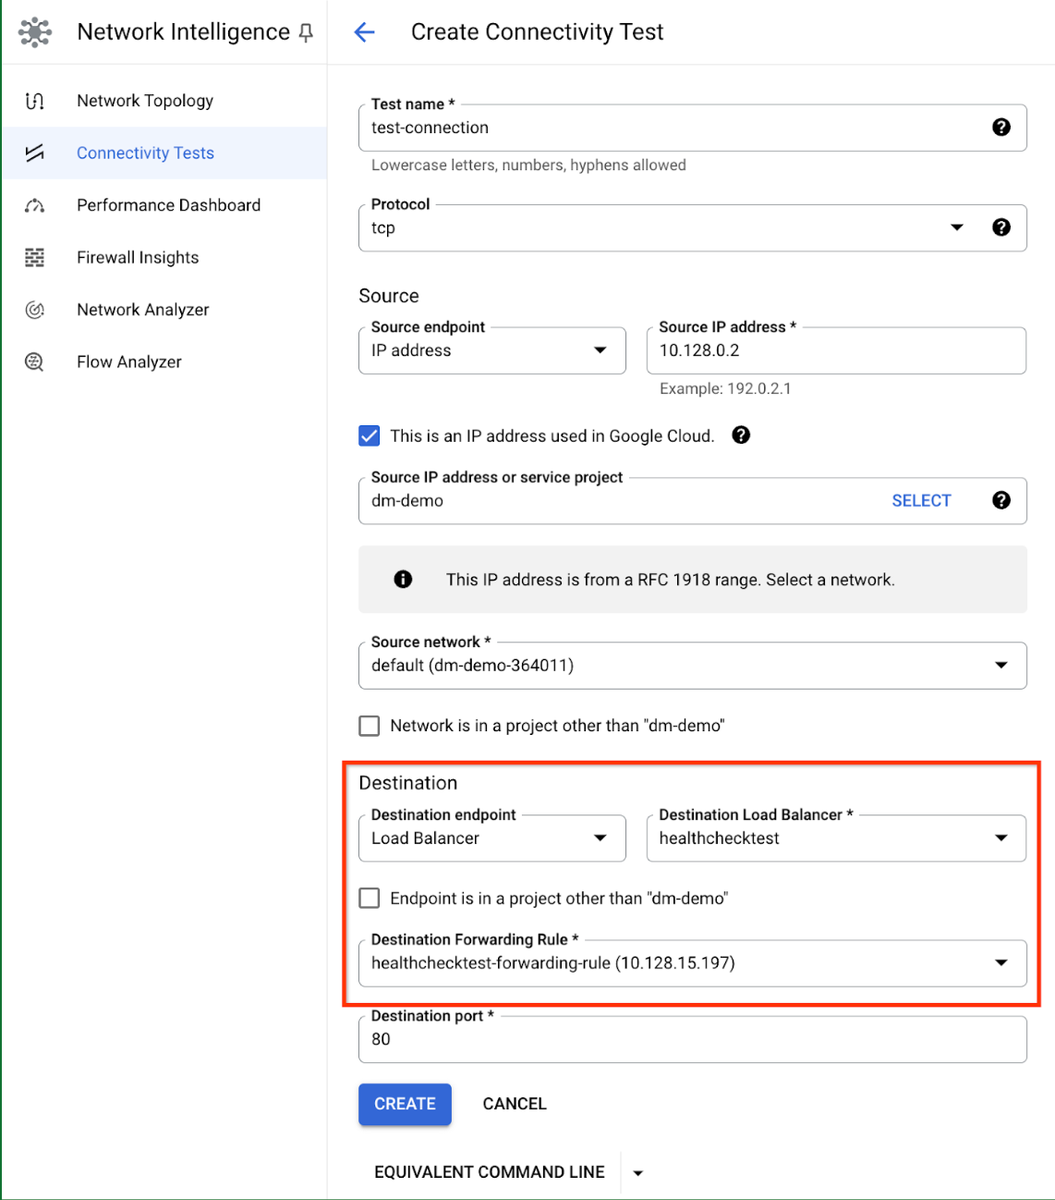
1. Connectivity Tests
Connectivity Tests is a diagnostics tool that lets you check connectivity between network endpoints. It analyzes your configuration and, in some cases, performs live data plane analysis between the endpoints. An endpoint is a source or destination of network traffic, such as a VM, Google Kubernetes Engine (GKE) cluster, load balancer forwarding rule, or an IP address on the internet.
The first step is to run aconnectivity test between your client IP address and the load balancer front end IP. This test will confirm if there is an unintended network configuration issue and will analyze the health check firewall status for each backend of the load balancer depending on its type and the health checks assigned to different backends.
For health checks to work, you must create ingress ‘allow’ firewall rules so that traffic from Google Cloud probers can connect to your backends. This table shows the source IP ranges to allow for the corresponding load balancer.
These firewall rules apply to backend VM instances in a managed instance group (MIG), unmanaged instance groups and zonal network endpoint group (NEG).
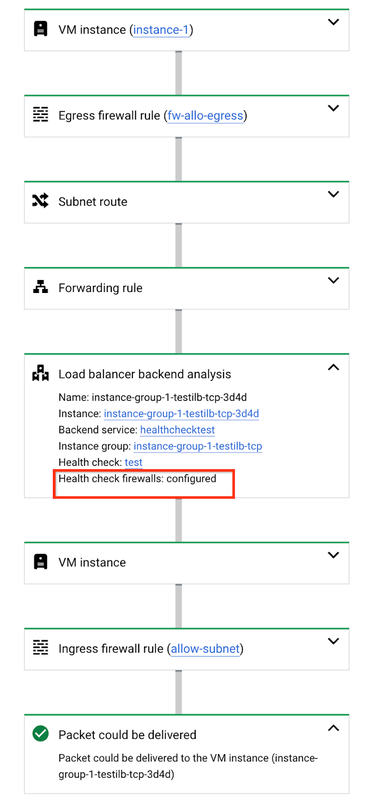
When we run the above test, we can determine if health check firewall rules are configured.
Unsuccessful test output

In the above test output, we can observe that health check firewalls are not configured and the default ingress firewall rule is blocking the health check probes.
Successful test output:
After the firewall rule for health check ranges was created, the connectivity test was successful:
Important considerations for firewalls when configuring health checks:
-
Allowlisting Google's health check probe ranges isn't required for hybrid NEGs. However, if you're using a combination of hybrid and zonal NEGs in a single backend service, you need to allowlist the health check probe ranges for the zonal NEGs.
-
Regional external Application Load Balancer, internal Application Load Balancer (cross-region and regional), regional external proxy Network Load Balancer, cross-region internal proxy Network Load Balancer, and regional internal proxy Network Load Balancer all use distributed Envoy health checks to check the health of hybrid NEGs. The health check probes originate from the Envoy proxy software itself. Each backend service must be associated with a health check that checks the health of the backends. Health check probes originate from the Envoy proxies in the proxy-only subnet in the region. For the health check probes to function correctly, you must create firewall rules in the external environment that allow traffic from the proxy-only subnet to reach your external backends.
-
Target pool-based external passthrough Network Load Balancers support only IPv4 traffic and might proxy health checks through the metadata server. In this case, health check packet sources match the IP address of the metadata server:
169.254.169.254. You don't have to create firewall rules to permit traffic from the metadata server. Packets from the metadata server are always allowed.
2. Cloud Logging
If no firewall rule is blocking connectivity between the health check ranges and the load balancer, proceed to examining health check logs for further troubleshooting. You can do so with Cloud Logging, a fully managed service that allows you to store, search, analyze, monitor, and alert on logging data and events.
The Google Cloud recommended practice is to enable logging for your health checks.
Health check log entries contain information useful for monitoring and debugging the state of your endpoints. You can get logs of load balancing health checks when an endpoint changes in health status. Health checks log ‘health transition information’ (for example, if the health check state changes from ‘HEALTHY’ to’ UNHEALTHY’ ) to Cloud Logging.
Log entries contain the following types of information:
- General information shown in most logs, such as severity, project ID, project number, and timestamp
- Fields specific to health checks, described in detail here
- More information related to health check states can be found here
jsonPayload in HealthCheck Log Entry is populated with a field healthCheckProbeResult that contains a lot of information which is helpful for debugging unhealthy backends.
HTTP health checks:
Path: /
Protocol: HTTP
Port: 80
Interval: 5 seconds
Timeout: 5 seconds
As per the above configuration, Google Cloud is sending HC probe HTTP GET requests to the root path “/”at port 80.
Success criteria:
-
Each probe requires an HTTP 200 (OK) status code to be delivered before the probe timeout. In the above example, the timeout is 5 seconds.
-
This indicates that if the backend server did not respond within the 5 seconds, the endpoint is considered
UNHEALTHY.
Health check logs:
Go to Cloud Logging and select the log name as health checks.
Log filter:
logName="projects/<Project ID>/logs/compute.googleapis.com%2Fhealthchecks"
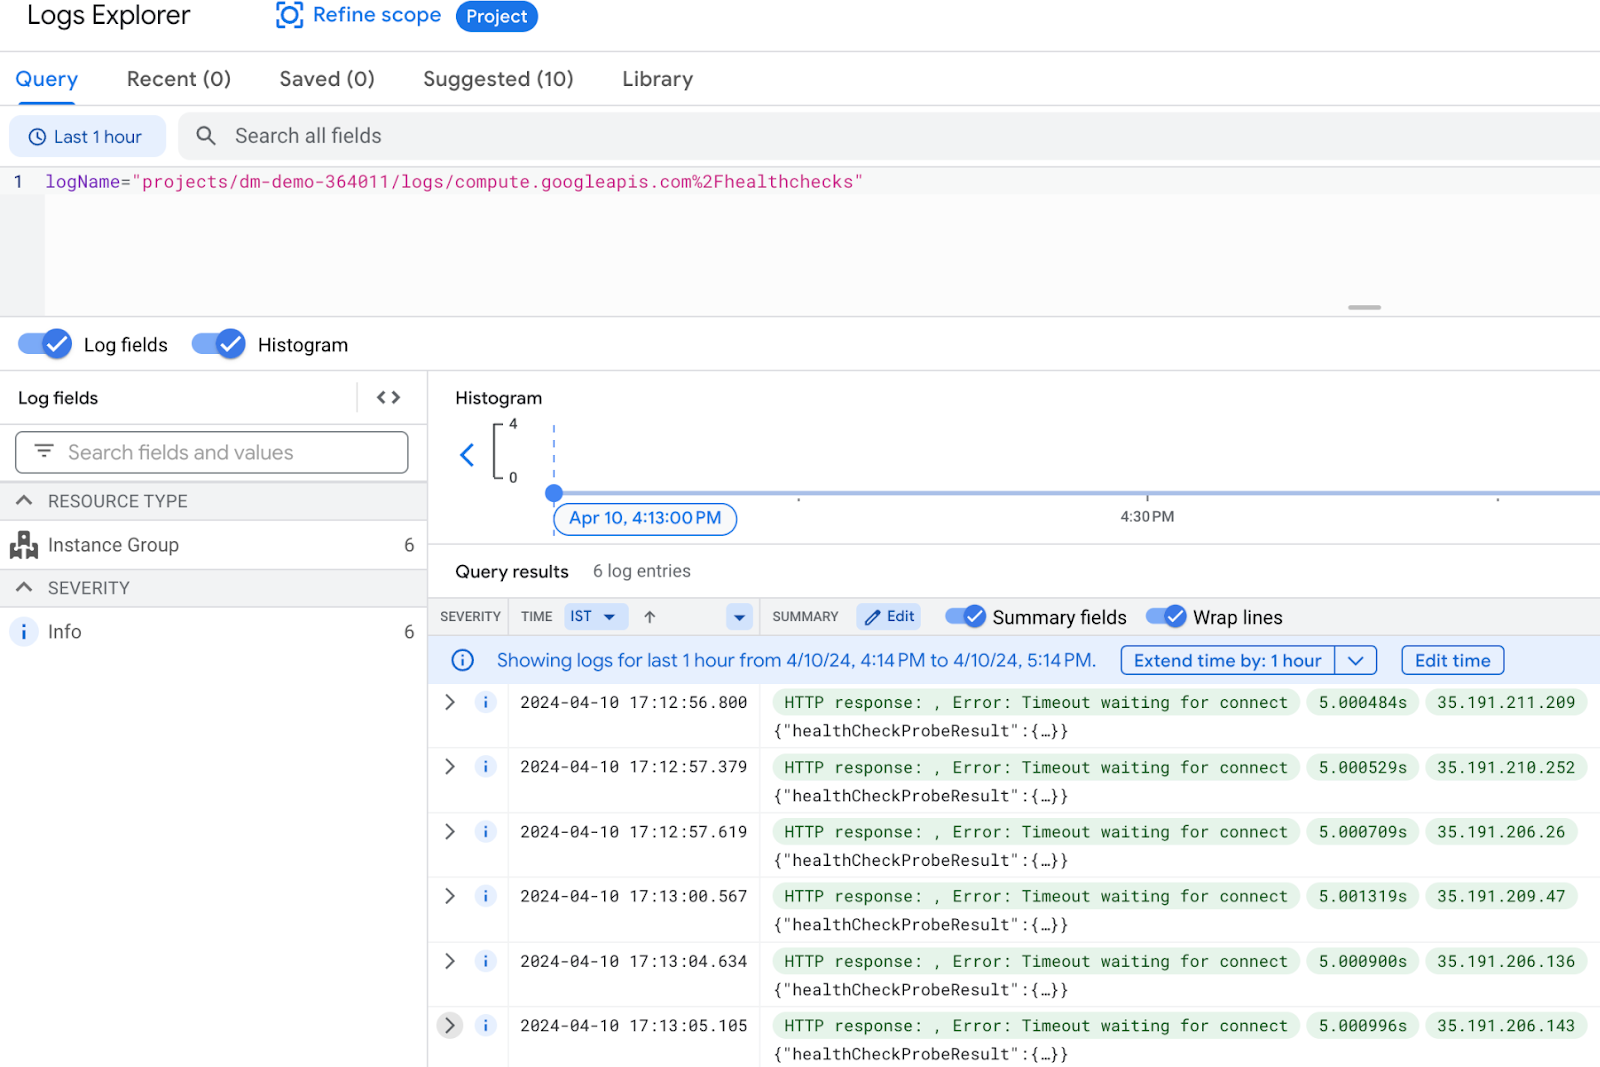
We received probeResultText as “HTTP response: , Error: Timeout waiting for connect” and the response latency is more than 5 seconds. This indicates that the HTTP 200 was not received within the configured timeout i.e. 5 seconds.
There could be two reasons for the backend server not responding within the configured timeout:
-
The backend endpoint is unreachable: This indicates that the backend application is not responding on the configured HC path and port. To resolve this, ensure that the backend application is configured to reply on the HC path and port.
-
The backend endpoint is slow and not responsive within the configured timeout: This indicates that the backend application is responding on the configured HC path and port but it is not sending HTTP 200 within the configured 5 second timeout. As a result, Google Cloud is closing the connection, thus marking the backend as “unhealthy”. To resolve this, follow either of the below approaches:
-
Benchmark the timeout value as per the maximum time taken by the backend application to respond at the HC path and port.
-
Tune the backend application to respond back within the configured timeout.
TCP health checks:
Protocol: TCP
Port: 80
Interval: 5 seconds
Timeout: 5 seconds
As per the above configuration, Google Cloud is sending TCP Health check probes at port 80 to the load balancer backend.
Success criteria:
-
Each Google Cloud probe can successfully complete an SSL or TCP handshake before the configured probe timeout (in the above example, the timeout is 5 seconds)
-
And the TCP session is terminated gracefully either by the backend, or the Google Cloud probe sending a TCP RST (reset) packet while the TCP session to the probe is still established.
-
If the backend sends a TCP RST (reset) packet to close a TCP session for a TCP health check, the probe might be considered unsuccessful. This happens when the Google Cloud probe has already initiated a graceful TCP termination.
Health check logs:
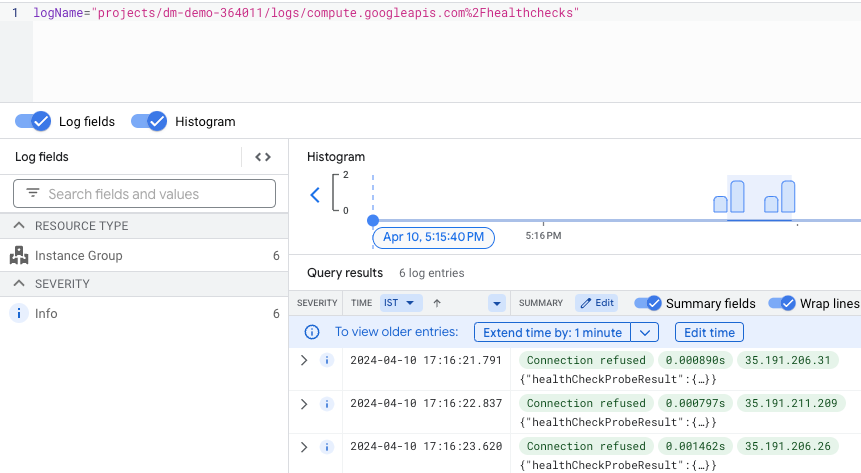
We received probeResultText as “Connection refused” which indicates that the health check probe SYN packet arrived at the backend VM but the connection was reset/refused by the backend instead of sending a SYN-ACK.
Possible root causes:
-
The port specified in the Health check configuration (port 80 in this example) is not open on the destination machine.
-
The port is open on the destination machine, but its backlog of pending connections is full.
-
The local firewall at the destination machine is blocking access.
More details about other health checks:
Success criteria for legacy health checks
3. Backend VM configuration
If health check logs indicate that the backend is not responding to the HC probes, refer to this section to verify if the backend VM is configured correctly to handle the health check probes.
For proxy load balancers:
The following checks apply to Application Load Balancers:
-
Verify that the port specified in the Health check configuration (port 80 in this example) is open on the backend machine.
-
For linux machines, use command netstat -tulpn | grep <port-number> , replace <port-number> with the port specified in health check configuration.
-
For HTTP health checks, verify that the application running on the backend machine is responding on the configured HC path and port.
For passthrough load balancers
The following checks apply to passthrough Network Load Balancers. Packets sent to a passthrough Network Load Balancer will arrive at backend VMs with the destination IP of the load balancer itself. This type of load balancer is not a proxy, and this is expected behavior.
Verifying service IP and port binding
The software running on the backend VM run must be:
-
Listening on (bound to) the load balancer's IP or any IP (0.0.0.0 or ::)
-
Listening on (bound to) a port that's included in the Load Balancer's forwarding rule
To test this empirically, connect (via SSH or RDP) to a backend VM, then perform the following tests (using curl, telnet, or similar):
-
Attempt to reach the service by contacting it using the internal IP address of the backend VM itself, 127.0.0.1, or localhost.
-
Attempt to reach the service by contacting it using the IP address of the Load Balancer's forwarding rule.
If a user cannot reach their service using the internal IP address of the backend VM itself, 127.0.0.1, or localhost, then the problem is with the service's software running on the backend VM. If user can reach their service using the internal IP address of the backend VM itself, 127.0.0.1, or localhost, but not the IP address of the Load Balancer's forwarding rule, then their software isn't properly listening (bound) to the Load Balancer's IP address.
You can verify that the software running on their backend VM is properly bound by inspecting the output of this command on a Linux system: netstat -tulpn
If the software is bound to the wrong port or is bound to just the IP address of the backend VM, the customer must reconfigure their software.
Verify local route
Each backend VM must be configured to accept packets “sent to the load balancer” — that is, the destination of packets delivered is the IP address of the load balancer. Under most circumstances, this is implemented with a local route.
For VMs created from Google Cloud images, the Guest agent (formerly, the Windows Guest Environment or Linux Guest Environment) installs the local route for the Load Balancer's IP address. GKE nodes based on COS implement this in iptables instead. If you are using a custom VM image, the local route wouldn't be implemented by default.
On a Linux backend VM, you can verify the presence of the local route by running the following command, replacing LOAD_BALANCER_IP with the load balancer's IP:
sudo ip route list table local | grep [LOAD_BALANCER_IP]
If the local route is missing, you can manually add the local route to the VMs:
sudo ip route add to local [LOAD_BALANCER_IP] dev [INTERFACE] proto 66
Replace the LOAD_BALANCER_IP with the Load Balancer's IP and [INTERFACE] with the interface where the route is missing.
If you are running a Google provided image, check why the Guest Agent was unable to install the local route. Check if the Guest agent is running. If not, install the Guest Agent.
There is a known issue that the registered local routes will be deleted if the NIC got reset by systemd-networkd restart (systemd based system including Ubuntu). It could happen if the instance is configured as auto-update enabled (apt upgrade) and you still use the old version of the Guest Agent, and any update requires restart of systemd-networkd. You should update the Guest Agent to version 20210408.00 or newer to prevent this issue. Detailed information: Github Issue and Github PR
Perform traffic capture and analysis:
You can use packet capture to pinpoint the communication between the health check probes and the backend VM. Packet capture can be done with tcpdump as follows:
-
Install tcpdump on the backend VM.
-
Start tcpdump capture.
-
Analyze the tcpdump output to identify the problem.
4. Read the manual
The troubleshooting steps in above sections can help to identify the reasons for health check failures but to gain a comprehensive understanding of health checks: their purpose, mechanisms, operational dynamics and about the limitations and supported configurations, you should always consult the Google Cloud documentation:
-
In-depth look at health check concepts: Health Checks Overview
-
Creating and utilizing health checks: Using Health Checks
-
More details: Additional notes
Working with Cloud Support: Once that you have pinpointed the issue and you have analyzed the problem, you may need to reach out to Cloud Support for further assistance. To facilitate a smooth experience, be sure to explain your needs, clearly describe the business impact and give enough context with all the information collected.