Gleaning security insights from audit logs with Log Analytics
Roy Arsan
Cloud Solutions Architect, Google
Charles Baer
Product Manager, Google Cloud
Cloud Audit logs serve a vital purpose in Google Cloud by helping customers meet their compliance and security requirements. Log Analytics, a recent feature addition to Cloud Logging, brings new capabilities to search, aggregate and transform logs at query time using the power of SQL. Together with predefined queries in Community Security Analytics, Log Analytics makes it easier than ever to get actionable insights from your Cloud Audit logs.
From logs to insights
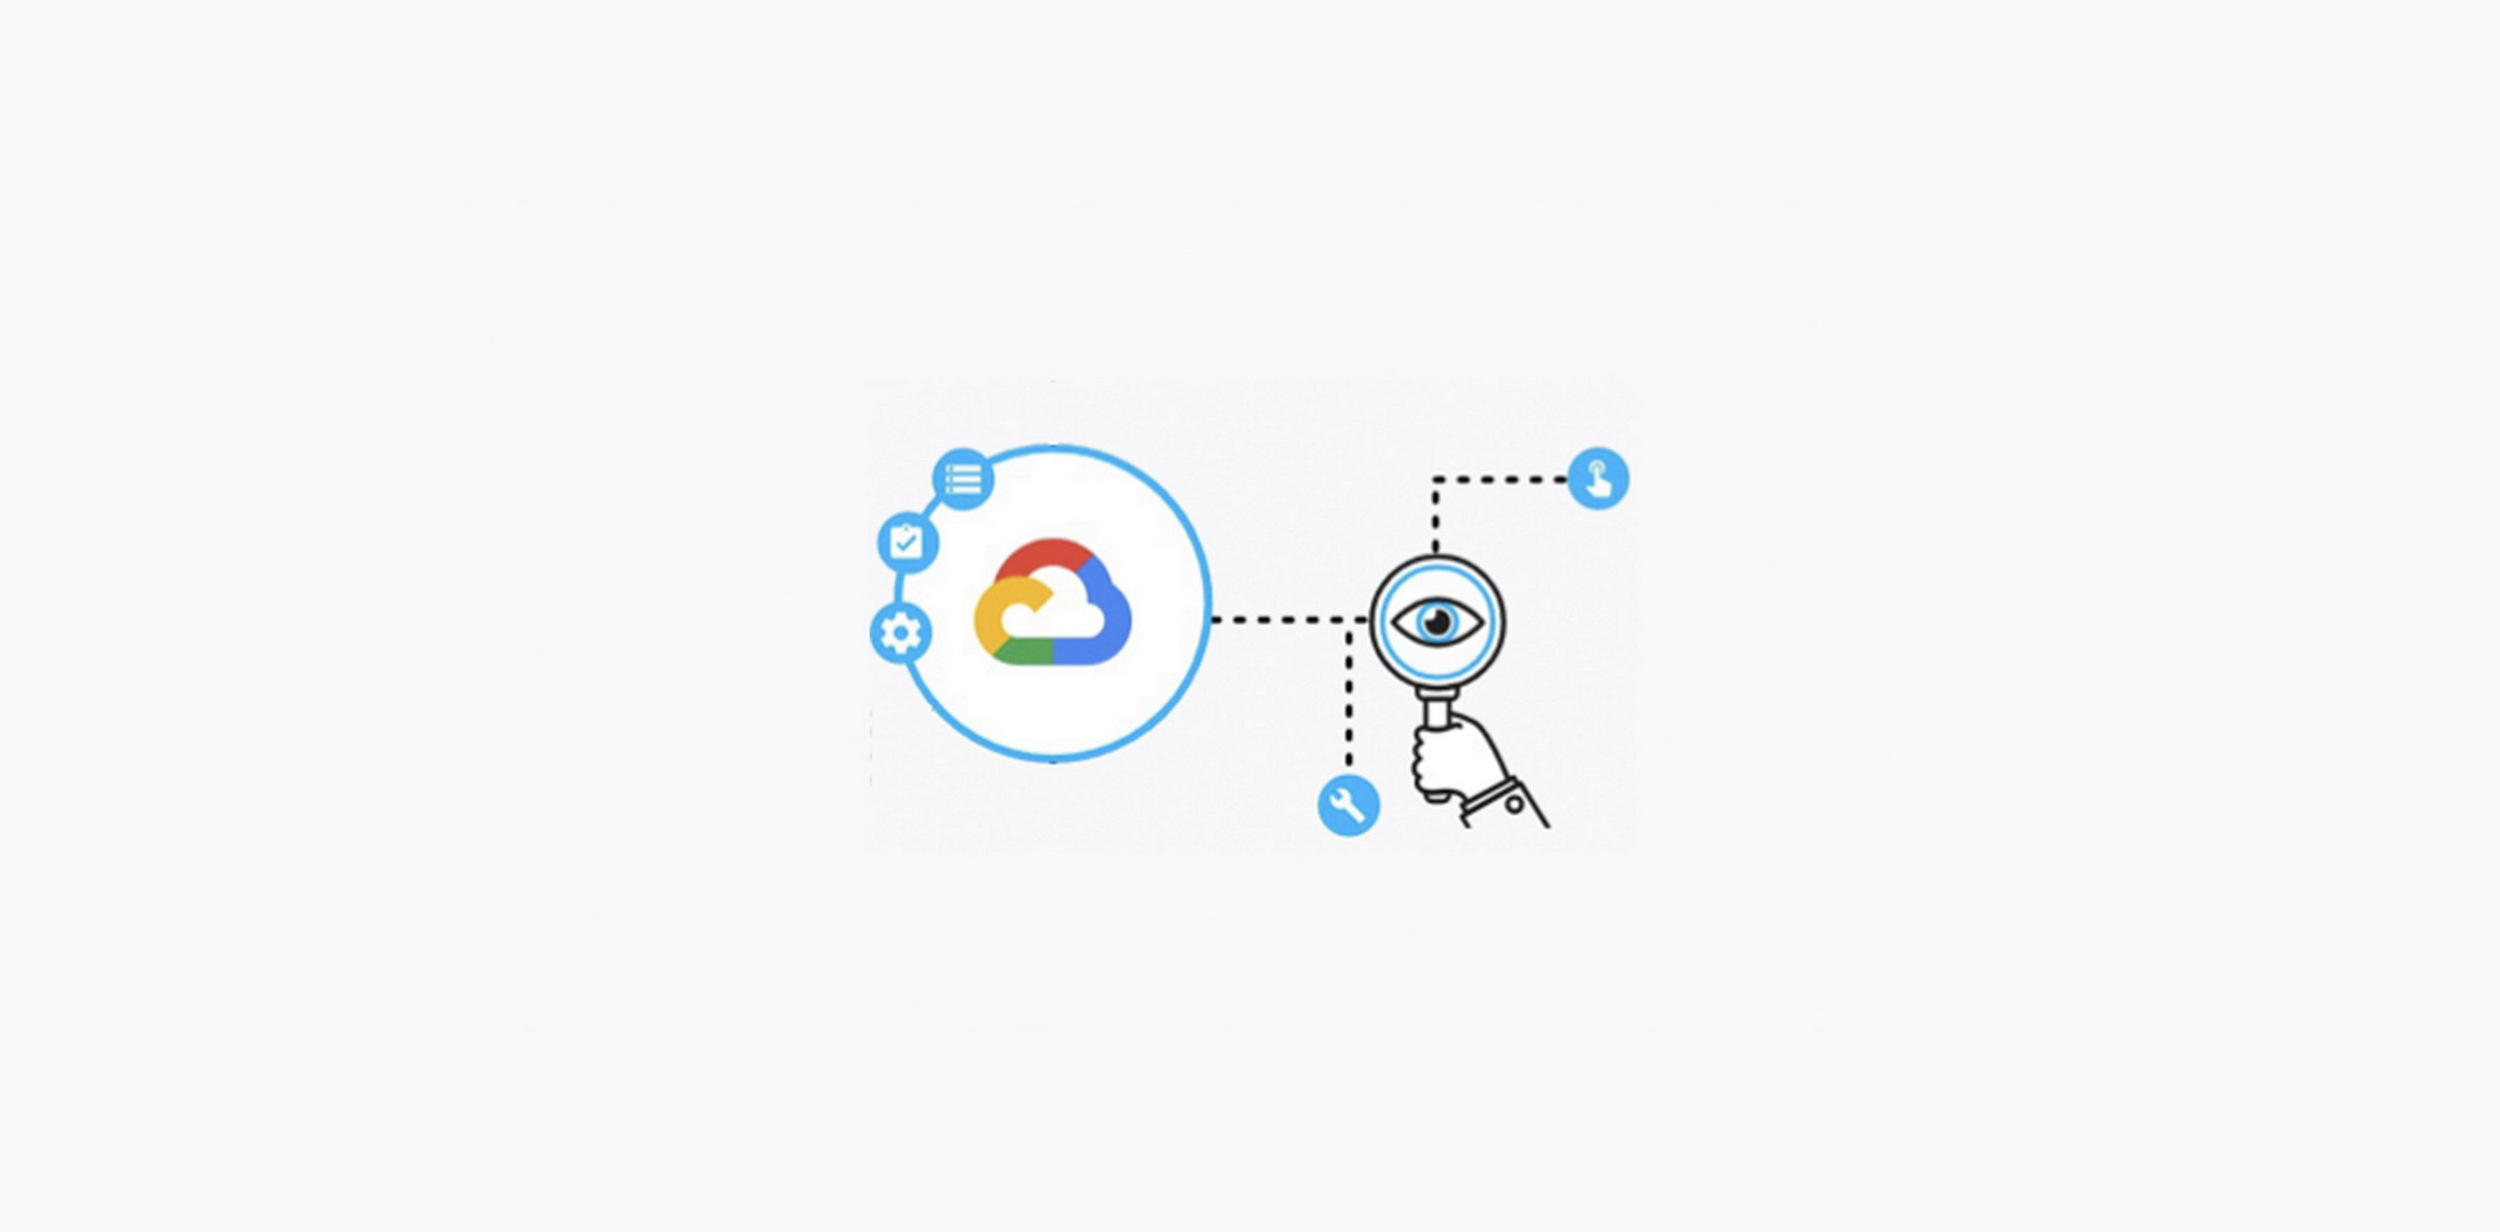
Getting insights from audit logs can be a challenge as it involves numerous steps requiring different highly skilled teams and tooling. That challenge is compounded by the volume, variety and velocity of valuable logs. Cloud Logging can help in each step:
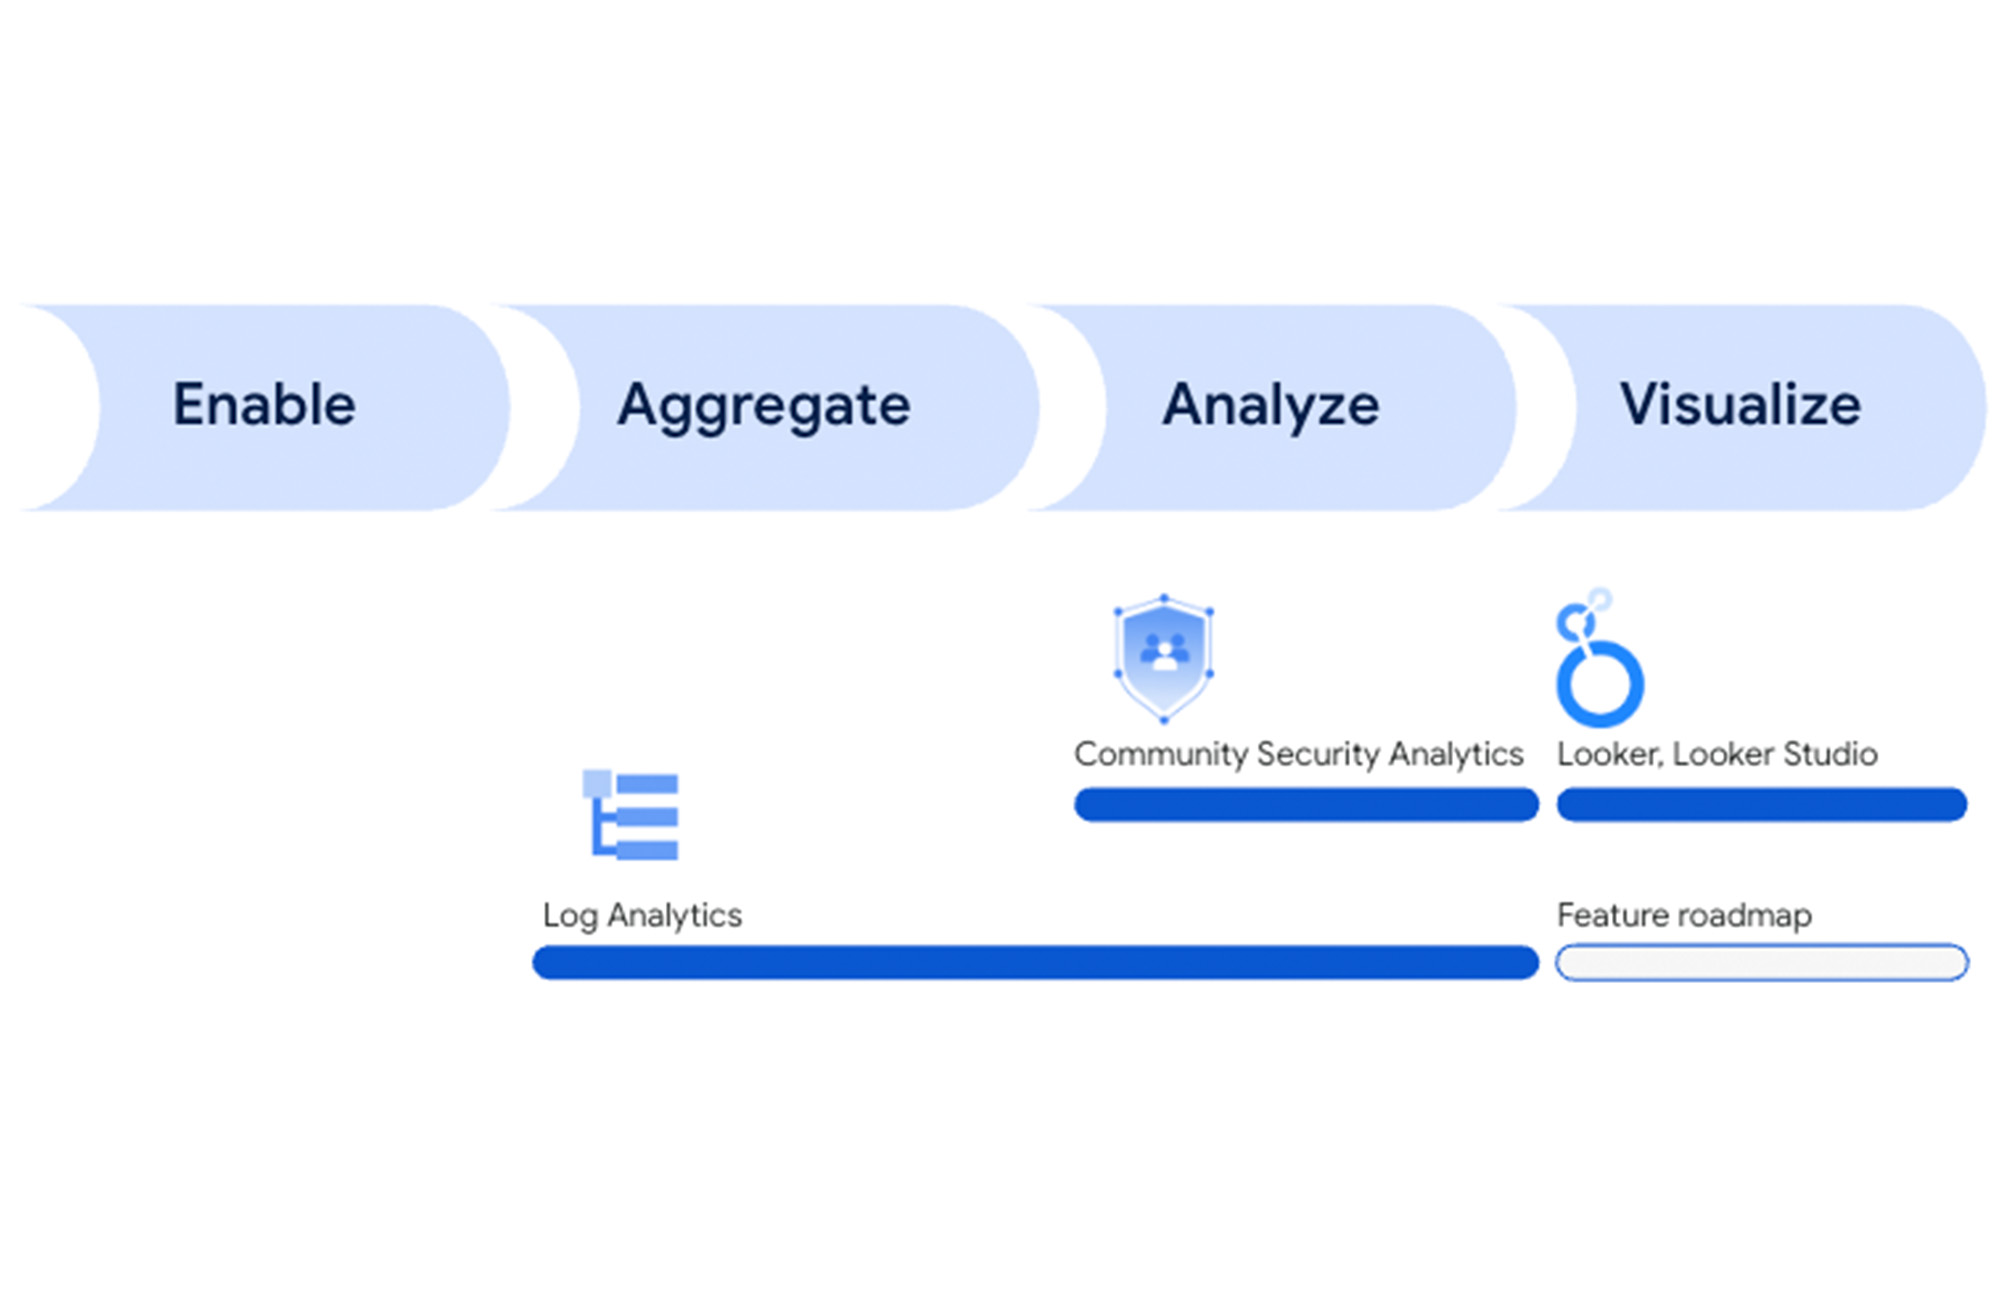
- Enable log collection: Cloud Logging collects all admin activity audit logs by default and at no extra cost. Users can enable Data Access Audit logs for specific services in order to meet their needs.
- Aggregate with centralized log storage: Logs Router provides a compliant, secure, scalable, and reliable log collection and routing platform. By collecting and centrally storing audit log data in a dedicated Log Bucket, security teams can have necessary visibility over the entire department or organization by querying audit logs aggregated from different projects.
- Analyze with ad hoc and aggregated insights: By supporting ad-hoc, query-time audit log analysis with full-text search index, security teams can quickly search logs for specific access attributes such as an IP address or a user name as part of their investigations. Aggregating and filtering audit logs over time can provide insights into access patterns and anomalies. This may include administrators’ activity, users data access, or network activity.
- Visualize logs and insights – By visualizing the data over time, it can be easier to gain insight into important trends and detect anomalies.
Google Cloud’s security platform
Log Analytics in Cloud Logging provides an easy way for users to find and explore Cloud Audit logs. This is a great way to get started with analyzing your audit logs. Google Cloud’s security platform offers purpose-built security tools for automated threat detection, prevention and response capabilities:
- Security Command Center – Managed threat detections and vulnerability findings by Security Command Center. You can use Log Analytics to further investigate these high-fidelity security signals from Security Command Center and correlate them with logs for decision-making.
- Chronicle Security Operations – A complete threat detection, investigation and response platform across multi-cloud and on-premise environments. Chronicle provides security operations teams with cloud-scale security analytics, custom YARA-L as well as curated detections, context-rich investigation with threat intelligence, and SOAR playbooks to reduce response times.
- Cloud Armor, BeyondCorp Enterprise and VPC Service Controls – Threat prevention with several tools to protect your applications from common threats like web attacks and DDoS using Cloud Armor, protect your users from malware, ransomware and phishing using BeyondCorp Enterprise, and protect your data from breach or exfiltration risk (including stolen credentials) using VPC Service Controls.
In this blog post, we’ll cover how to get the most out of your audit logs with Log Analytics in Cloud Logging.
Community Security Analytics
Log Analytics can help reduce a lot of operational and infrastructure overhead that is otherwise incurred when sending logs to another tool for analysis. Logs can be analyzed ‘in-place’ and transformed at query-time with minimum lag time. However, knowing what events to look for and where to find it can still be a challenge. That’s where Community Security Analytics (CSA) comes in.
CSA is a set of open-sourced queries and rules designed for self-service security analytics to help you detect common cloud-based threats. By providing a set of pre-built queries, CSA helps you get insights from audit logs without requiring you to have deep familiarity with the different types of audit logs and their schemas. The rest of this blog goes over a few CSA example queries in Log Analytics to search and analyze audit logs.
Note: CSA is a collection of community-contributed queries that you can readily use and extend to your own forensic needs as part of your self-service detective controls, but it is not meant to be a comprehensive or definitive set of threat detections.
Detect suspicious activity based on audit logs
By querying audit logs for policy violations or anomalous behavior, you can identify potential cloud-based threats or security misconfigurations. Examples of such audit logs include:
- Policy Denied audit logs showing VPC service controls access attempt violations indicating potentially stolen credentials, or
- Admin Activity audit logs showing potential privilege escalation via Identity Access Management (IAM) or defense evasion by disabling logging, or
- Data Activity audit logs showing potential abuse of APIs or misuse of data hosted in services like Google Cloud Storage(GCS) or BigQuery
Example #1: Detect threats using SQL
Let’s dive into one of the sample queries from CSA. The following is the SQL query for CSA 2.20 copied into the Log Analytics console, with the project and log bucket placeholder values replaced:
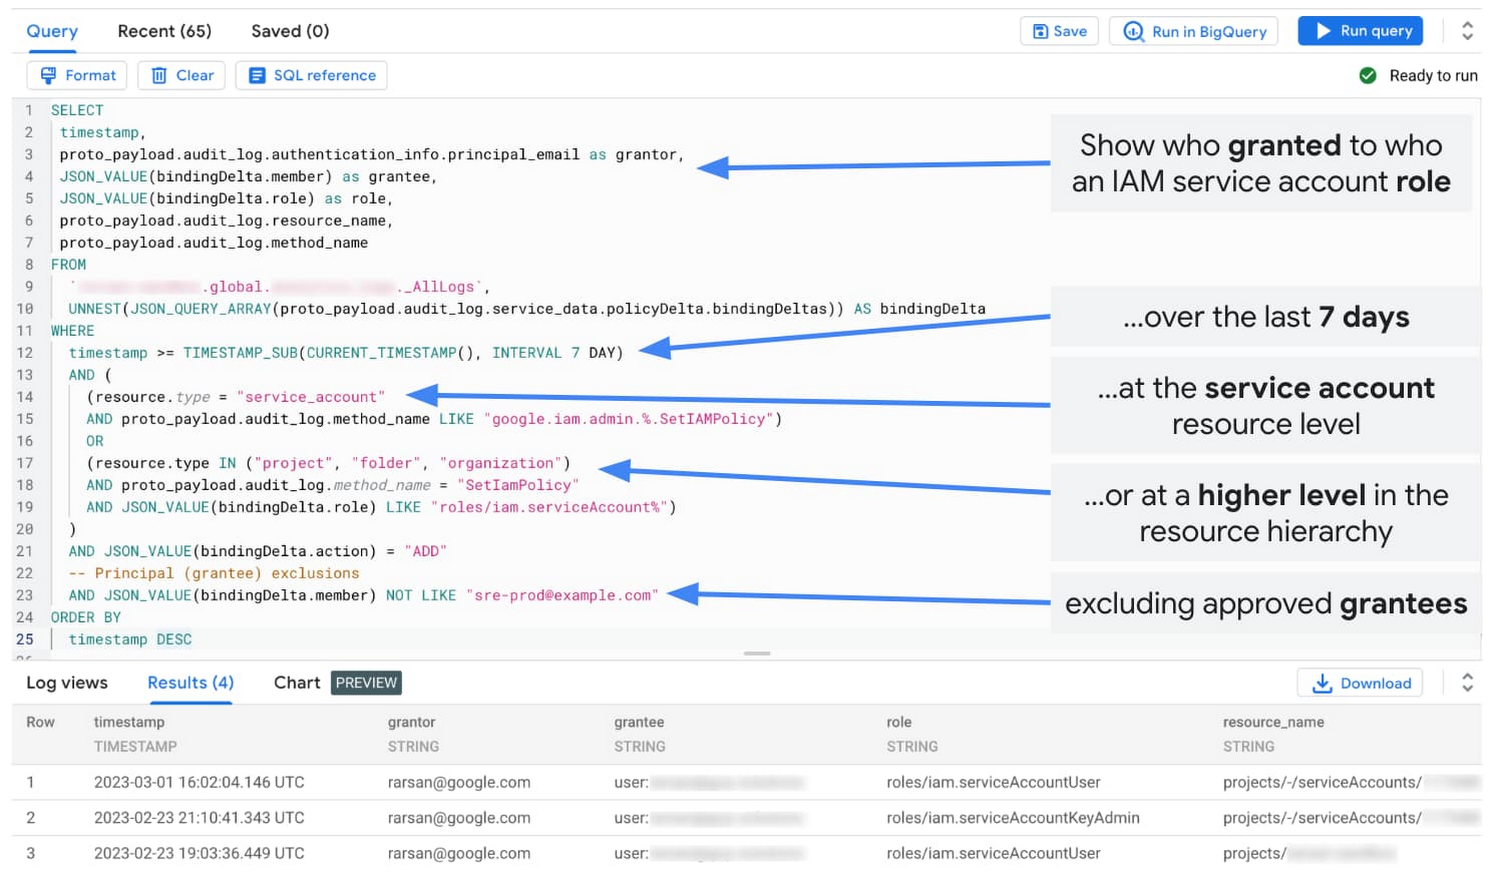
Using SQL in Log Analytics to detect threats based on your audit logs
The query searches for any permissions granted over sensitive service accounts to non-approved identities which allow them to impersonate the service account or create keys for that service account. Whether this is done by a malicious user or an unsuspecting user, this potential threat should be flagged and remediated.
This query accounts for IAM policy bindings that can be added directly at the service account resource level or at the parent project, folder or organization level. This query also includes exclusions, where you can exclude approved identities (or grantees).
For example, consider a Site Reliability Engineer (SRE) being granted temporary access to a production service account to recover from an outage. Since it’s part of an approved break glass procedure, you wouldn’t want to flag such an action as a threat, and potentially respond by revoking the operator’s access. You can further refine the query to filter out non-sensitive service accounts such as those in developer projects, or to focus on a specific time window (such as the previous 24 hours).
Using Log Analytics gives you a powerful and flexible way to craft non-trivial rules to detect threat and policy drift.
Example #2: Identify anomalies using SQL statistical analysis
In addition to needle-in-haystack type searches, you can perform advanced analytics in Log Analytics to find anomalies in your audit logs. The following is the SQL query for CSA 4.01 copy/pasted into the Log Analytics console, with the project and log bucket placeholder values replaced:
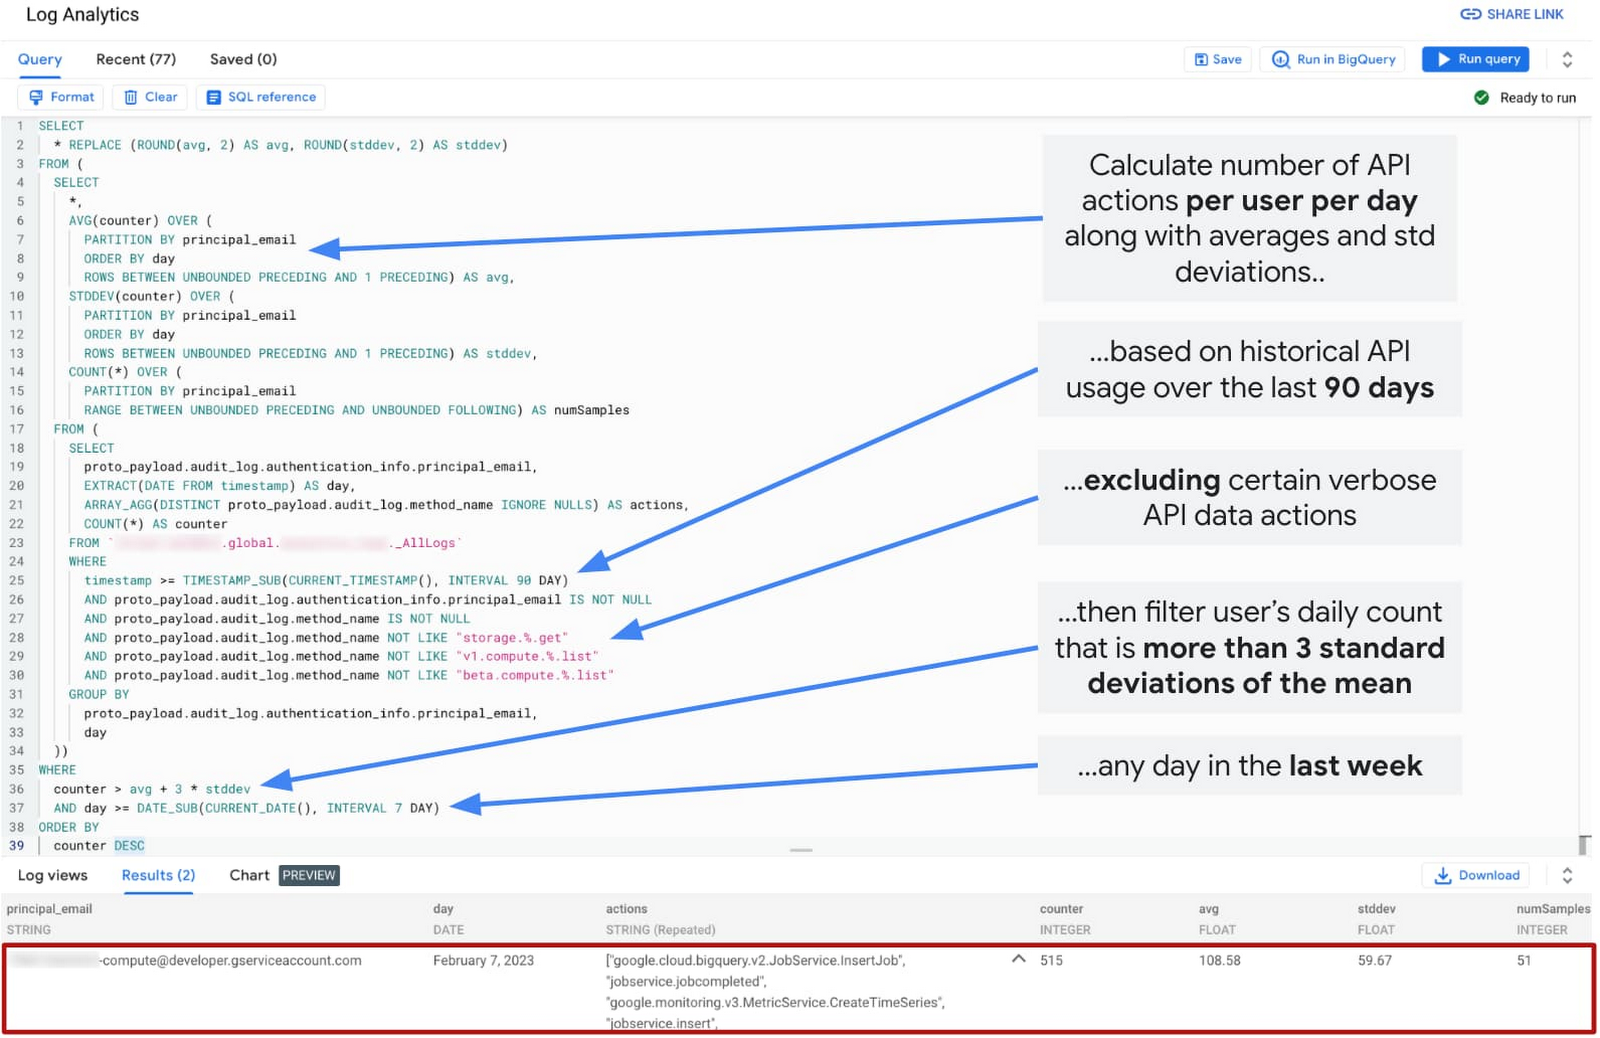
Using SQL in Log Analytics to find anomalies based on your audit logs
This query helps identify unusually high API usage by any principal on a given day in the last week, indicating a potential API abuse, or a scanning and enumeration attack. Again, such potential threat should be flagged and remediated.
This query calculates the number of API actions performed by each principal per day based on all audit logs. It uses aggregate functions to calculate daily count per principal but also a rolling daily average number and the standard deviation per such identity, by looking back at the preceding daily counts up to a 90-day lookback window (user configurable). This query also includes exclusions, where you can ignore benign or verbose API actions. By default, this query logic considers unusual activity as any instance where the daily action count from any principal is more than twice the standard deviation higher than the average (for that principal). To limit the alert noise, in our case, we increased the threshold to three times the standard deviation.
As you can see, in our test environment, we detected an anomaly where the Compute Engine default service account had executed 515 actions on one day (Feb 7, 2023) whereby, historically, it has executed only 108 actions per day on average. This anomaly was discovered out of 51 samples, that is the number of days where activity was found specifically for this identity, that is the Compute Engine default service account. This could be a false positive from say a monthly or weekly provisioning activity. To help with investigating this instance, and determining if there’s indeed any malicious activity, this query also reports the specific actions performed that day.
There are many other security threats you can detect with Log Analytics. Here are a few more examples:
- Any access attempts violating my VPC service controls? (CSA 1.10)
- Any user added to a highly-privileged Google group? (CSA 2.02)
- Any permissions granted to a sensitive service account? (CSA 2.20)
- Any changes made to my logging settings? (CSA 3.01)
- Any BigQuery queries doing very large scans? (CSA 5.07)
Visualize trends and anomalies based on audit logs
By analyzing audit logs over time, you can better identify trends and gain insights from your audit logs. Sharing those insights with others and scheduling reports delivered to your email help put insights when and where you need them.
The product team is currently working on designing and building embedded charting and dashboarding options for Log Analytics which we’ll cover in a future blog post. Analytical tools like Looker and Looker Studio provide excellent analytical capabilities including charting and dashboarding. One of the key features of Log Analytics is that you can use log data in any of the tools available in the BigQuery ecosystem through the use of the linked dataset. You can visualize the same CSA queries on Looker and Looker Studio dashboards.
Here are few examples of security questions that you can visualize:
- Any unusually high API usage by any user identity? (CSA 4.01)
- How often autoscaling was used per day in the past month? (CSA 4.10)
- Which users accessed the most amount of data in the past week? (CSA 5.02)
- How much data was accessed per day in the past week? (CSA 5.03)
- Report top 10 queries against BigQuery in the past week? (CSA 5.06)
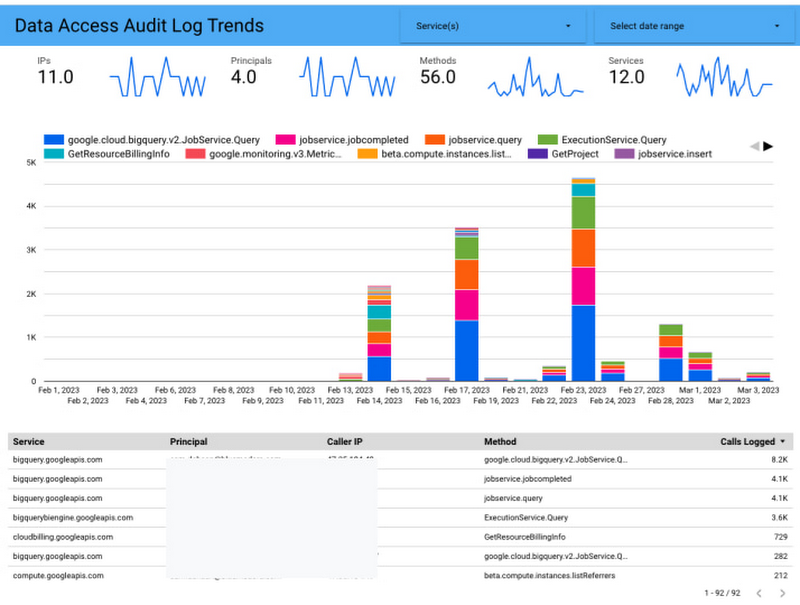
Visualize audit logs using Looker Studio
Looker Studio is a tool that provides charting and dashboarding capabilities for data stored in BigQuery. The Data Access Audit Log Trends dashboard below provides insights into log trends by IP, user principals, methods and services. You can find Looker Studio report templates for Data Access, Admin Activity, Policy Denied, and System Events stored in Log Analytics in the Looker Studio report gallery.
Visualize audit logs using Looker
Looker is an advanced data analytics platform that provides data modeling and analytical capabilities. One of the most powerful capabilities in Looker is the data modeling powered by Looker Blocks which provide pre-built data models to get started faster, optimized SQL and built in dashboards. If you use Looker, you can use the Log Analytics Block to analyze your audit logs.
For example, the Data Access dashboard below provides an overview of Data Access Audit logs across all GCP services. In addition to breaking down access by service and user (see CSA 5.*), this dashboard includes a geographical heat map representing the source and relative volume of this data access traffic.
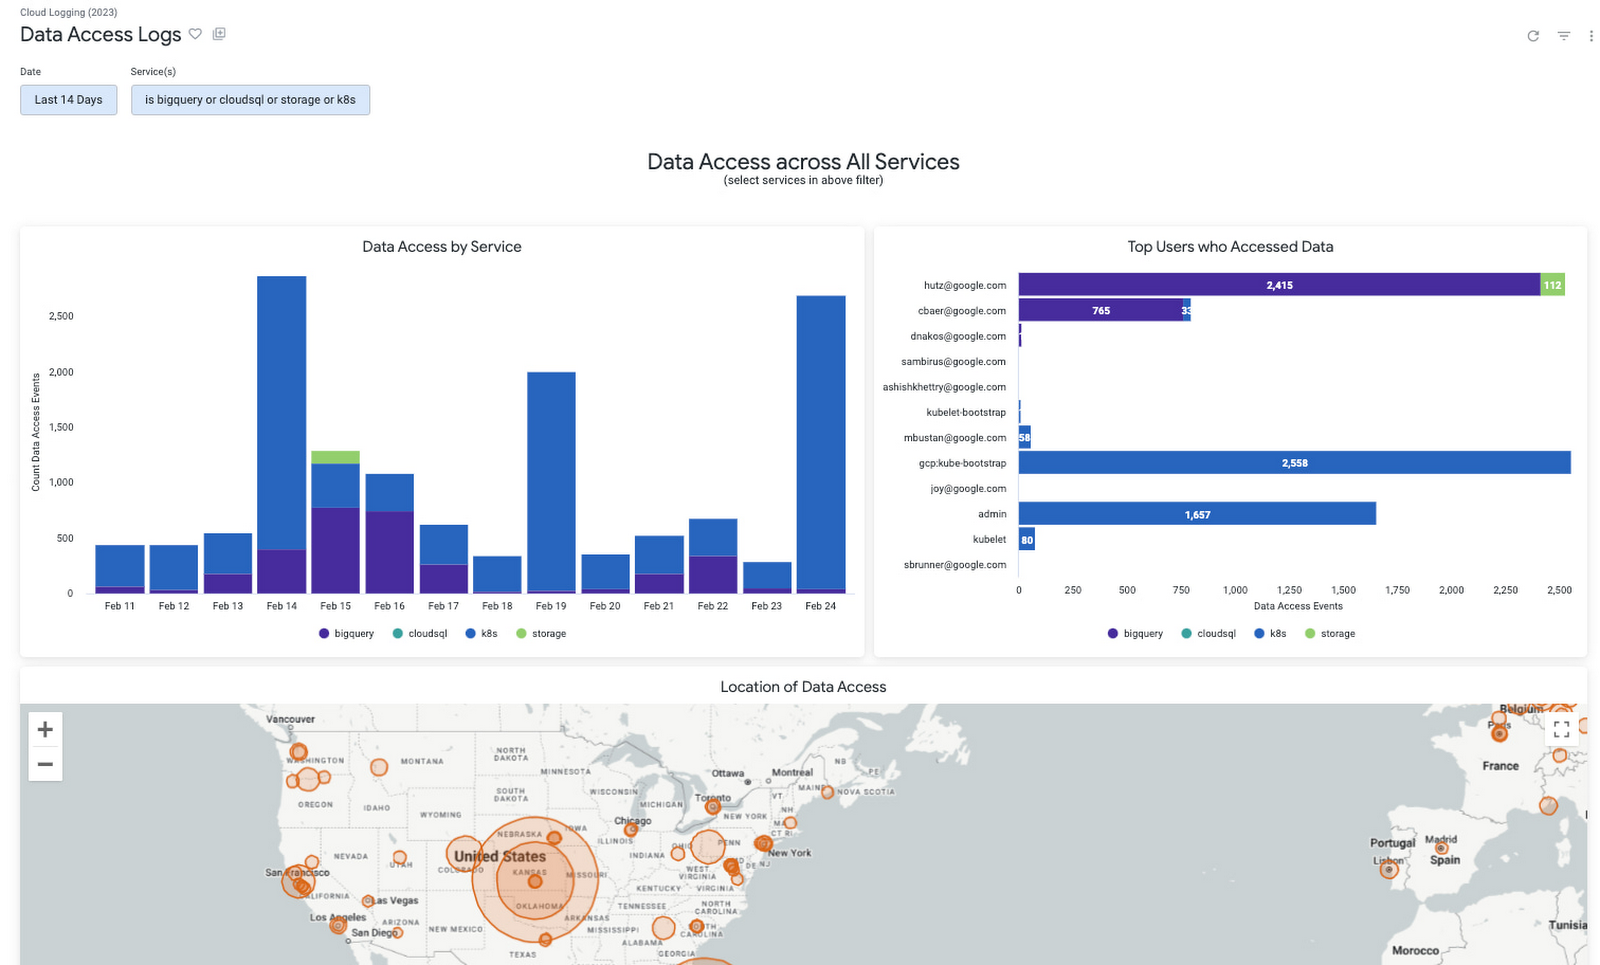
Breakdown of data access traffic by service, user, and origin based on data access logs
Another example is the ‘Unusual API usage’ dashboard which highlights unusually high API usage by any particular user on any recent day (or CSA 4.01 covered above). This dashboard allows you to easily tune the sensitivity of the analysis by exposing several knobs like sample size, and lookback window to establish a baseline, as well as the number of standard deviations to determine threshold for outliers.
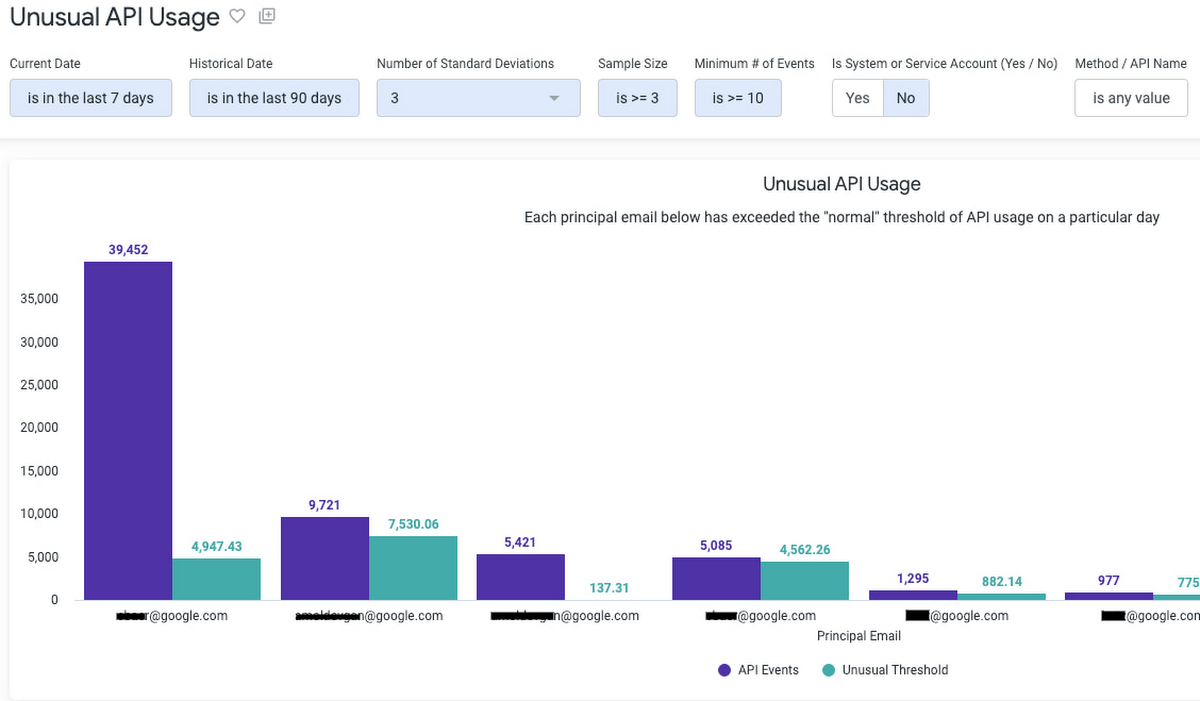
Highlight unusual API usage by any principal on a given day based on audit logs
Get started today
To get started with Log Analytics, you can upgrade your log buckets to use Log Analytics. You can start analyzing your own audit logs with dozens of audit and security-focused queries from CSA GitHub repo. If you use Looker, you can take advantage of sample dashboards and a Looker Block purpose-built for Cloud Logging, by following these instructions.
Check out Security log analytics in Google Cloud for an end-to-end tutorial that covers enabling, aggregating and analyzing your organization-wide logs using Log Analytics and CSA. Join the discussion in our Cloud Operations page on the Google Cloud Community site.
Special thanks to the following individuals from Google Cloud and our partner ObservIQ for their close collaboration and providing the above sample dashboards for both the Looker and Looker Studio communities:
Eric Hutcheson, Data Analytics Customer Engineer, Google
Joseph Howell, Principal Product Manager, ObservIQ
Sam DeHaan, Senior Software Engineer, ObservIQ