Take control of your firewall rules with Firewall Insights

Albert Colas Prunera
Networking Specialist, Google Cloud
Tracy Jiang
Product Manager
Corporate firewalls typically include a massive number of rules, which accumulate over time as new workloads are added. When rules stack up piecemeal like this, misconfigurations occur that, at best, create headaches for security administrators, and at worst, create vulnerabilities that lead to security breaches.
To address this, we have introduced the Firewall Insights module in our Network Intelligence Center, which provides a single console for managing Google Cloud network visibility, monitoring and troubleshooting.
What are Firewall insights?
Historically, there hasn’t been an easy way to deal with the accumulation of complicated firewall rules. That was until we created Firewall Insights, which provides metrics reports and insight reports. These two reports contain information about firewall usage and the impact of various firewall rules on your VPC network. Even better, these insights and metrics are integrated into your Google Cloud Console for the VPC firewall and are also available via APIs.
You can use metrics reports to verify that firewall rules are being used appropriately and as intended. This report can uncover leftover rules from the past that are not actively used, review that the firewall rules allow or deny what is intended, perform live debugging of connections dropped, and leverage Cloud Monitoring to discover malicious attempts to access your network.
You can use insight reports to identify firewall misconfigurations, detect security attacks, and optimize and tighten your security rules.
Let’s take a look at how these reports work.
Metrics Report, a deeper dive
Metrics insights analyzes your VPC firewalls usage by tracking metrics such as firewall hit counts and last used. Let’s check this out with an example:
When you navigate to your VPC network and click on Firewall, ensure that you have selected Logs, Hit count and also Last hit in the column display options:
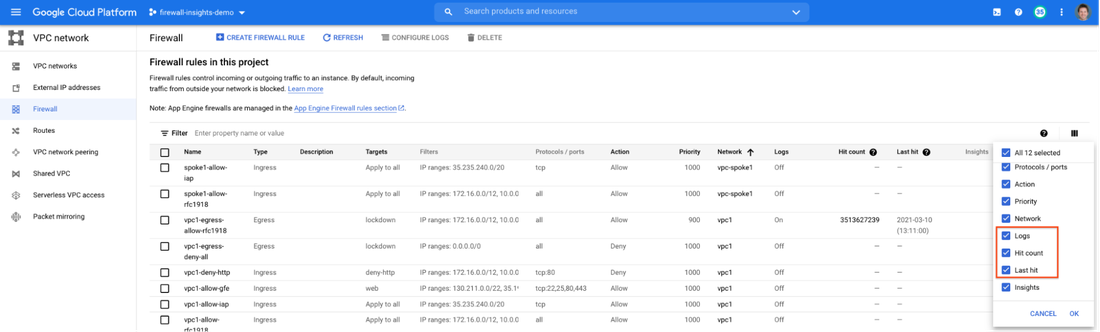
After this is enabled, now you should be able to see your VPC firewall rules with the hit count and last hit metrics. In the image below you can see that if logs are not enabled for rules, hit count and last hit metrics will not be collected. If logs are enabled, these details are collected, and shown in the VPC firewalls console.
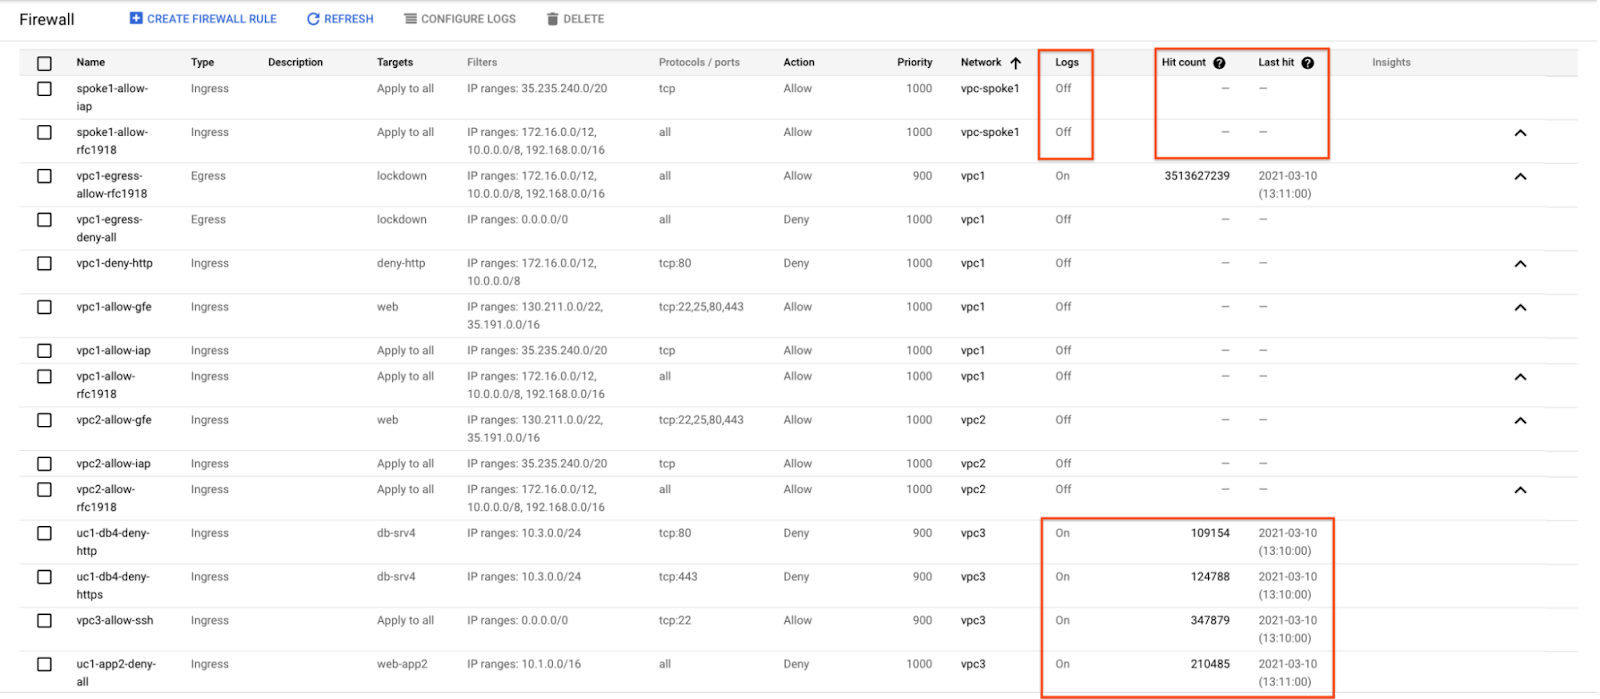
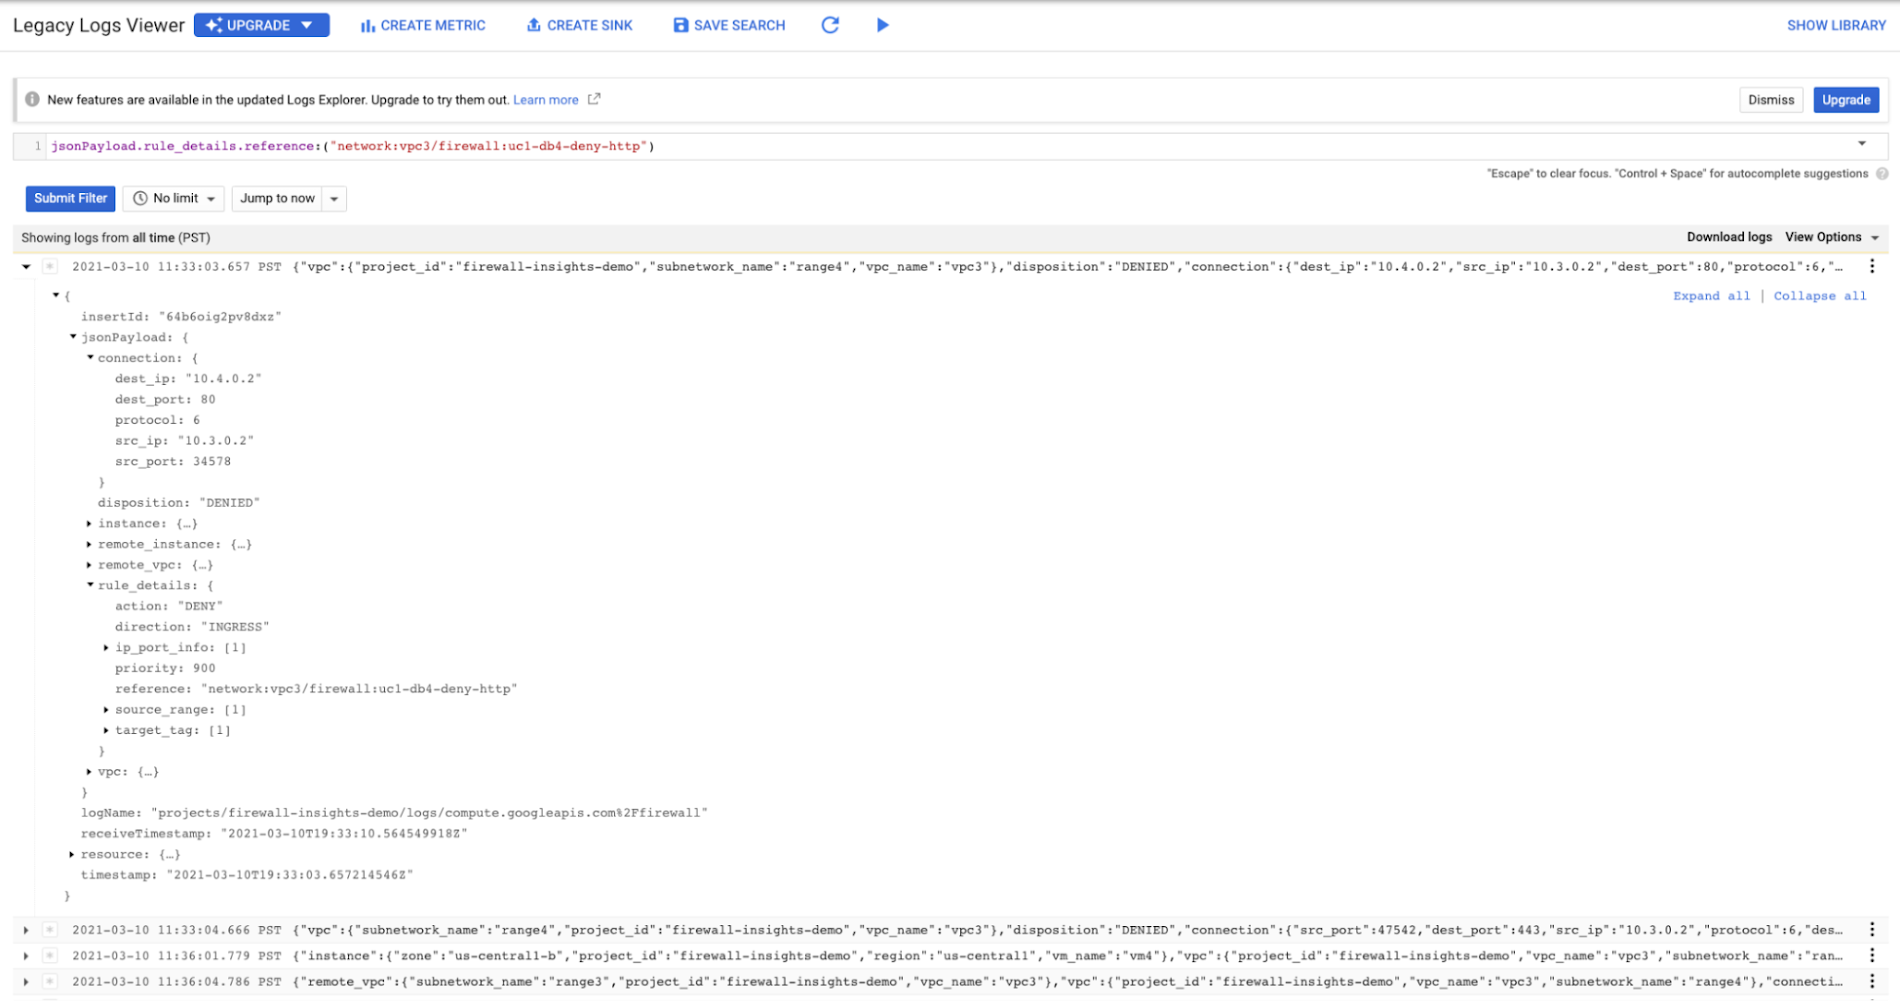
As you can see in Figure 1.2, each firewall rule which has logging enabled will show hit counts, so based on the example above, the rule “uc1-db4-deny-http” has been hit 109,154 times, the last time being 2021-03-10 (13:10:00). If you want to dive even deeper, you can click on the hit count and this will bring you to the logs viewer page where you can expand these logs and analyze all the details:
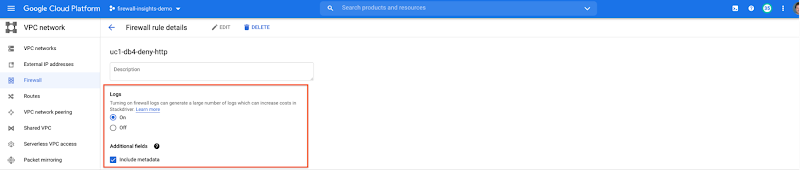
In order to enable logs for a particular firewall rule, you can edit it and turn logs on. By default, metadata is added in firewall logs. If you want to reduce the log size, you can do so by excluding these additional fields. Excluding these metadata fields will not impact the functionality of Firewall Insights.
From the “Firewall” page, you can also multi-select a group of firewall rules and turn on all logs at once.
Firewall rule usage metrics are accurate only for the period of time during which Firewall Rules Logging is enabled.
Insights Report, a deeper dive
Insights Report provides an intelligent analysis of the configuration of your firewalls. A report can contain one or more insights.
We will see examples now about the different insight reports which include:
Shadowed firewall rules
Allow rules with no hit in the last six weeks
Deny rules with hits in the last 24 hours
By definition, a shadowed rule is a VPC firewall rule that is completely overshadowed by one or more firewall rules with higher or equal priority. We call that shadowing rules. Let’s see an example on how to find shadowed rules:
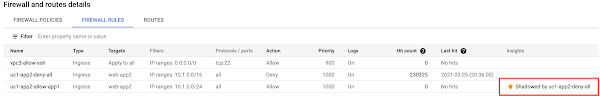
Let’s say that you try to use ping between two VMs but it fails. Let’s take a look at the firewall rules applied to the VM: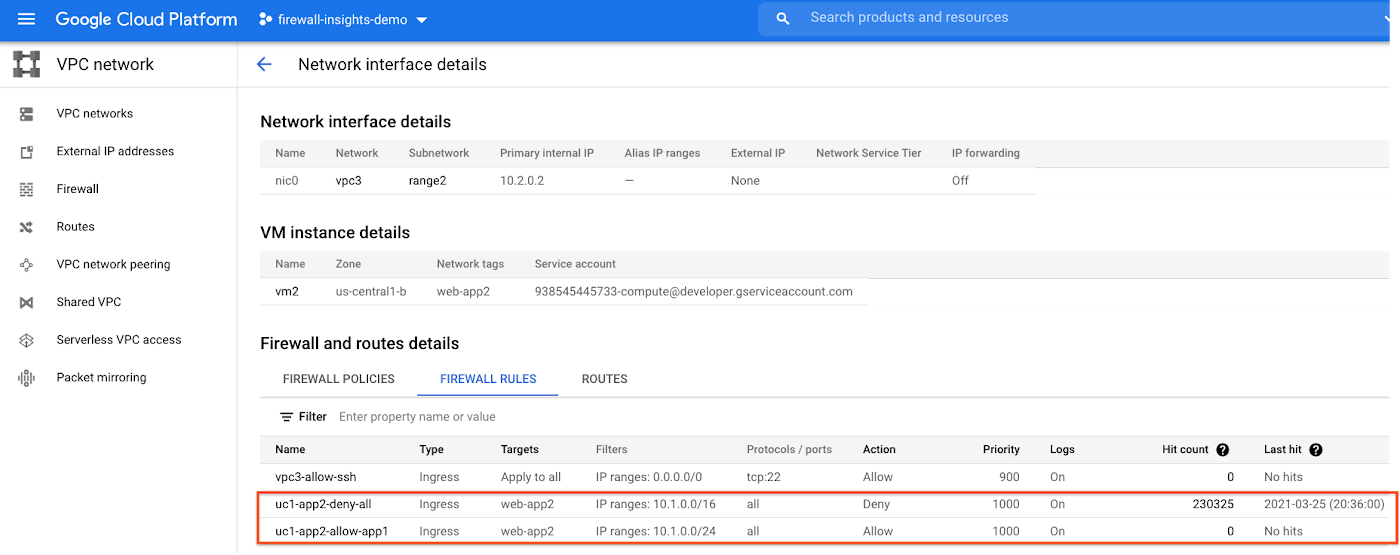
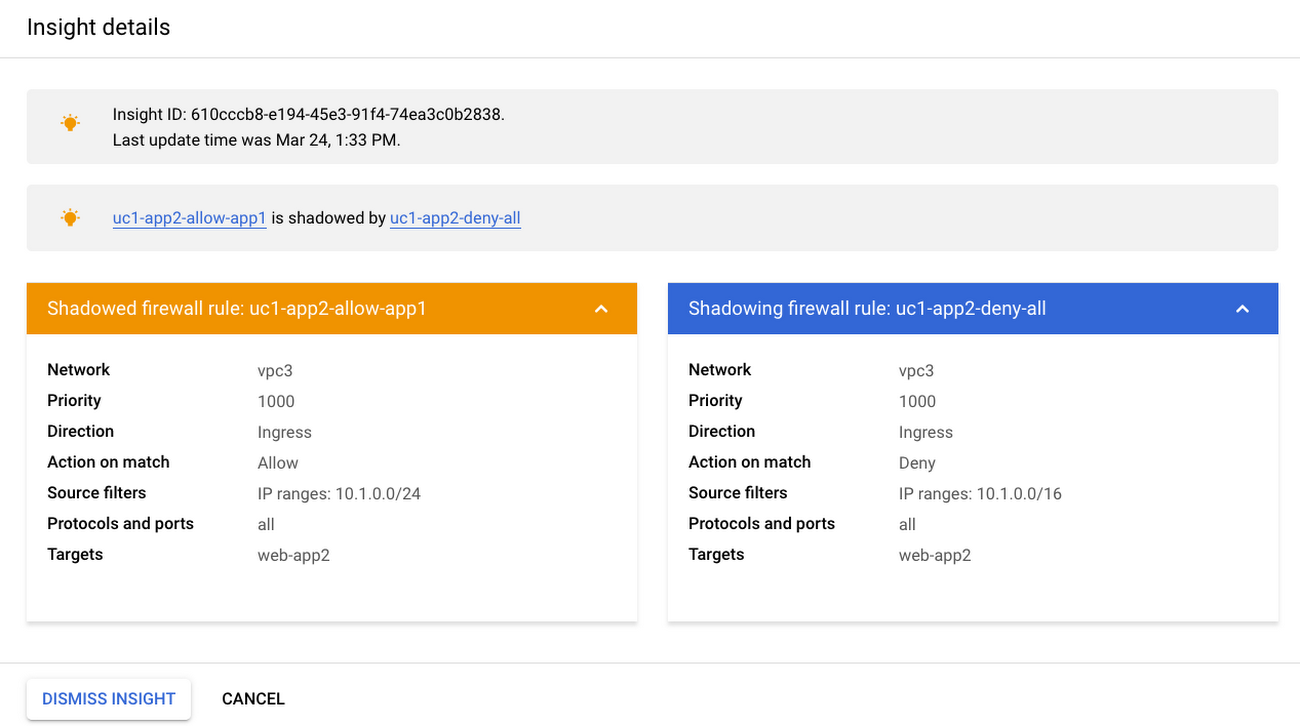
If we look closely, we can see that there are two rules with the same target tag, and those are almost identical except their source IP range. The IP range of the deny rule “uc1-app2-deny-all” includes the IP range of the rule allow “uc1-app2-allow-app1”. Therefore, we can see that “uc1-app2-allow-app1” is shadowed by “uc1-app2-deny-all”, and the ping between these VMs failed due to that.
To avoid such incidents in the future, Firewall Insights provides you with a convenient list of rules overshadowed by other firewall rules.
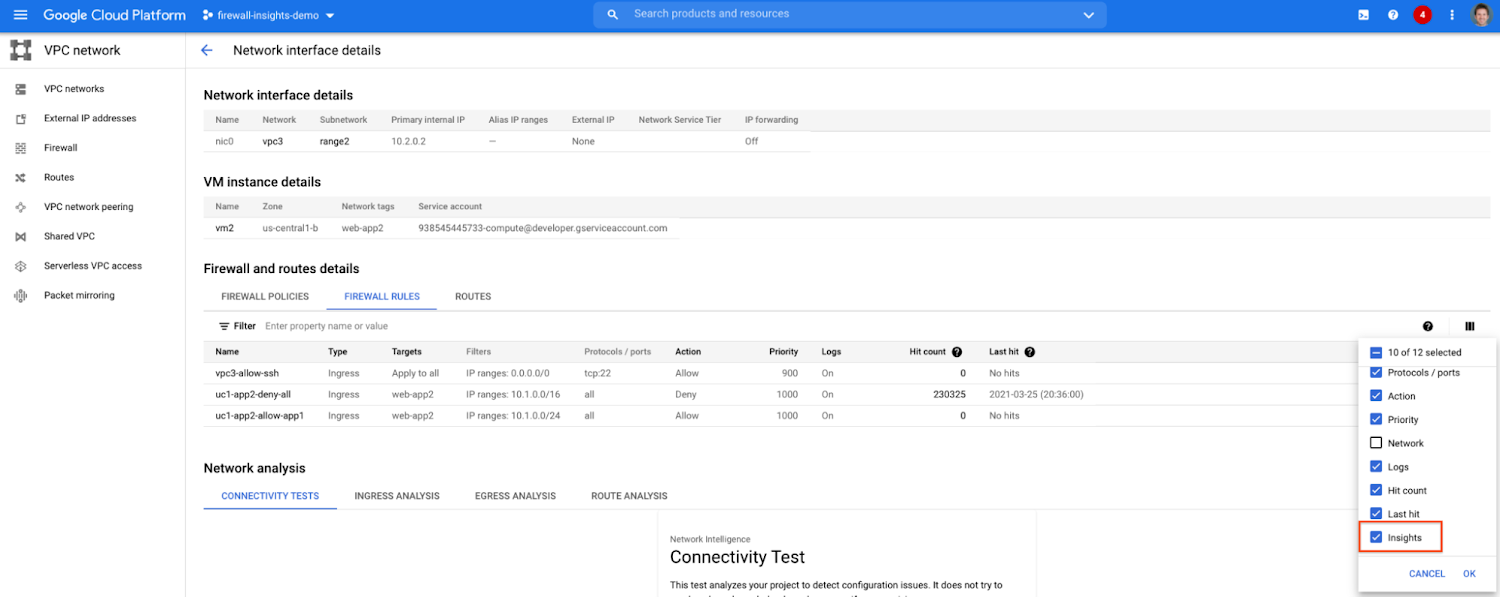
To see shadowed rules, you can click on the column selector, and add “Insights” to the firewall and route details:
Once this is applied, you will be able to see shadowed rules here:
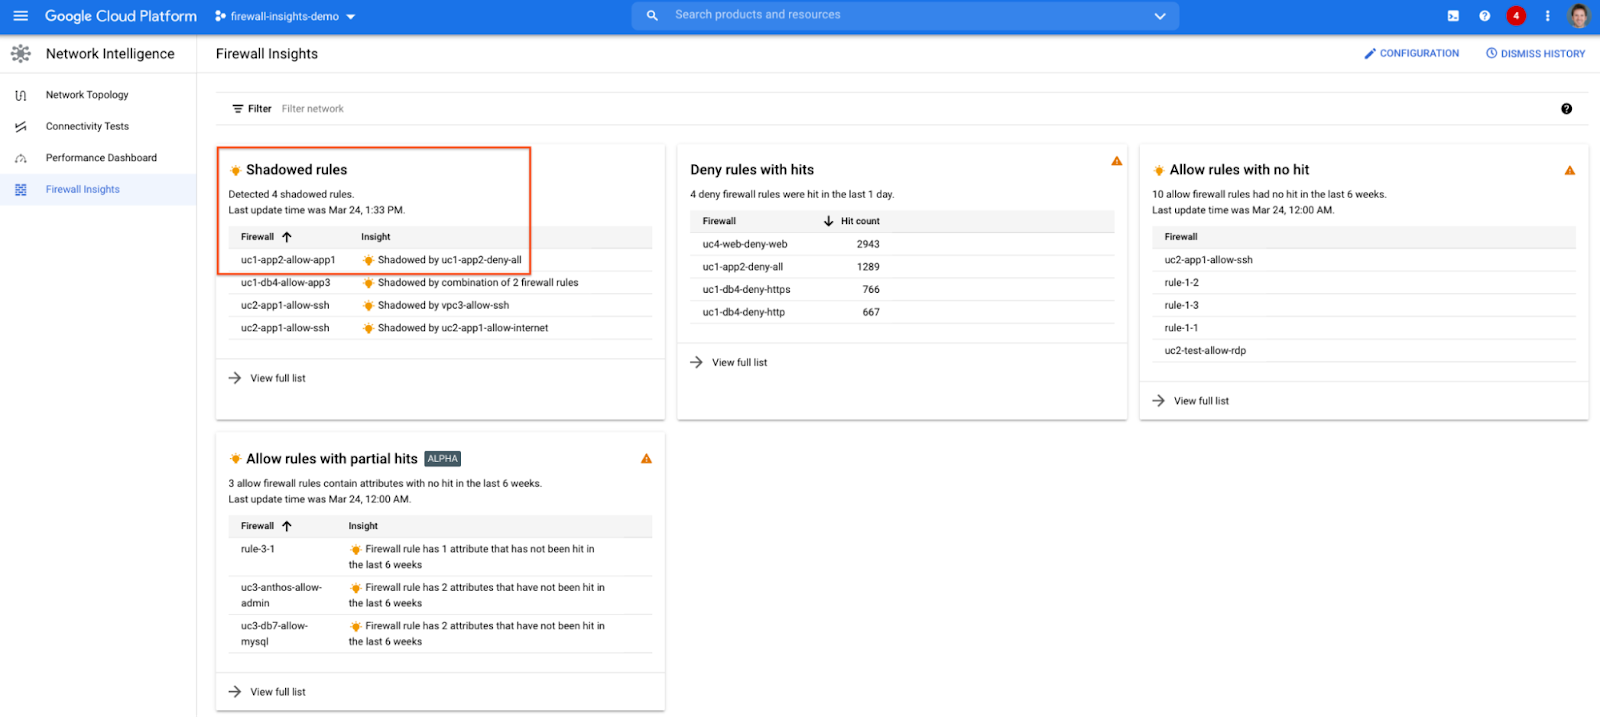
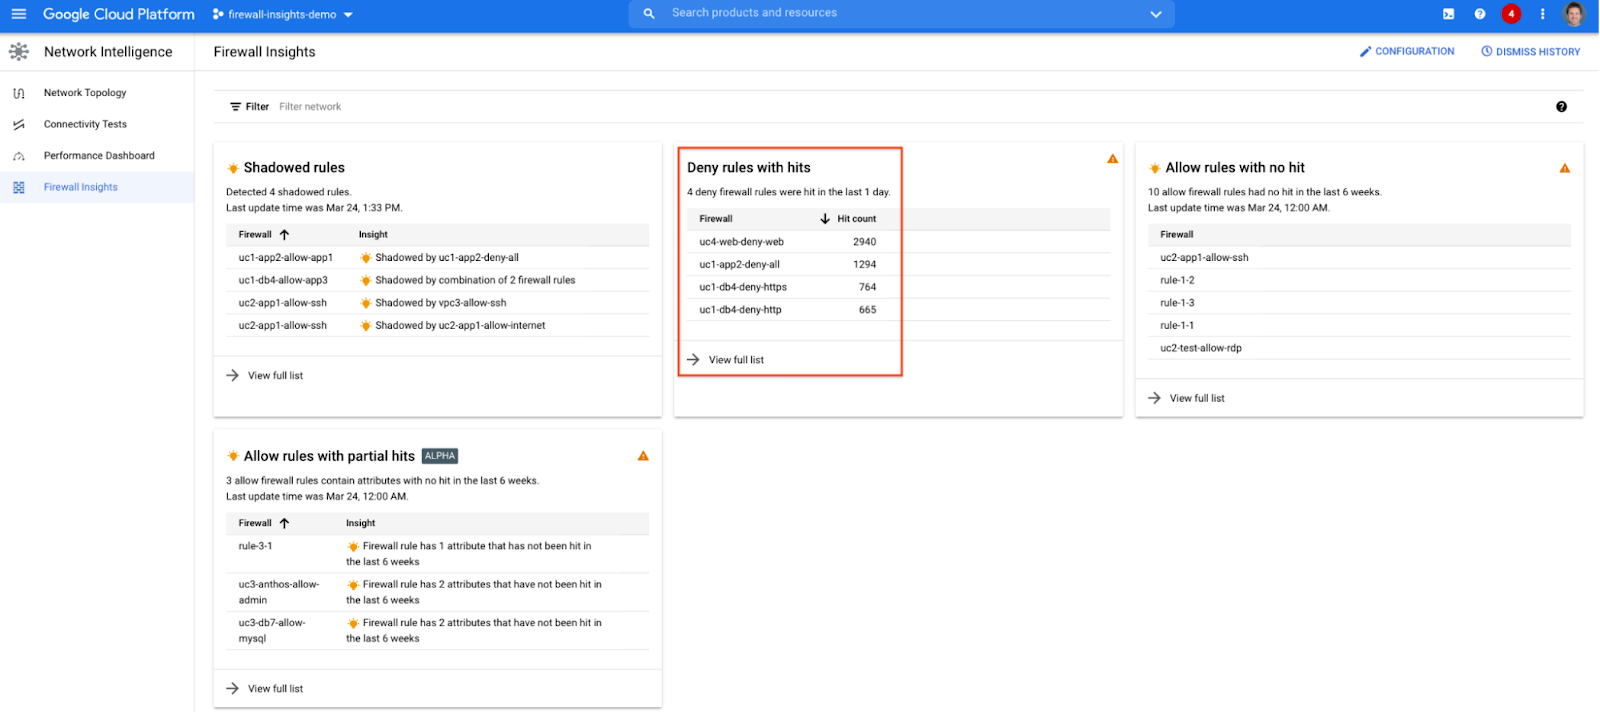
Alternatively, you can navigate to Network Intelligence > Firewall Insights, where we will see the shadowed rule report:
If we click on the insight we will get more details:
Going back to the firewall insights card (Figure 1.8), we can also identify that “uc1-db4-allow-app3” is shadowed by a combination of two rules and if we clicked on the insight this would provide all the details.
From the Firewall Insights dashboard, let’s move on to “allow rules with no hit”, where we can see firewall rules that have not logged any hits in the past six weeks. Such rules could be as a result of a misconfiguration, or leftover rules from past deployments. Tighten your security boundaries by identifying and removing such rules. If we go back to Network Intelligence > Firewall Insights, we can see allow rules with no hit:
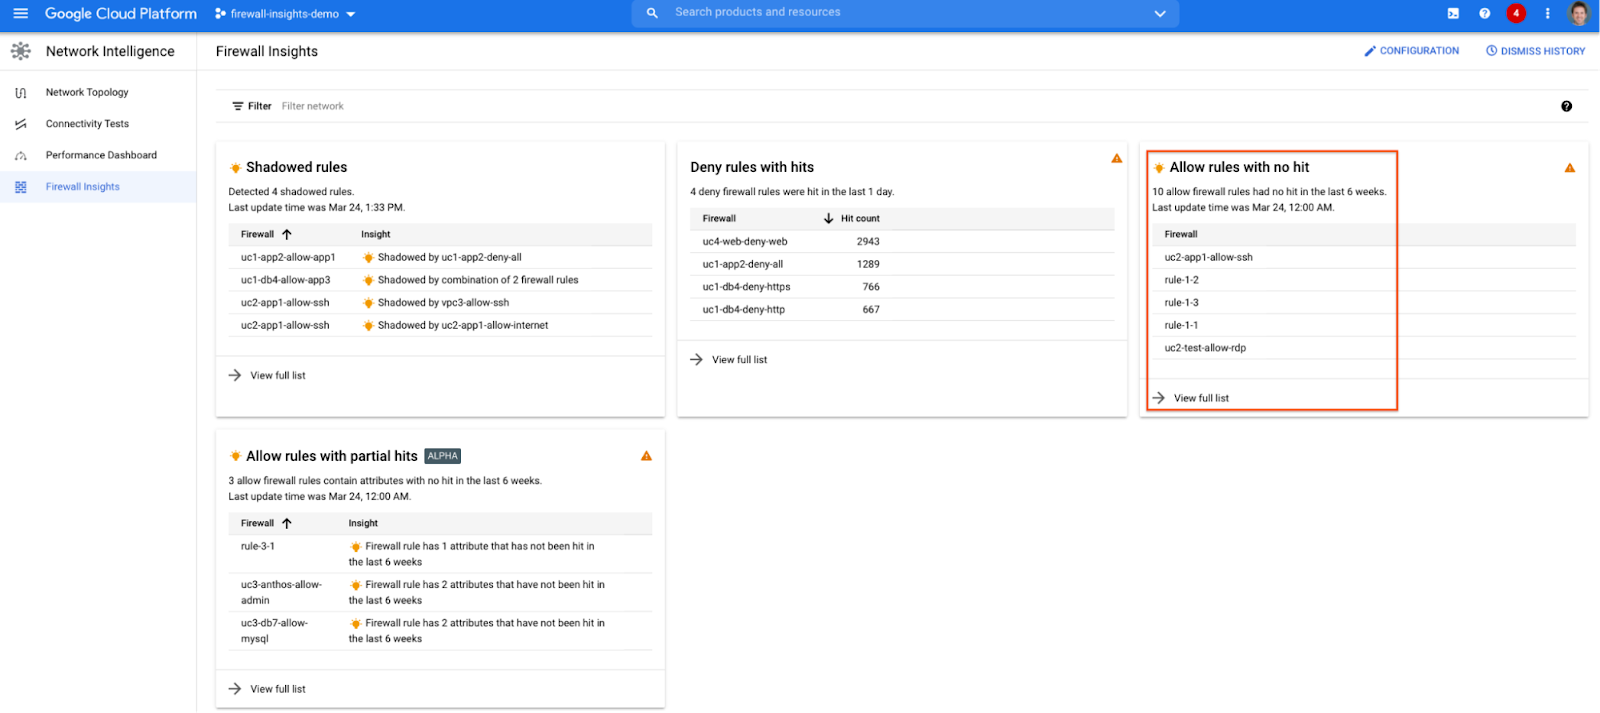
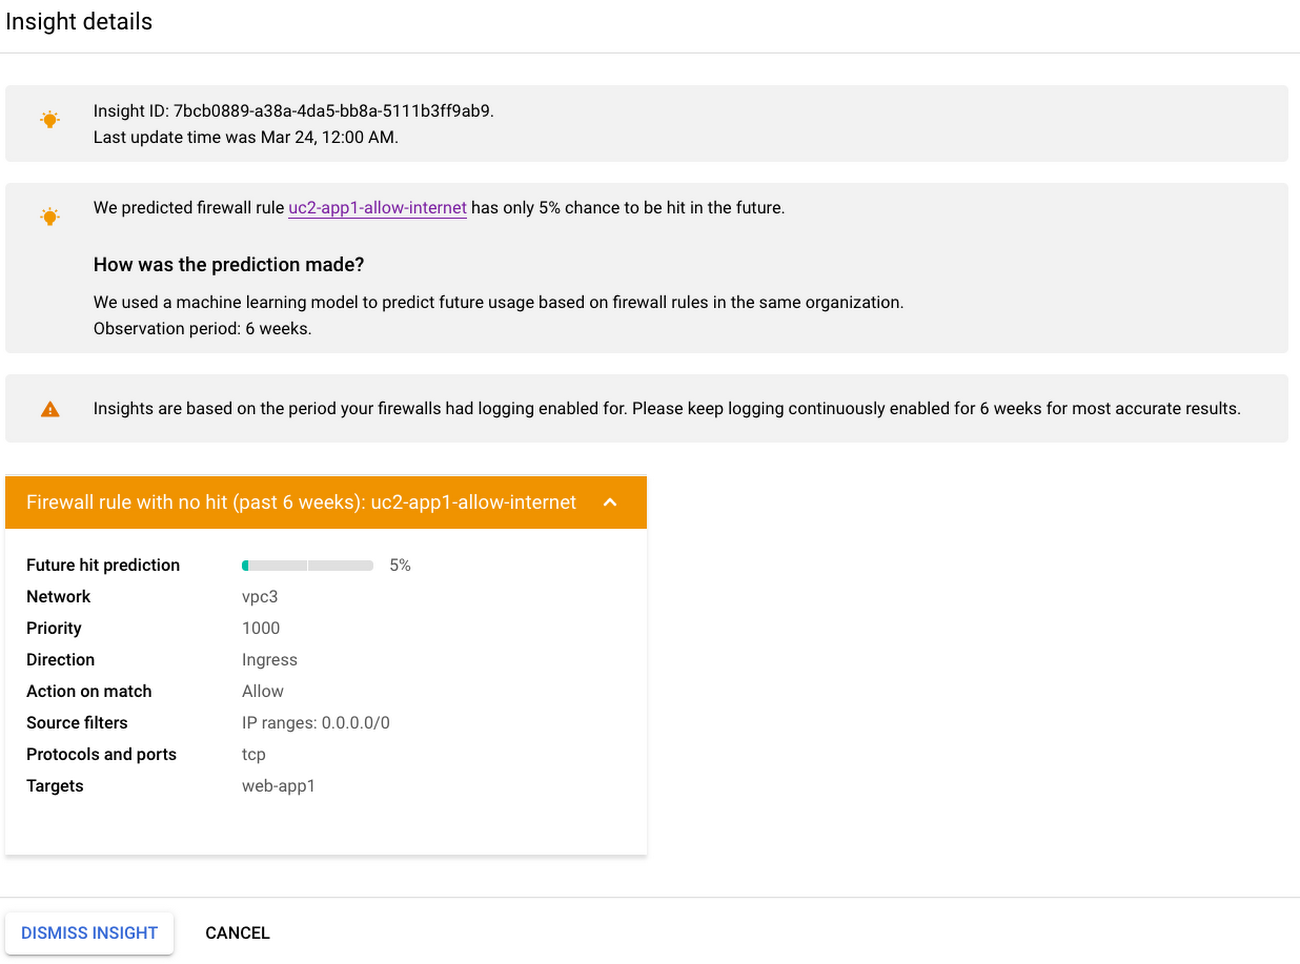
We can drill down to view the full list of rules with no hit. We can see, for instance, one of the rules, the bottom one “uc2-app1-allow-internet”, might be a leftover rule to allow internet access from a past deployment, which means it has little likelihood of being hit in the future. So you may want to consider removing it from the rule set:
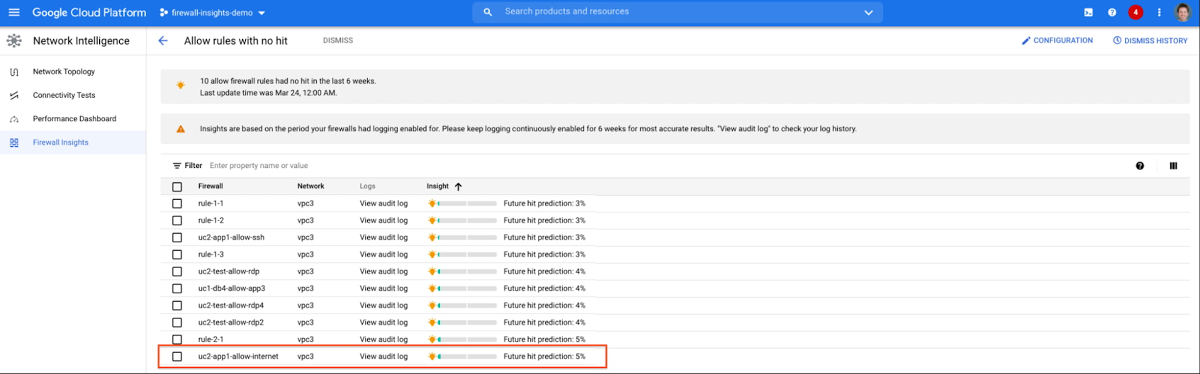
Click on the firewall rule to review all the details, and take a look at the prediction, which is made based on the hit pattern that we saw for similar rules in the same organization:
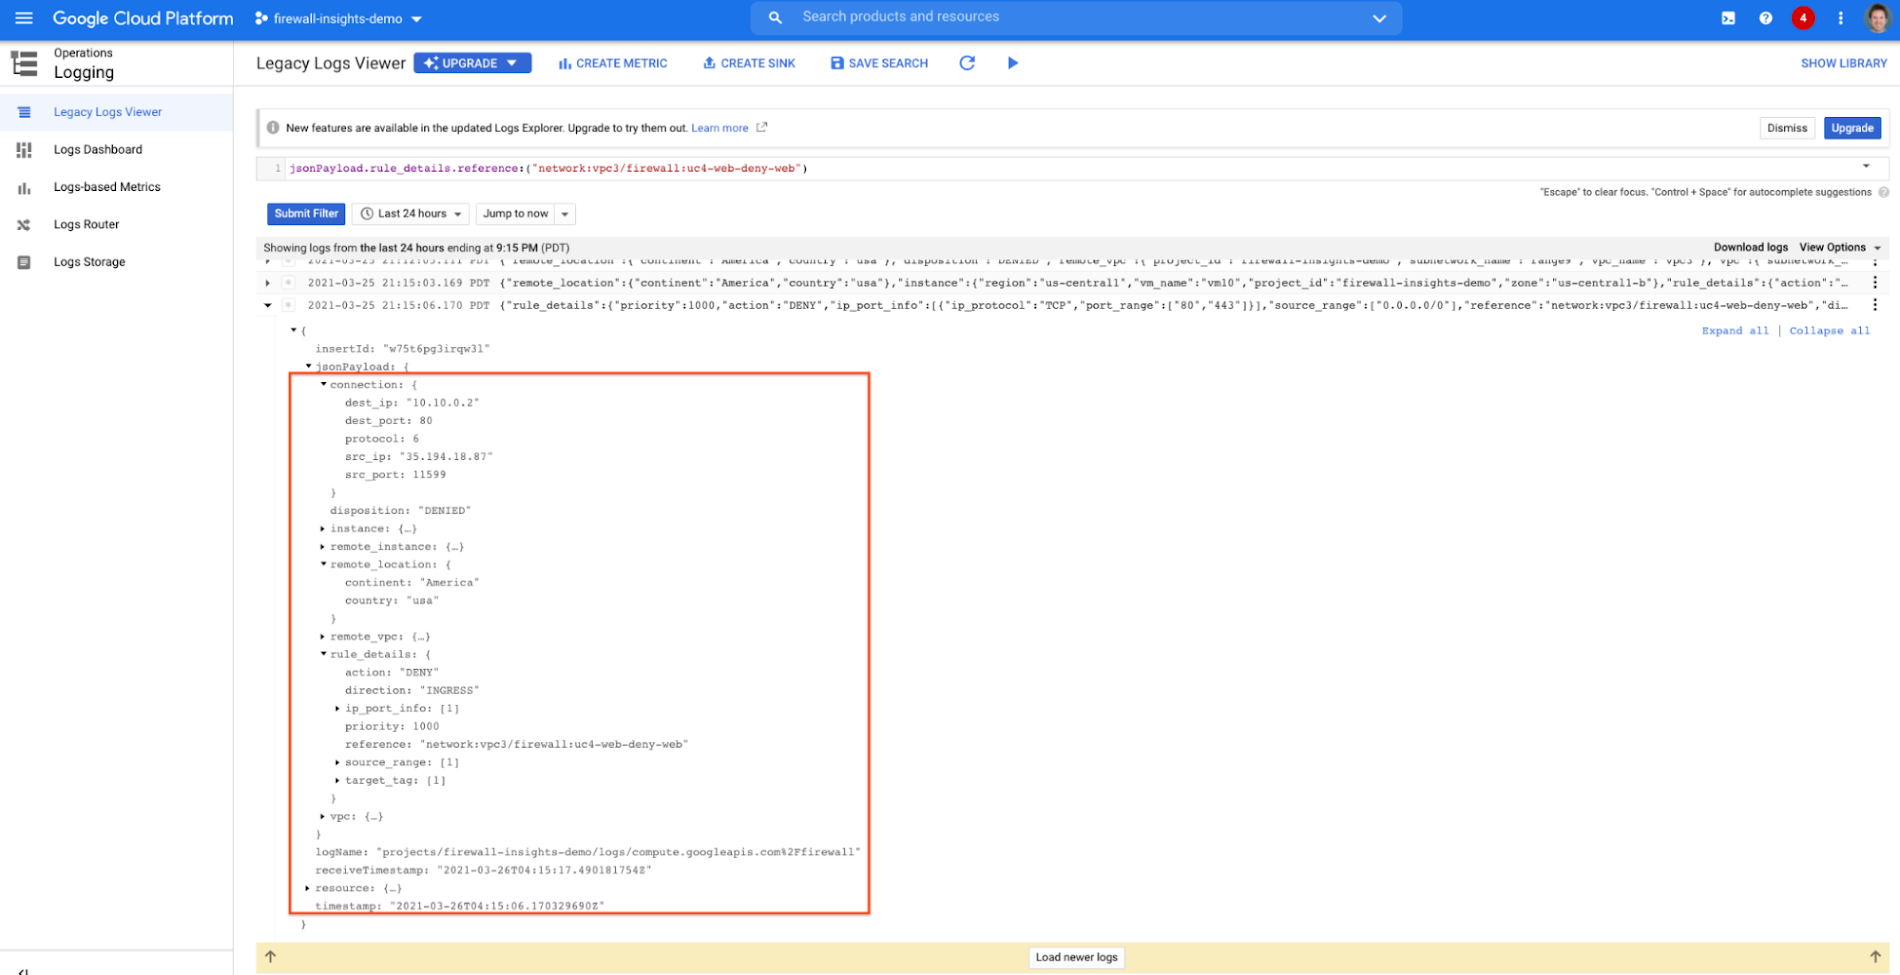
Let’s go back to the Firewall Insights dashboard and move on to the last category, “deny rules with hits in the last 24 hours”, which help you capture the traffic blocked by deny rules. These traffic types could indicate external attacks into your VPC network, or compromised VM instances attempting to send traffic out of your network. Let's examine future hit prediction on a firewall rule. Navigate to Network Intelligence > Firewall Insights and take a look at the deny rules with hits card:
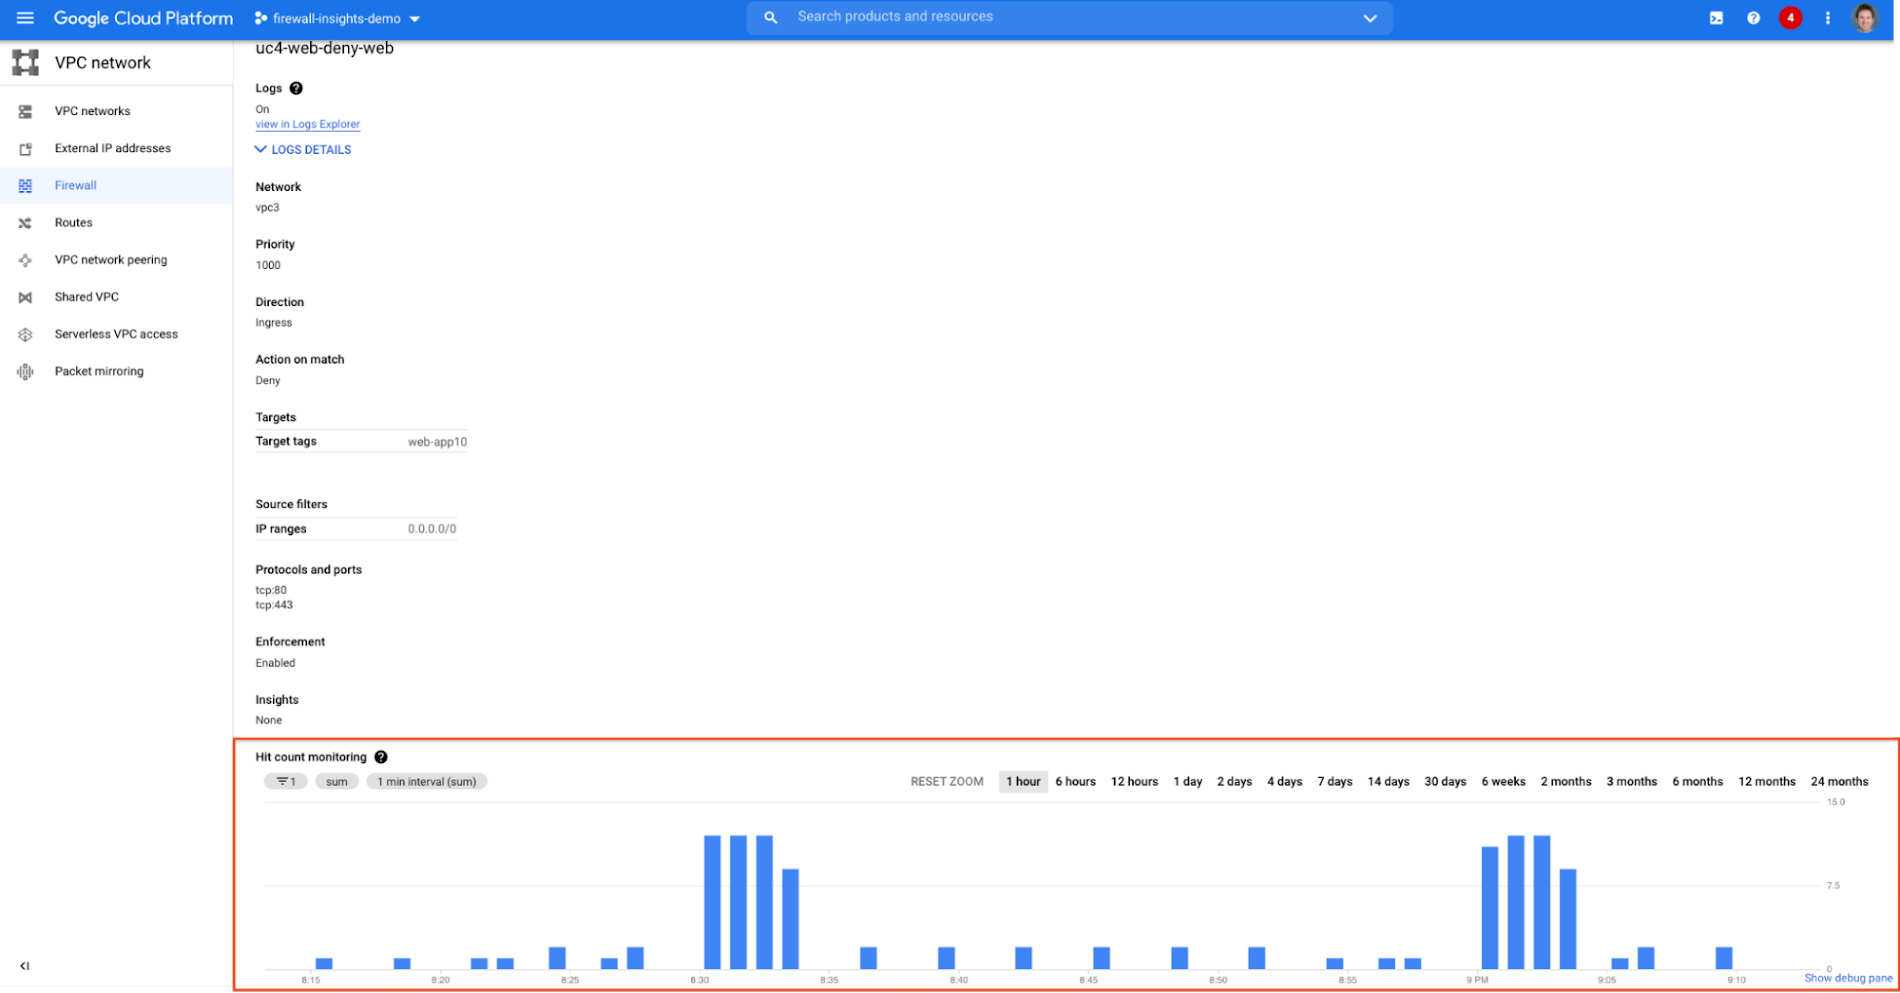
If your click on the “uc4-web-deny-web” rule, you can see the hit count monitoring, and if you click on the hit number we can dive deeper in the logs:
These tips should help you effectively leverage Firewall Insights to gain better control over a massive firewall rule set. Automate shadowed rule detection, quickly troubleshoot misconfigured rules, effortlessly pinpoint the overgranting rules hidden in the rule set, and identify the failed attempts to break into your network that were rejected by your firewall rules.
To learn more about Firewall Insights, please refer to our documentation. Additionally, to see how we're advancing intelligent automation in network security, check our recent blog post.