Troubleshooting distributed applications: Using traces and logs together for root-cause analysis
Sujay Solomon
Senior Product Manager
When troubleshooting distributed applications that are made up of numerous services, traces can help with pinpointing the source of the problem, so you can implement quick mitigating measures like rollbacks. However, not all application issues can be mitigated with rollbacks, and you need to undertake a root-cause analysis. Application logs often provide the level of detail necessary to understand code paths taken during abnormal execution of a service call. As a developer, the challenge is finding the right logs.
Let’s take a look at how you can use Cloud Trace, Google Cloud’s distributed tracing tool, and Cloud Logging together to help you perform root-cause analysis.
Imagine you’re a developer working on the Customer Relationship Management service (CRM) that is part of a retail webstore app. You were paged because there’s an ongoing incident for the webstore app and the error rate for the CRM service was spiking. You take a look at the CRM service’s error rate dashboard and notice a trace exemplar that you can view in Cloud Trace:
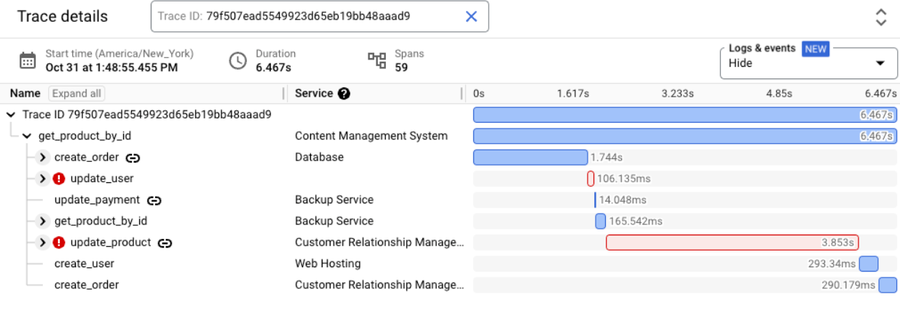
The Trace details view in Cloud Trace shows two spans with errors: update_userand update_product. This leads you to suspect that one of these calls is part of the problem. You notice that the update_product call is part of your CRM service and check to see if these errors started happening after a recent update to this service. If there’s a correlation between the errors and an update to the service, rolling back the service might be a potential mitigation.
Let’s assume that there is no correlation between updates to the CRM service and these errors. In this case, a rollback may not be helpful and further diagnosis is needed to understand the problem. A next possible step is to look at logs from this service.
The Trace details view in Cloud Trace allows users to select different views for displaying logs within the trace — selecting “Show expanded” displays all related logs under their respective spans.
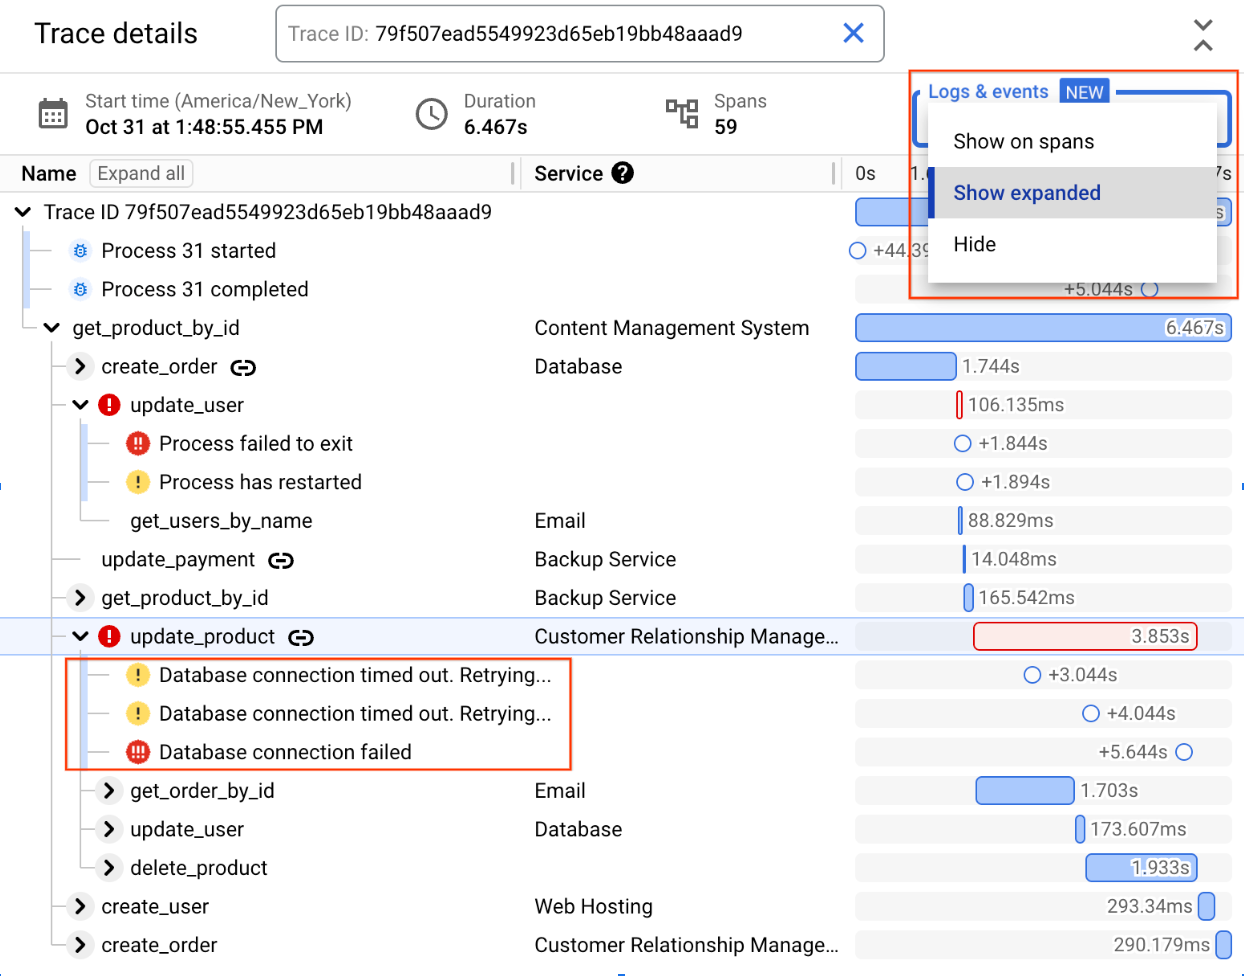
In this example, you can see that there are three database-related logs under the update_product span. After retrying a few times, the attempts to connect to the database from the CRM service have failed.
Behind the scenes, Cloud Trace is querying Cloud Logging to retrieve logs that are both in the same timeframe as the trace and reference the traceID and the spanID. Once retrieved, Cloud Trace presents these logs as child nodes under the associated span, which makes the correlation between the service call and the logs emitted during the execution of that service very clear.
You know that other services are connecting to the same database successfully, so this is likely a configuration error. You check to see if there were any config updates to the database connection from the CRM service and notice that there was one recently. Reviewing the pull request for this config update leads you to believe that an error in this config was the source of the issue. You quickly update the config and deploy it to production to address the issue.
In the above example, Cloud Trace and Cloud Logging work together to combine traces and logs into a powerful way to perform root cause analysis when mitigating measures like rollbacks are not enough.
If you’re curious about how to instrument properly for logs and trace correlation to work, here are some examples:
You can also get started by trying out OpenTelemetry instrumentation with Cloud Trace in this codelab or by watching this webinar.