Synthetic Monitoring in Cloud Monitoring is now Generally Available
Amol Devgan
Senior Product Manager
Daniel Koss
Software Engineering Tech Lead
Building user trust hinges on a reliable system and a seamless end-user experience. Any downtime or degradation in user experience can erode trust, jeopardizing an organization's reputation and bottom line. Therefore, having the ability to proactively assess the quality of end user experience offered by applications is crucial for business success.
In July 2023, we introduced synthetic monitoring, a new proactive monitoring capability that uses automated Node.js scripts to simulate user interactions with an application or service. This allows you to test the availability, consistency, and performance of your web applications, APIs, and key business workflows from the perspective of a real user, on a periodic basis.
Today, we are excited to announce the general availability of synthetic monitoring. Additionally, with this launch we are also including three new capabilities to synthetic monitoring:
- Terraform support
- Integration with Cloud Trace and Cloud Logging
- UI template for Mocha test framework
How does synthetic monitoring work?
Synthetic monitoring works by executing automated test scripts against an application endpoint from Google Cloud data centers located around the world. The test scripts simulate critical user journeys within an application, such as logging into a website, searching for a product, or adding an item to a cart. When you configure a synthetic monitor, you create a Google Cloud function that executes code in Node.js using an open source framework that is distributed and managed through Cloud Monitoring.
The results of the scripts are then collected and analyzed to determine the application's availability, consistency, and performance. If any problems are detected, alerts can be configured to notify the appropriate team so that they can be fixed before they impact your end-users.
Creating a new synthetic monitor
Google Cloud's synthetic monitoring service is easy to use and can be configured in minutes. You can create synthetic monitors for any URL or API endpoint, and you can choose from a variety of pre-built scripts or create your own.
To get started, you can head to Monitoring > Synthetic Monitoring and select “+ Create Synthetic Monitor”> Custom synthetic monitor. You select the name of the synthetic monitor, its frequency of execution, and other settings.
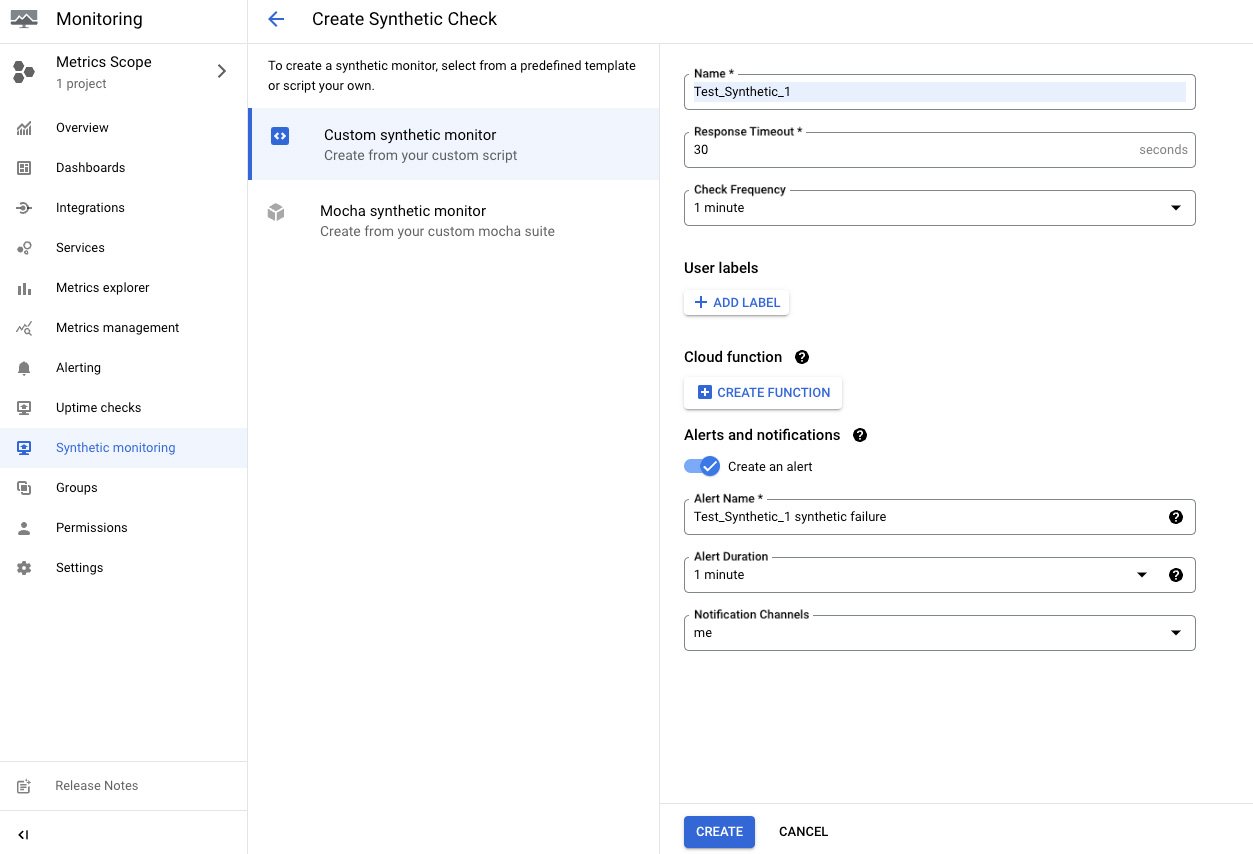
Next, you create a cloud function that will be the target of the synthetic monitor. By clicking “Create Function,” a fly-out is launched that is used to configure the cloud function. At this step, you may name your function, or manage advanced settings such as the ability for this function to have access to an internal VPC network. You are also met with sample code for the function to execute.
Google Cloud's synthetic monitoring is highly scalable. You can monitor thousands of URLs or API endpoints with a single account. And, because it's powered by Google Cloud, you can be confident that your synthetic monitors will be reliable and accurate.
New features in this release
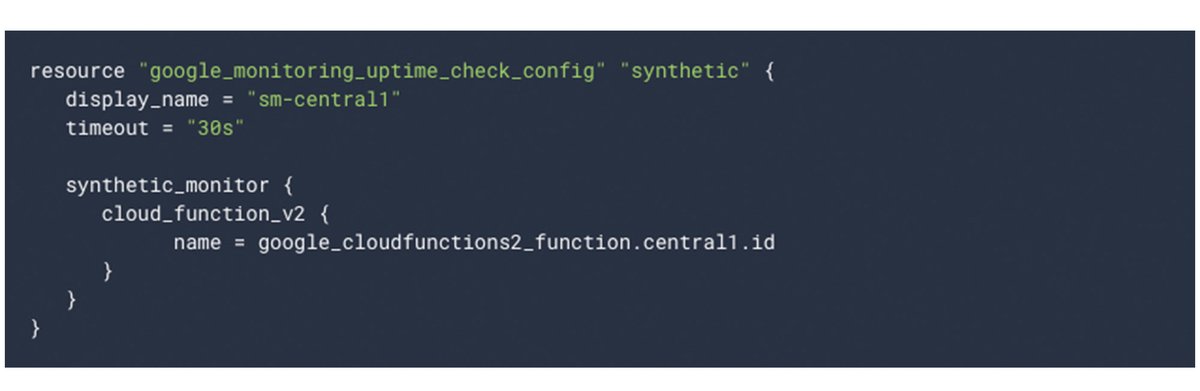
1. Terraform support
In addition to GA, we are also announcing support for Terraform, an open-source infrastructure as code (IaC) software tool that allows you to define and provision your cloud infrastructure using code. To get started with creating a synthetic monitor using Terraform, visit this link.
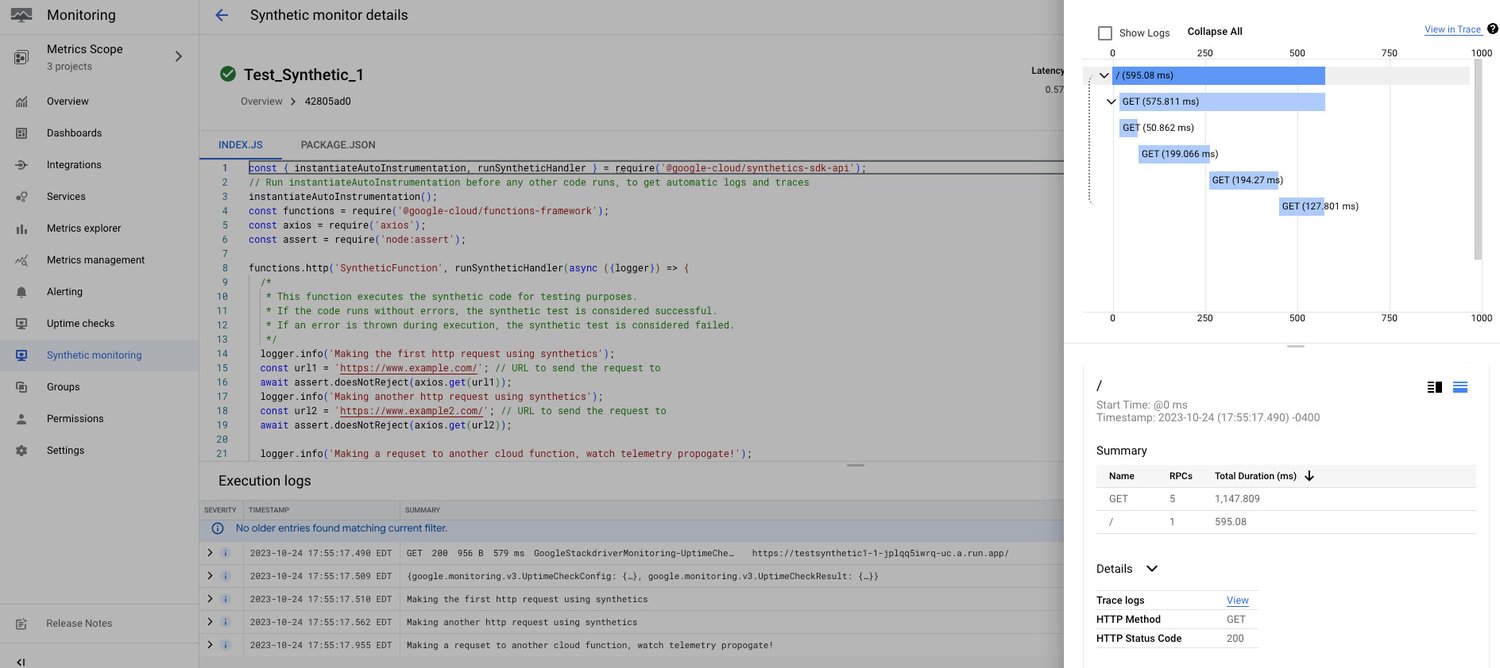
2. Integration with Cloud Trace and Cloud Logging
You can now also collect trace and log data for any outbound HTTP requests made by your synthetic monitors. Trace and log data can be used to quickly identify performance issues and troubleshoot any failures in your web application, by pointing out the line of code that failed, the error types, and the error messages. To read more about enabling your synthetic monitors to collect trace and log data, visit this link.
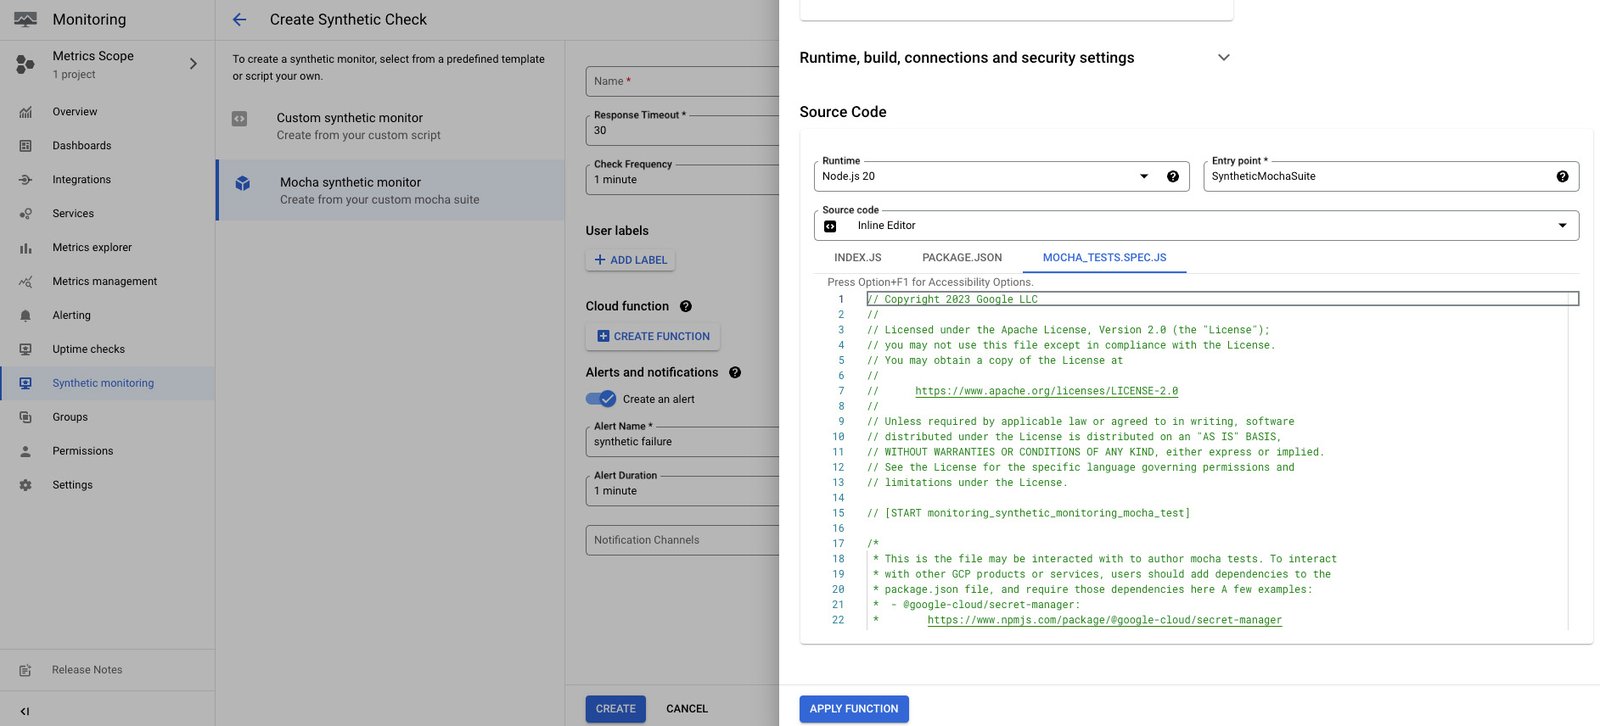
3. UI template for Mocha test framework
Mocha is a popular JavaScript test framework that is known for its simplicity, flexibility, and extensibility. To make it easier to create tests using the Mocha framework, we are including a Mocha-based UI template in the create flow, alongside the existing generic template.
More information
Visit our documentation where you can get additional information and step-by-step instructions for creating your first synthetic monitor.
Lastly, if you have questions or feedback about this new feature, head to the Cloud Operations Community page and let us know!