Collect OTLP data from GKE apps with new curated OpenTelemetry ingestion pipeline
Mike Dame
Software Engineer
OpenTelemetry is an open-source, vendor-agnostic observability standard for logs, metrics, and traces that’s quickly growing as a format for application monitoring, thanks to its collection of libraries, agents, compatible backends, and community support.
As more customers told us they wanted to adopt the OpenTelemetry standard for Google Kubernetes Engine (GKE), we provided documentation on instrumenting your applications with OpenTelemetry. Today, we're excited to announce a new curated OpenTelemetry Protocol pipeline for GKE and documentation to simplify the process of collecting OTLP data from your instrumented applications and exporting it to Cloud Observability.
What is the OTLP pipeline?
The OpenTelemetry Protocol (OTLP) defines a standard, vendor-agnostic data format for application logs, metrics, and traces. Applications instrumented with OpenTelemetry to report these signals with OTLP can use an OpenTelemetry Collector to process and route that data.
On GKE, this means that your workload pods can be instrumented with OpenTelemetry and export that data to be handled by a Collector that sends logs, metrics, and traces to Google Cloud Observability.
The curated OTLP Ingestion Pipeline is a set of Kubernetes manifests, pre-configured to deploy the minimum necessary resources to install an OpenTelemetry Collector in your GKE cluster. It includes:
-
A deployment of the open source OpenTelemetry Collector
-
A Collector configuration designed with common GKE use cases and known issues in mind, including support for high-volume signals and resource detection
-
Necessary role-based access control resources to enable the Collector to identify workloads and communicate with GCP Observability backends
The goal of this pipeline is to provide an out-of-the-box solution to quickly get started with OTLP collection, with the ability to add configurations to suit your needs.
What this sample offers
Manually deploying and configuring an OTLP pipeline can be a tedious process. With the number of configuration options available, it’s not always clear which settings are optimal for your environment and backend.
Fortunately, most use cases on GKE can be optimized for Google Cloud Observability with a common config, which this pipeline provides. This config handles the following scenarios:
-
Resource detection, precisely identifying workloads on GKE that are the sources of telemetry
-
Batching telemetry data up to the maximum throughput allowed by Google Cloud Observability, reducing the amount of API calls made by the Collector
-
Memory limiting configured to prevent Collector OOM crashes
-
Transformations to prevent metric conflicts and ensure attribute naming in compliance with Google Cloud and OpenTelemetry standards
This default config is Google-supported, and is validated by additional tests to make sure it remains accurate and compatible with new releases of the OpenTelemetry Collector.
The manifests in this pipeline install the Collector with the above config settings in a Kubernetes Deployment, which we have specifically chosen as a good installation mode for most use cases due to its ability to offer high availability uptime alongside cluster-wide resource detection.
The full Collector config and Kubernetes manifests are available on GitHub and can be installed with the standard `kubectl` CLI using `kustomize`.
Deploying and using the pipeline
The OTLP pipeline requires a Google Cloud Service Account to send data to the GCP Observability backend. To set one up, use the following commands:
Then, deploy the OTLP pipeline directly from GitHub using `kubectl` with the following command:
Once the pipeline is installed, your OpenTelemetry-instrumented applications can export directly to the newly installed collector at the following endpoint:
You can easily set this on your applications using the OpenTelemetry SDK Configuration environment variable `OTEL_EXPORTER_OTLP_ENDPOINT`.
For more information, check out our documentation on how to deploy the OpenTelemetry Collector on GKE.
Debugging and support
This pipeline includes a pre-configured observability dashboard to monitor self-observability metrics from the Collector. This dashboard is available in the Google Cloud Monitoring Sample Dashboards. To install it, add the OpenTelemetry Collector dashboard from the Sample Library.
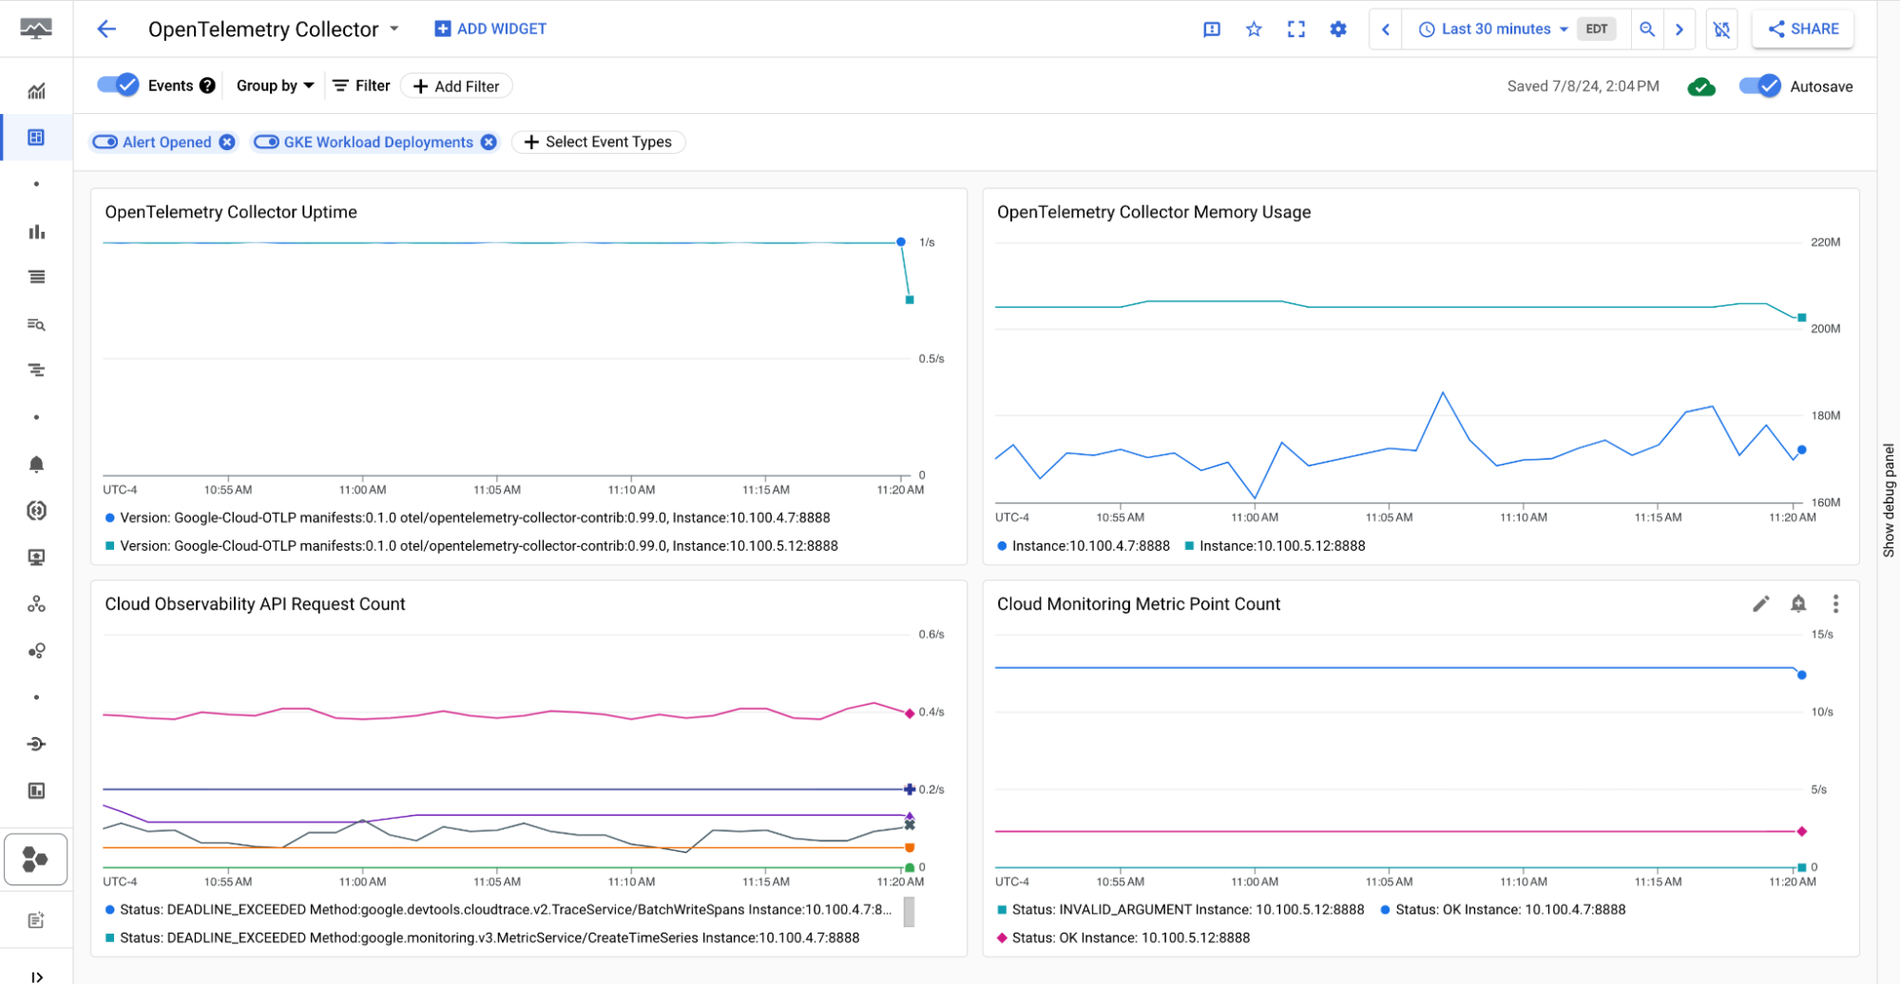
With the sample dashboard installed, you can now monitor the Collector’s uptime and memory usage, as well as the number of API requests it makes to Cloud Observability. Use these values to monitor the Collector’s health and usage.
For any questions, bug reports, and feature requests please open an issue on GitHub and our team will respond.
Next steps
To learn more and get started, check out our documentation for instrumenting your applications with OpenTelemetry, setting up the OTLP ingestion pipeline, and GitHub repo.