Understanding Firestore performance with Key Visualizer

Per Jacobsson
Principal Software Engineer
Amarnath Mullick
Staff Software Engineer
Firestore is a serverless, scalable, NoSQL document database. It is ideal for rapid and flexible web and mobile application development, and uniquely supports real-time client device syncing to the database.
To get the best performance out of Firestore, while also making the most out of Firestore's automatic scaling and load balancing features, you need to make sure the data layout of your application allows requests to be processed optimally, particularly as your user traffic increases. There are some subtleties to be aware of when it comes to what could happen when traffic ramps up, and to help make this easier to identify, we’re announcing the General Availability of Key Visualizer, an interactive, performance monitoring tool for Firestore.
Key Visualizer generates visual reports based on Firestore documents accessed over time, that will help you understand and optimize the access patterns of your database, as well as troubleshoot performance issues. With Key Visualizer, you can iteratively design a data model or improve your existing application’s data usage pattern.
Tip: While Key Visualizer can be used with production databases, it’s best to identify performance issues prior to rolling out changes in production. Consider running application load tests with Firestore in a pre-production environment, and using Key Visualizer to identify potential issues.
Viewing a visualization
The Key Visualizer tool is available to all Firestore customers. Visualizations are generated at every hour boundary, covering data for the preceding two hours. Visualizations are generated as long as overall database traffic during a selected period meets the scan eligibility criteria.
To get an overview of activity using Key Visualizer, first select a two-hour time period and review the heatmap for the "Total ops/s" metric. This view estimates the number of operations per second and how they are distributed across your database. Total ops/s is an estimated sum of write, lookup, and query operations averaged by seconds.
Firestore automatically scales using a technique called range sharding. When using Firestore, you model data in the form of documents stored in hierarchies of collections. The collection hierarchy and document ID is translated to a single key for each document. Documents are logically stored and ordered lexicographically by this key. We use the term "key range" to refer to a range of keys. The full key range is then automatically split up as-needed, driven by storage and traffic load, and served by many replicated servers inside of Firestore.
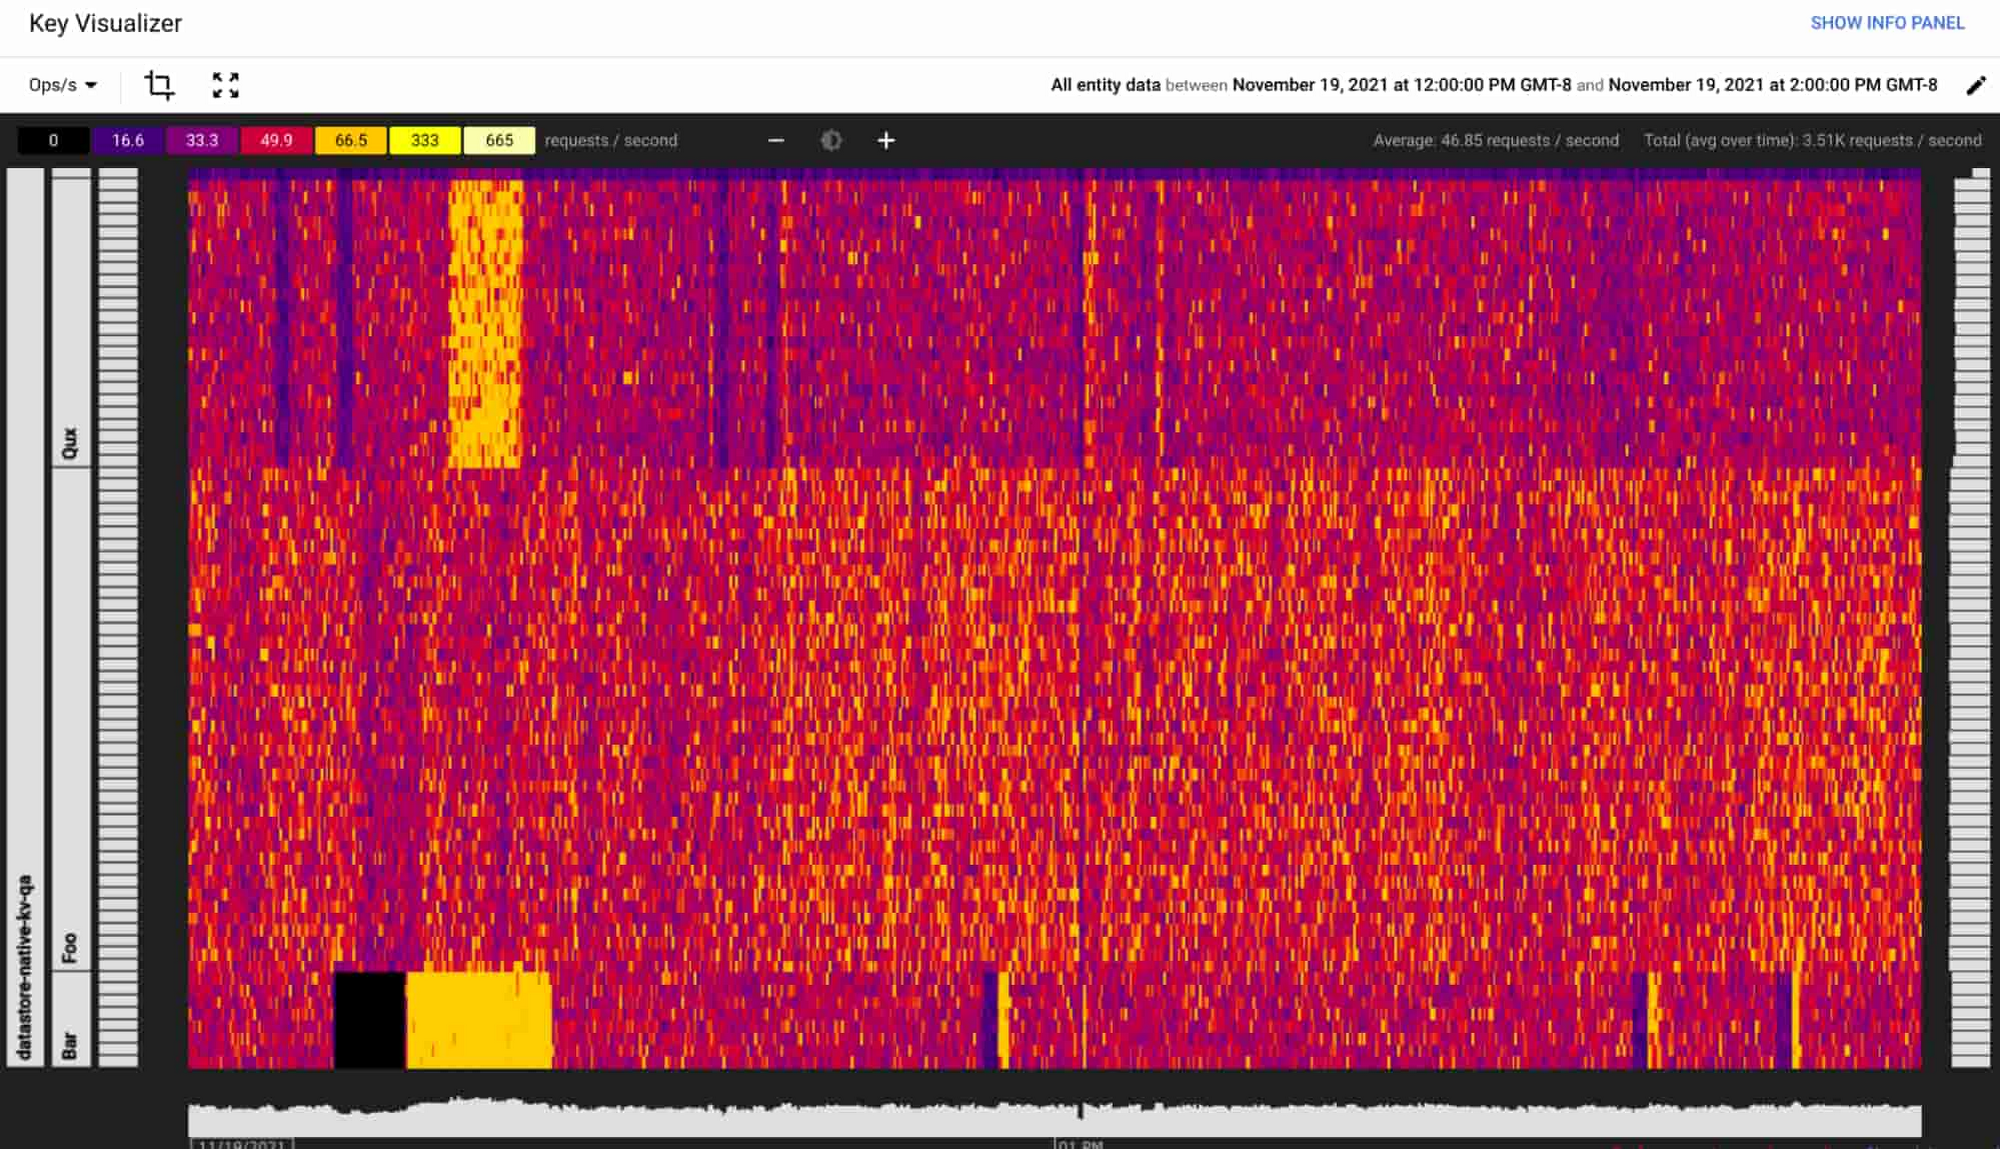
The following example of Key Visualizer visualization shows a heatmap where there are some major differences in the usage pattern across the database. The X-axis is time, and the Y-axis is the key range for your database, broken down into buckets by traffic.
Ranges shown in dark colors have little or no activity.
Ranges in bright colors have significantly more activity. In the example below, you can see the "Bar" and "Qux" collections going beyond 50 operations per second for some period of time.


Additional methods of interpreting Key Visualizer visualizations are detailed in our documentation.
Besides the total number of operations, Key Visualizer also provides views with metrics for ops per second, average latency, and tail latency, where traffic is broken down for writes and deletes, lookups, and queries. This capability allows you to identify issues with your data layout or poorly balanced traffic that may be contributing to increased latencies.
Hotspots and heatmap patterns
Key Visualizer gives you insight into how your traffic is distributed, and lets you understand if latency increases correlate with a hotspot, thus providing you with information to determine what parts of your application need to change. We refer to a "hotspot" as a case where traffic is poorly balanced across the database's keyspace. For the best performance, requests should be distributed evenly across a keyspace. The effect of a hotspot can vary, but typically hotspotting causes higher latency and in some cases, even failed operations.
Firestore automatically splits a key range into smaller pieces and distributes the work of serving traffic to more servers when needed. However, this has some limitations. Splitting storage and load takes time, and ramping up traffic too fast may cause hotspots while the service adjusts. The best practice is to distribute operations across the key range, while ramping up traffic on a cold database with 500 operations per second, and then increasing traffic by up to 50% every 5 minutes. This is called the "500/50/5" rule, and allows you to rapidly warm up a cold database safely. For example, ramping to 1,000,000 ops/s can be achieved in under two hours.
Firestore can automatically split a key range until it is serving a single document using a dedicated set of replicated servers. Once this threshold is hit, Firestore is unable to create further splits beyond a single document. As a result, high and sustained volumes of concurrent operations on a single document may result in elevated latencies. You can observe these high latencies using Key Visualizer’s average and tail latency metrics. If you encounter sustained high latencies on a single document, you should consider modifying your data model to split or replicate the data across multiple documents.
Key Visualizer will also help you identify additional traffic patterns:


Evenly distributed usage: If a heatmap shows a fine-grained mix of dark and bright colors, then reads and writes are evenly distributed throughout the database. This heatmap represents an effective usage pattern for Firestore, and no additional action is required.


Sequential Keys: A heatmap with a single bright diagonal line can indicate a special hotspotting case where the database is using strictly increasing or decreasing keys (document IDs). Sequential keys are an anti-pattern in Firestore, which will result in elevated latency especially at higher operations per second. In this case, the document IDs that are generated and utilized should be randomized. To learn more, see the best practices page.


Sudden traffic increase: A heatmap with a key range that suddenly changes from dark to bright indicates a sudden spike in load. If the load increase isn’t well distributed across the key range, and exceeds the 500/50/5 rule best practice, the database can experience elevated latency in the operations. In this case, the data layout should be modified to reflect a better distribution of usage and traffic across the keyspace.
Next steps
Firestore Key Visualizer is a performance monitoring tool available to administrators and developers to better understand how their applications interact with Firestore. With this launch, Firestore joins our family of Cloud-native databases, including Cloud Spanner and Cloud Bigtable, in offering Key Visualizer to its customers. You can get started with Firestore Key Visualizer for free, from the Cloud Console.
Special thanks to Minh Nguyen, Lead Product Manager for Firestore, for contributing to this post.


