Cloud SQL - SQL Server Performance Analysis and Query Tuning
Matthew Smith
Strategic Cloud Engineer
The following blog covers popular performance analysis tools and technologies database administrators can use to tune and optimize Cloud SQL for SQL Server. Common performance challenges are described in each section along with tools and strategies to analyze, address and remediate them. After reviewing this blog, consider applying the tools and processes detailed in each section to a non-production database in order to gain a deeper understanding of how they can help you to manage and optimize your databases. We will also publish a follow up blog that will walk you through common performance issues and how to troubleshoot and remediate those using the tools and processes described here.
1. Getting Started: Connecting to your Cloud SQL for SQL Server instance.
The most common use cases for connecting to Cloud SQL include connecting from a laptop over VPN and using a jump host in GCP.
SQL Server DBAs who connect from a local laptop over VPN using SQL Server Management Studio (SSMS) should review this Quickstart document for connecting to a Cloud SQL instance that is configured with a private IP address.
DBAs may also prefer to connect to a single jump host for centralized management of multiple Cloud SQL for SQL Server instances. In this scenario, a Google Compute Engine (GCE) VM is provisioned and DBAs use a Remote Desktop Protocol (RDP) tool to connect to the jump host and manage their Cloud SQL databases. For a comprehensive list of options on connecting to Cloud SQL, see connecting to Cloud SQL for SQL Server.
2. Activity Monitoring: What’s running right now?
When responding to urgent support calls, DBAs have an immediate need to determine what is currently running on the instance. Historically, DBAs have relied on system stored procedures such as sp_Who and sp_Who2 to support triage and analysis.
To determine what’s running right now, consider installing Adam Machanic’s sp_WhoIsActive stored procedure. To view currently running statements and to obtain details on the plans, use the statement below. Note that in the following example, the procedure sp_WhoIsActive has been installed on the dbo schema of the dbtools database.
EXEC dbtools.dbo.sp_WhoIsActive @get_plans=1
Also, see Brent Ozar’s sp_BlitzFirst stored procedure, which is included in the SQL-Server-First-Responder-Kit. Review the documentation for examples.
3. Optimizing queries using the SQL Server Query Store.
Query optimization is best to be performed proactively as a weekly DBA checklist item. The SQL Server Query Store feature can help with this and provides DBAs with query plans, history and useful performance metrics. Before starting the SQL Server Query Store, it is a good idea to review the following Microsoft SQL Server Performance Monitoring article: Monitoring performance by using the Query Store . Query Store is enabled on a database level and must be enabled for each user database. See the example below for how to enable Query Store.
ALTER DATABASE <<DBNAME>>SET QUERY_STORE = ON (WAIT_STATS_CAPTURE_MODE = ON);
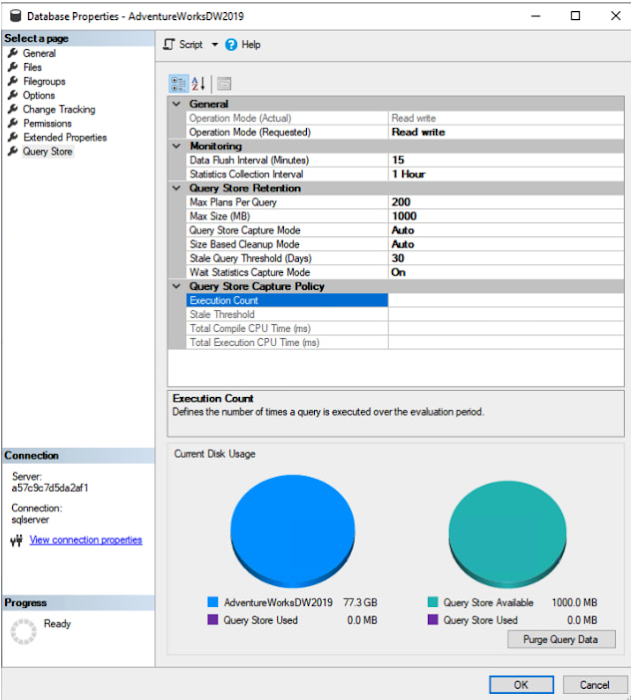
After enabling Query Store, review the Query Store configuration using SSMS. Right-click on the database and view Query Store properties. Review the Microsoft article Monitoring performance by using the Query Store for more information on properties and settings.
Screenshot: Query Store has been enabled on the AdventureWorksDW2019 database.

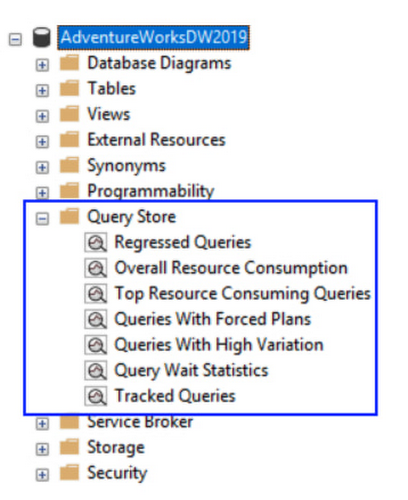
After enabling Query Store on a busy instance, query data will normally be available for review within a few minutes. Alternatively, run a few test queries to generate data for analysis. Next, expand the Query Store node to explore available reports.

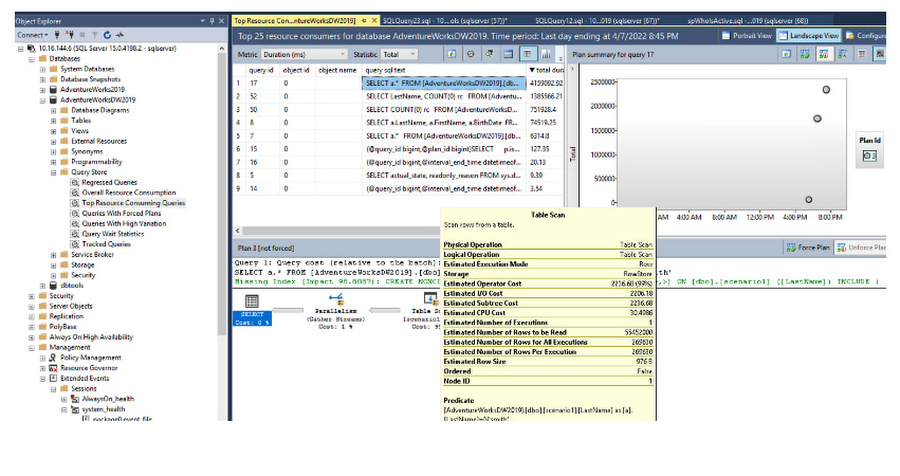
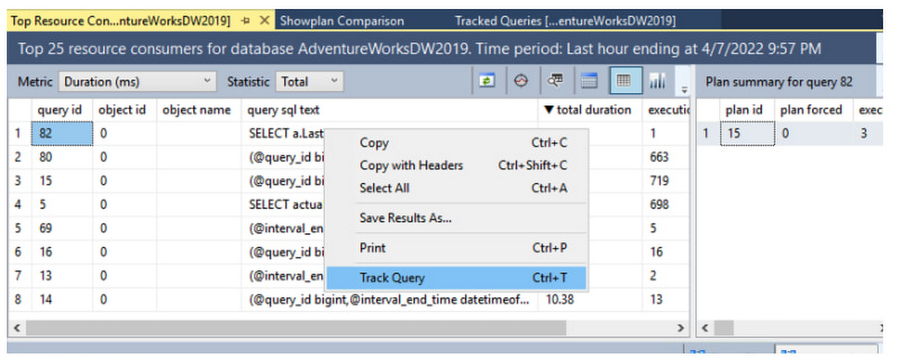
In the example below, I selected “Top Resource Consuming Queries”. I then sorted the table by total duration and reviewed the execution plan for the top resource consuming query. In reviewing the execution plan I noted that a table scan was occurring. I was then able to remediate the issue by asking the user to modify their query to select specific columns rather than selecting all the columns, and then added a non-clustered index to the underlying table to include the required columns.

Example Index Change:
To track a query over time, right-click the query and select “Track Query”.

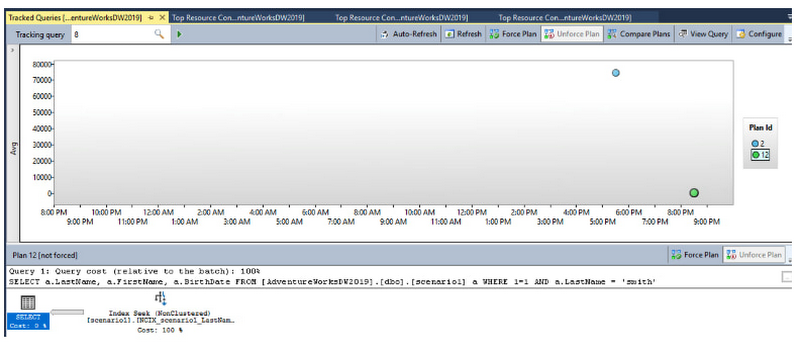
Note that the plans for before and after the index change are shown below.

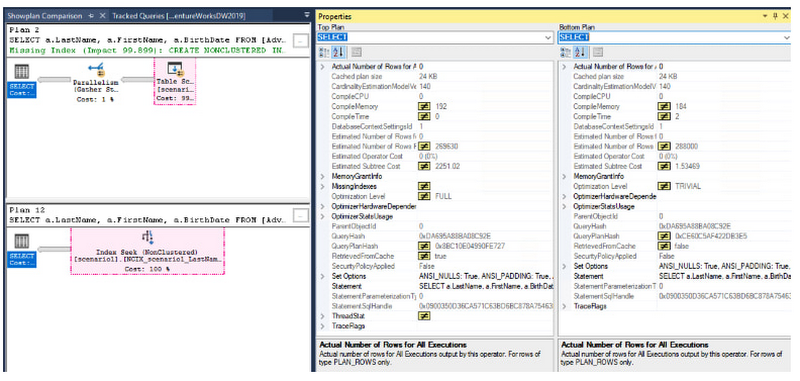
Select both plans, then choose “Compare Plans” to view pre and post plan changes.

SQL Server Query Store is a helpful built-in performance tuning tool that is available for Cloud SQL DBAs to capture, analyze and tune T-SQL statements. It makes sense to spend time learning about how Query Store can help you manage and optimize your SQL Server databases.
4. Analyzing instance and database health, configuration and performance.
The SQL Server Community offers many free tools and scripts for reviewing and analyzing SQL Server instances and databases. A few popular script resources are noted below.
Glen Berry’s SQL Server Diagnostic Queries are useful for assessing on-prem instances when planning for a migration, and analyzing configurations and performance once databases are running in GCP. For more information on how to use the SQL Server Diagnostic Queries, and for help interpreting the results, review Glen’s YouTube videos.
Brent Ozar’s SQL-Server-First-Responder-Kit is another popular community tool used to quickly assess and analyze SQL Server instances. Note that Cloud SQL for SQL Server does not support installing objects in the master database, and it is recommended that a separate database is created for the scripts. Many DBAs create a tools database (for example: dbtools), and install scripts and procedures in that database. Review the documentation and Brent’s how-to videos for tips on installing and using the kit.
5. Configuration and performance levers to reduce locking and blocking.
Performance problems related to locking and blocking may be reduced by scaling up the instance and optimizing database objects like tables, queries and stored procedures. While increasing instance performance may provide quick wins in the short-term, optimizing SQL and application code results in better stability and performance over the long term.
Instance Cores and Storage Capacity
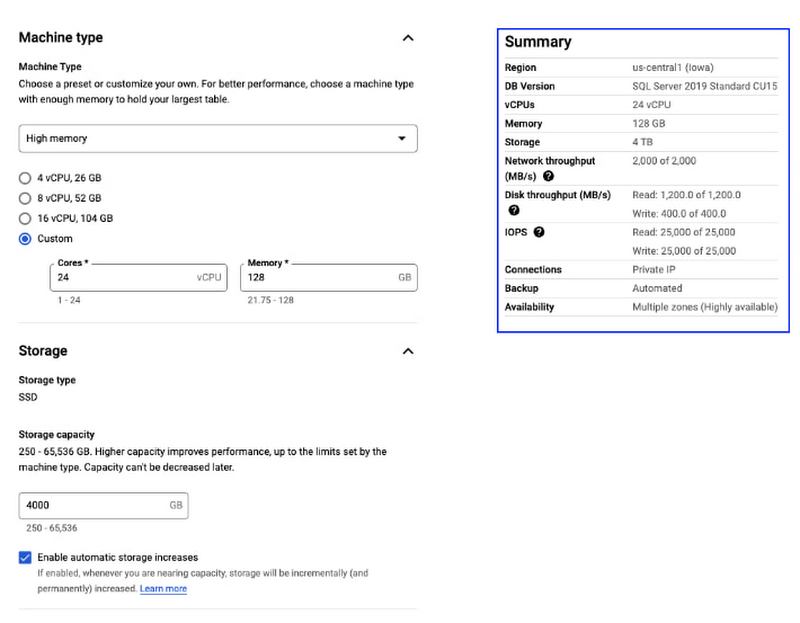
Increasing cores and storage capacity, also known as scaling up, has an immediate effect on IO throughput and performance, and many workload performance issues may be mitigated by increasing CPU and Storage configuration settings. Disk performance is based on the disk size and the number of vCPUs. Add more storage space and vCPUs to increase IOPS and throughput.

Read Committed Snapshot Isolation (RCSI)
If you find yourself adding NO LOCK to your queries in an attempt to reduce contention and speed things up, it’s probably a good idea to take a look at Read Committed Snapshot Isolation. When READ_COMMITTED_SNAPSHOT is turned on, SQL Server Engine uses row versioning instead of locking. For more information, see Kendra Little’s blog post on How to Choose Between RCSI and Snapshot Isolation Levels to determine if RCSI is right for your database workloads.
Forced Parameterization
If you run across an application that generates a lot of dynamic SQL or executes SQL without parameters, you may see a lot of CPU time wasted on creating new plans for SQL queries. In some cases, Forced Parameterization can help your database performance when you are not able to change or influence application coding standards. For more on forced parameterization and how it can be applied, review the following link: SQL Server Database Parameterization option and its Query Performance effects
6. Managing Indexes and Statistics: SQL Server maintenance
Ola Hallengren’s SQL Server Maintenance Solution is a SQL Server Community standard database maintenance solution. In an on-premises or GCE environment, a DBA may choose to install the entire maintenance solution, including backup scripts. Since backups are handled internally by Cloud SQL, a DBA may choose to install only the Statistics and Indexing procedures and supporting objects. Visit https://ola.hallengren.com/ to learn more about the solution, and take time to review the associated scripts, instructions, documentation and examples of how to install and use the SQL Server Maintenance Solution.
Conclusion
Proactively managing and tuning your Cloud SQL SQL Server databases enables DBAs to spend less time on production support calls and increases the performance, efficiency and scalability of databases. Many of the tools and recommendations noted in this blog are also applicable to SQL Server databases running on GCE. Once you become familiar with the tools and processes featured in this blog, consider integrating them into your database workflows and management plans.
