A definitive guide to the Database Observability with Cloud SQL: Part 1
Deepak Mahto
Data Migration Consultant, Google Cloud
Kiran Shenoy
Sr. Product Manager, Google Cloud
Introduction
Database performance is essential for any business because it affects the efficiency and effectiveness of day-to-day operations. A slow database can cause delays in processing transactions, which can have a negative impact on customer satisfaction and profitability.
Cloud SQL for PostgreSQL offers database observability through Cloud SQL Insights and SQLcommenter, which help customers diagnose, detect, and prevent database performance issues using a developer-first approach.
Cloud SQL for PostgreSQL supports additional database logs that can include metadata about database connections and disconnections, as well as query execution. All of these logs can be configured using database flags. Cloud SQL also supports widely used PostgreSQL Extensions, such as pg_stat_statements. By enabling both Cloud SQL Insights and native options, customers can get the best of both worlds.
This blog post explains how customers who have migrated to Cloud SQL for PostgreSQL can still use familiar PostgreSQL tools such as pgBadger and pg_stat_statements for database observability, in addition to Cloud SQL Insights. Unlike Cloud SQL Insights, generating reports using pgBadger requires additional steps to activate all necessary logging. If logging is not enabled, a partial report will be generated. Additionally, pgBadger requires additional operational steps to set up a server or GCE instance to download and create a report.
This article describes how to configure logging and generate HTML reports using pgBadger. It also emphasizes the value of using pg_stat_statement to capture nested calls within procedural calls.
Configuring database flags
Cloud SQL for PostgreSQL provides database flags that control the information captured in database logs. First, we will configure flags to enable logging of slow queries, every connection and disconnection. We will enable the following database flags with the values set as an example, not as the recommended values:
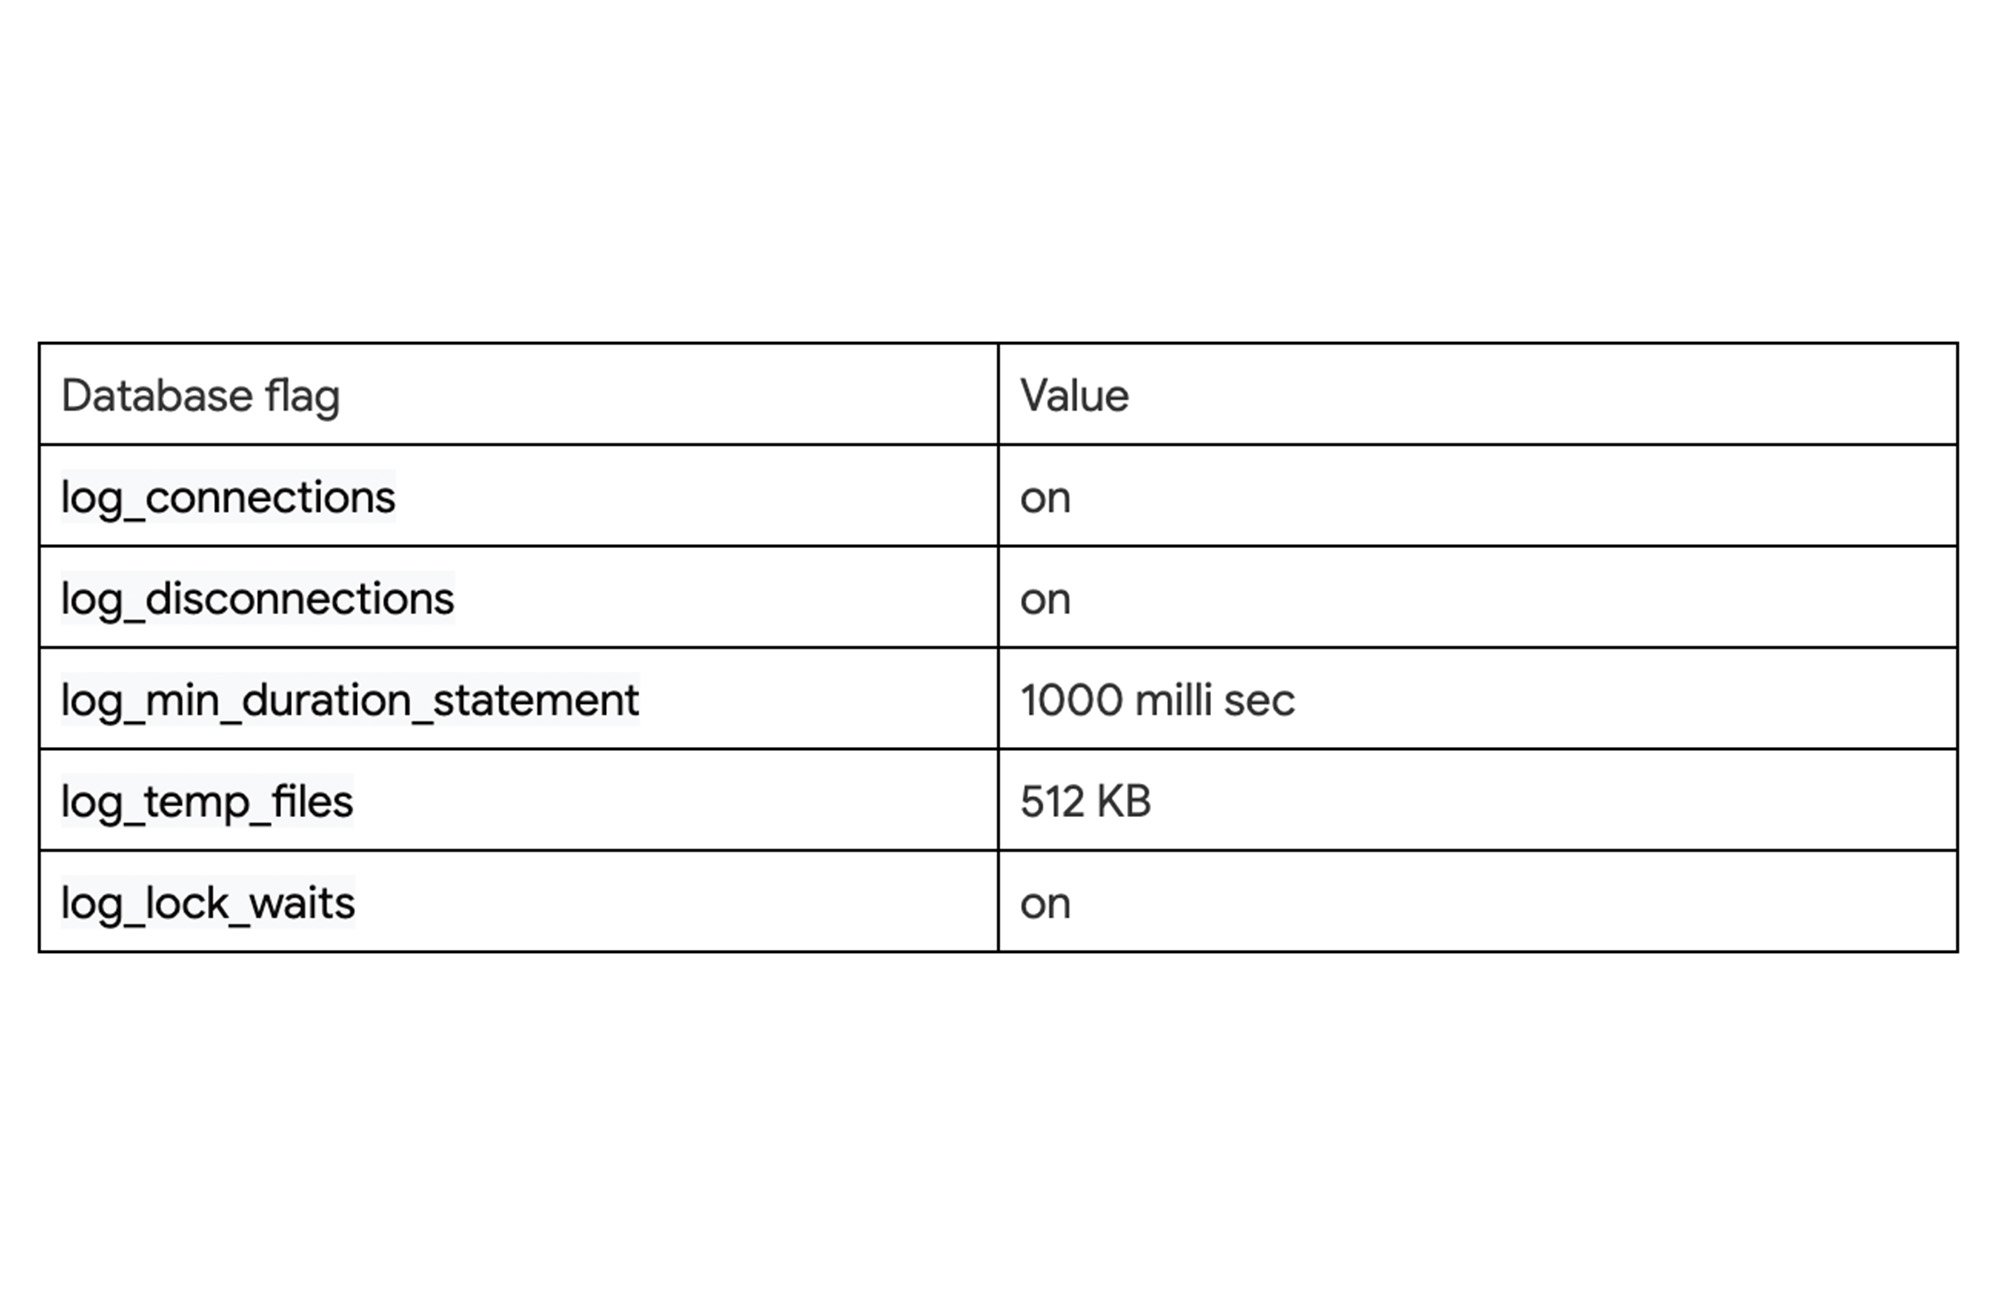
Activating the above-mentioned parameters or setting aggressive values for logging can put a strain on the database. We should assess the performance impact on the database before changing it in production. Here we can refer to the complete list of flags that are available for configuration on Cloud SQL for PostgreSQL.
Sample command line for updating database flags.
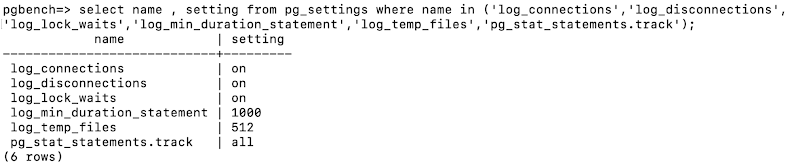
We are going to activate a new setting to record all nested calls as part of a top-level statement issued by clients. This will help us identify problematic nested calls, i.e. statements invoked within procedural code, in the pg_stat_statements view.
We can verify our set parameter from the database by querying the pg_settings view.
Setting up pgbench Database
We will use pgbench, a tool for benchmarking PostgreSQL databases, to simulate a performance baseline run on our Cloud SQL database. The loads generated during the mock benchmark run will be used to generate reports from database logs using pgBadger.
We will initialize the database using the pgbench command line available as part of PostgreSQL client libraries on a newly created database “pgbench”.
Generate pgBadger reports
pgBadger, a tool that processes database log files to generate HTML reports, includes information about connection, session, vacuum, temporary files, and top queries. We have already configured the relevant database flags to log information about each database connection and queries taking more than 300 milliseconds.
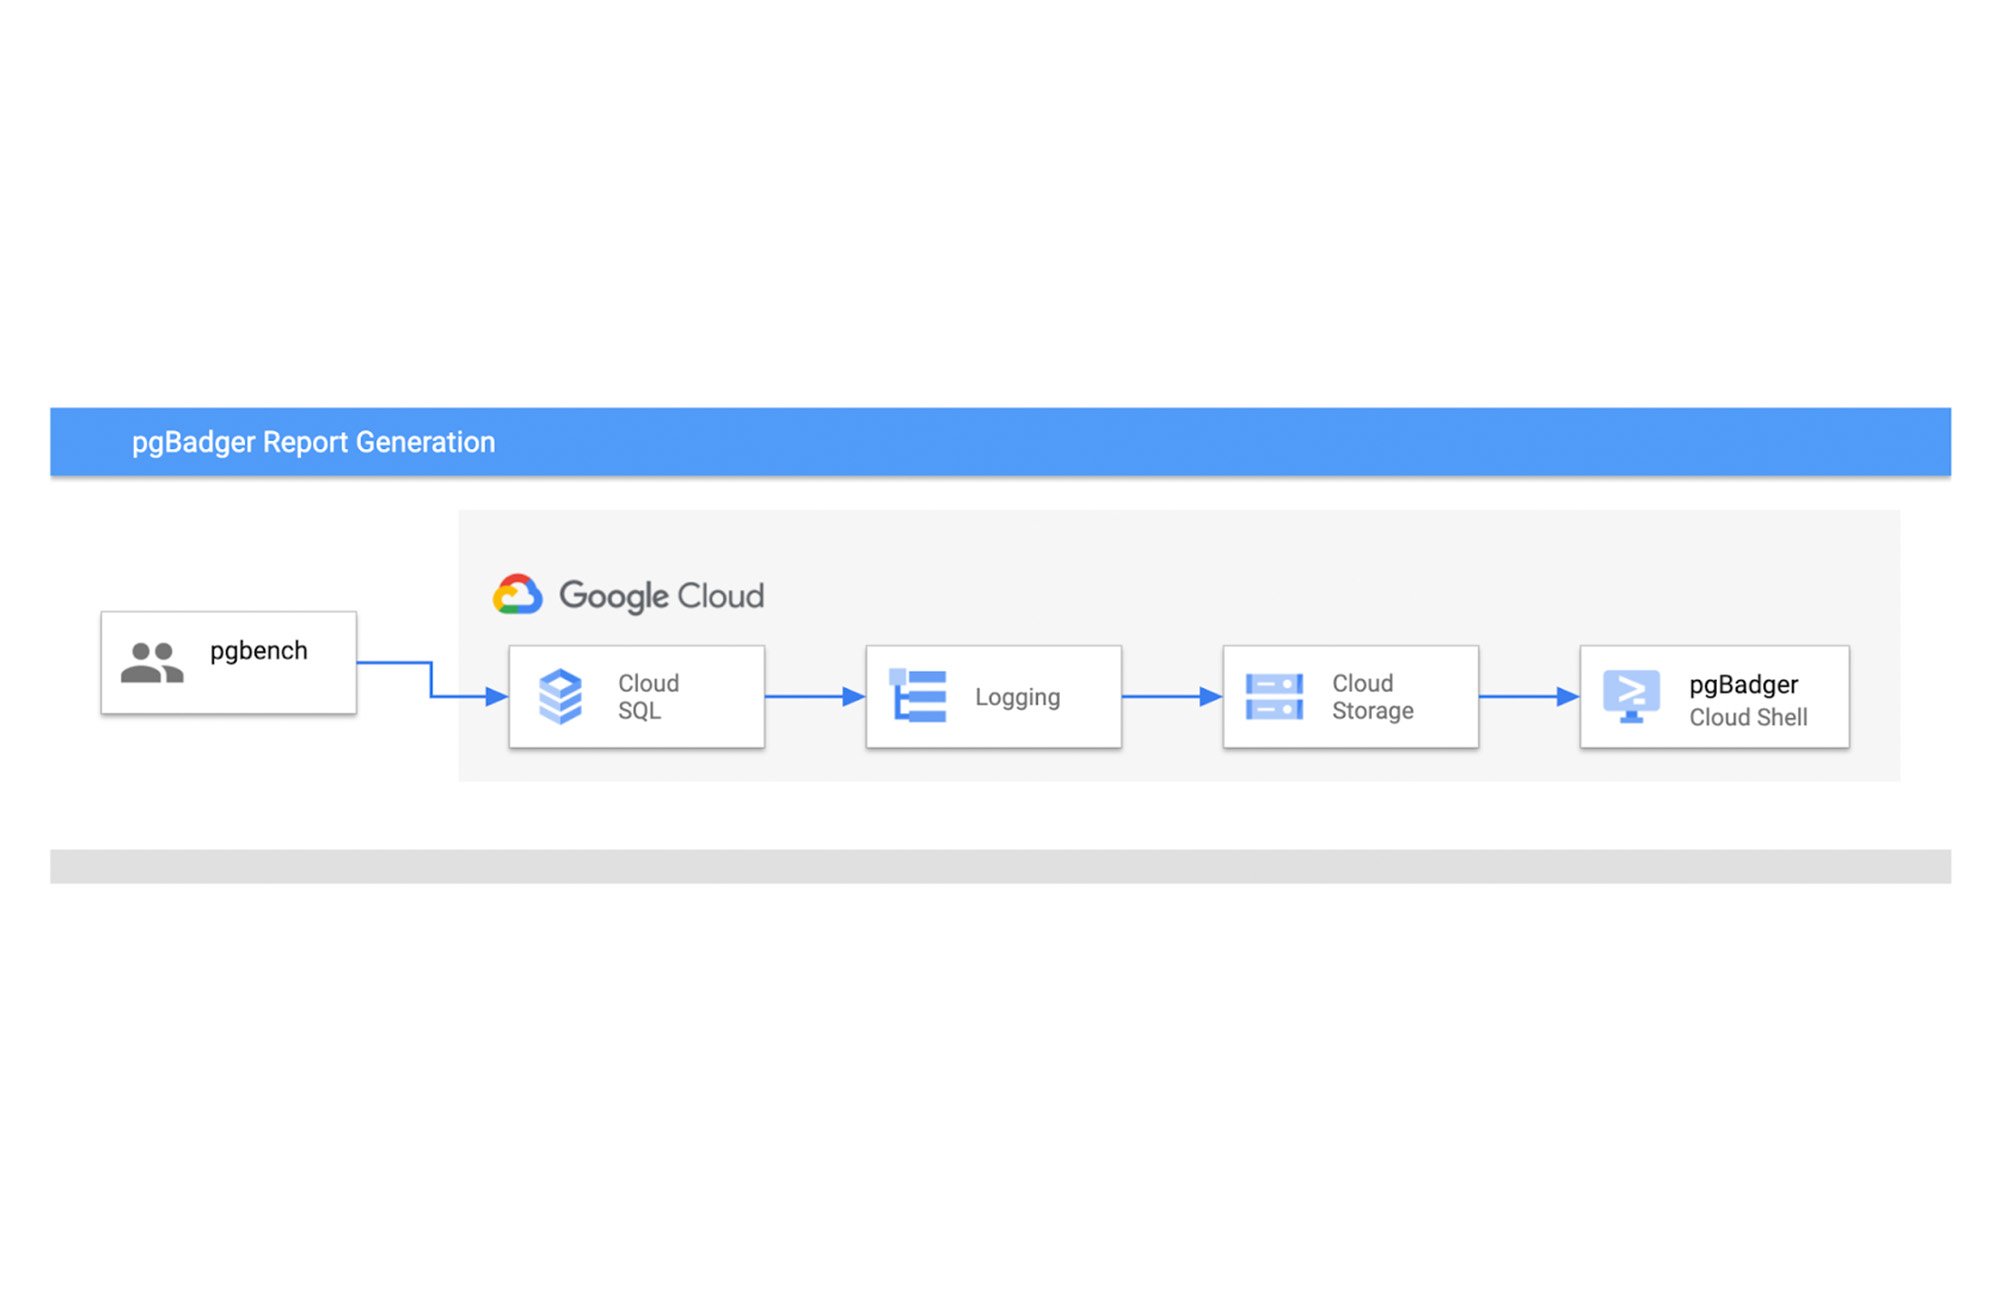
We will configure Cloud SQL for PostgreSQL logs to be stored in a Cloud Storage bucket, and then download them to Cloud Shell to process them using pgBadger to generate HTML reports.
As the first step we will install and set up pgBadger on a cloud shell.
Setting up pgBadger on a Cloud Shell or Compute Instance
Configure Cloud SQL logs routing sink to Cloud Storage
Cloud SQL uses Cloud logging to store all instance logs. Cloud logging can be used to view and query database instance logs. We will create log routing sinks to send all required Cloud SQL instance logs to a Google Cloud Storage (GCS) destination. The logs router is a part of Cloud logging. The sink destination is defined as a Google Cloud storage bucket.
We have set up the GCS bucket to be the destination for Cloud SQL logs, and we have filtered the logs to only include those from Cloud SQL databases with the specified ID label.
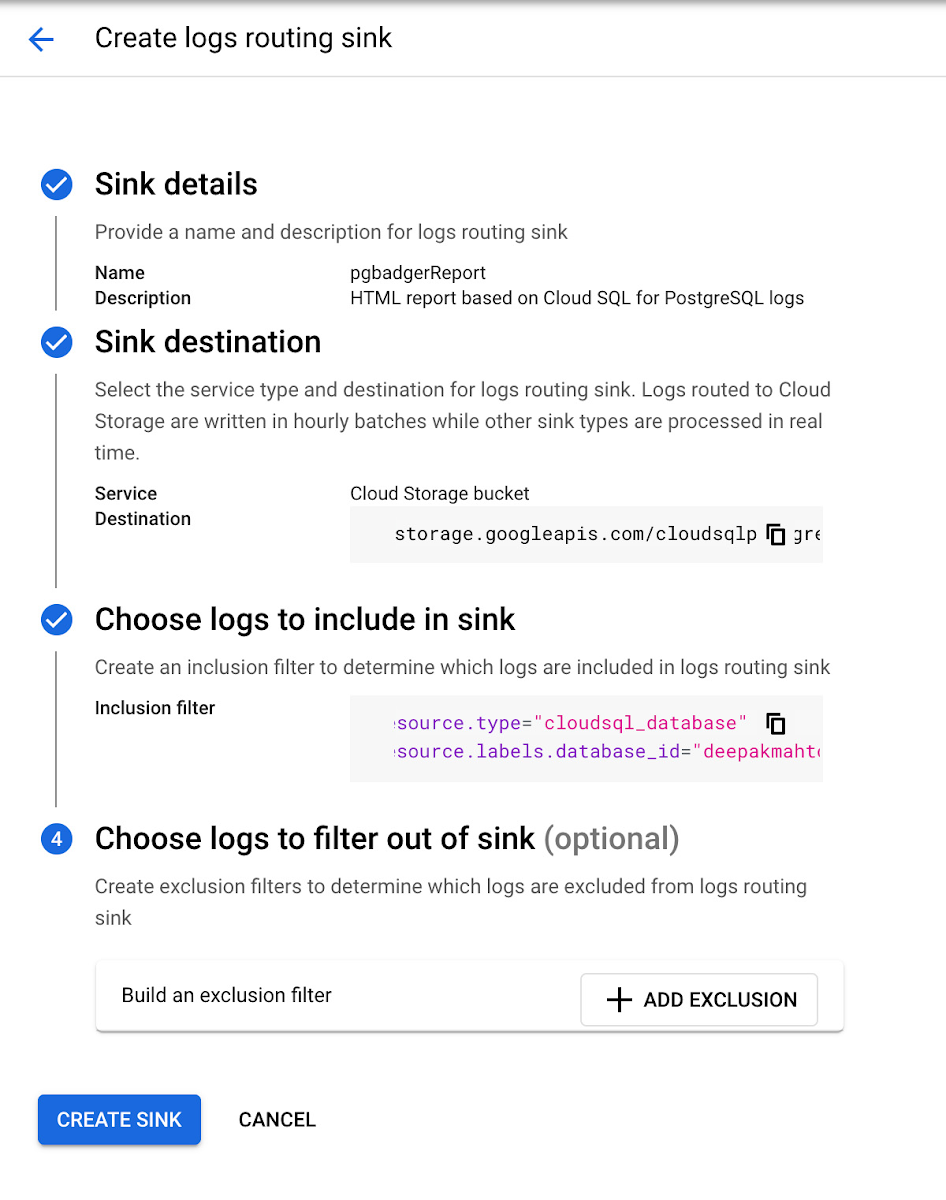
We have provided the required sink information and set up a new Cloud Storage bucket to route all logs to as an hourly batch process. We can also provide additional filters to include only specific Cloud SQL instances in the logs that are included in the sink.
Inclusion filter for our sample instance is:
Cloud SQL execution logs will be available in hourly batches for generating reports using pgBadger by analyzing logs. We can always use Cloud SQL insights for real time insight to understand load and SQL details.
Run mock benchmark test using pgbench
We have already initialized the pgbench sample database and will now simulate 50 client connections in 5 threads as a benchmark test to generate load on our Cloud SQL database.
Run pgBadger to generate html reports.
We will download Cloud SQL for PostgreSQL logs from Cloud Storage to our cloud shell environment and run pgBadger to generate an HTML report for the mock benchmark run. We can also automate the process of downloading logs from Cloud Storage and executing pgBadger to generate reports on a variety of intervals, from hourly to weekly.
The Compute Engine service account must be granted the necessary roles in order to download logs from Cloud Storage.
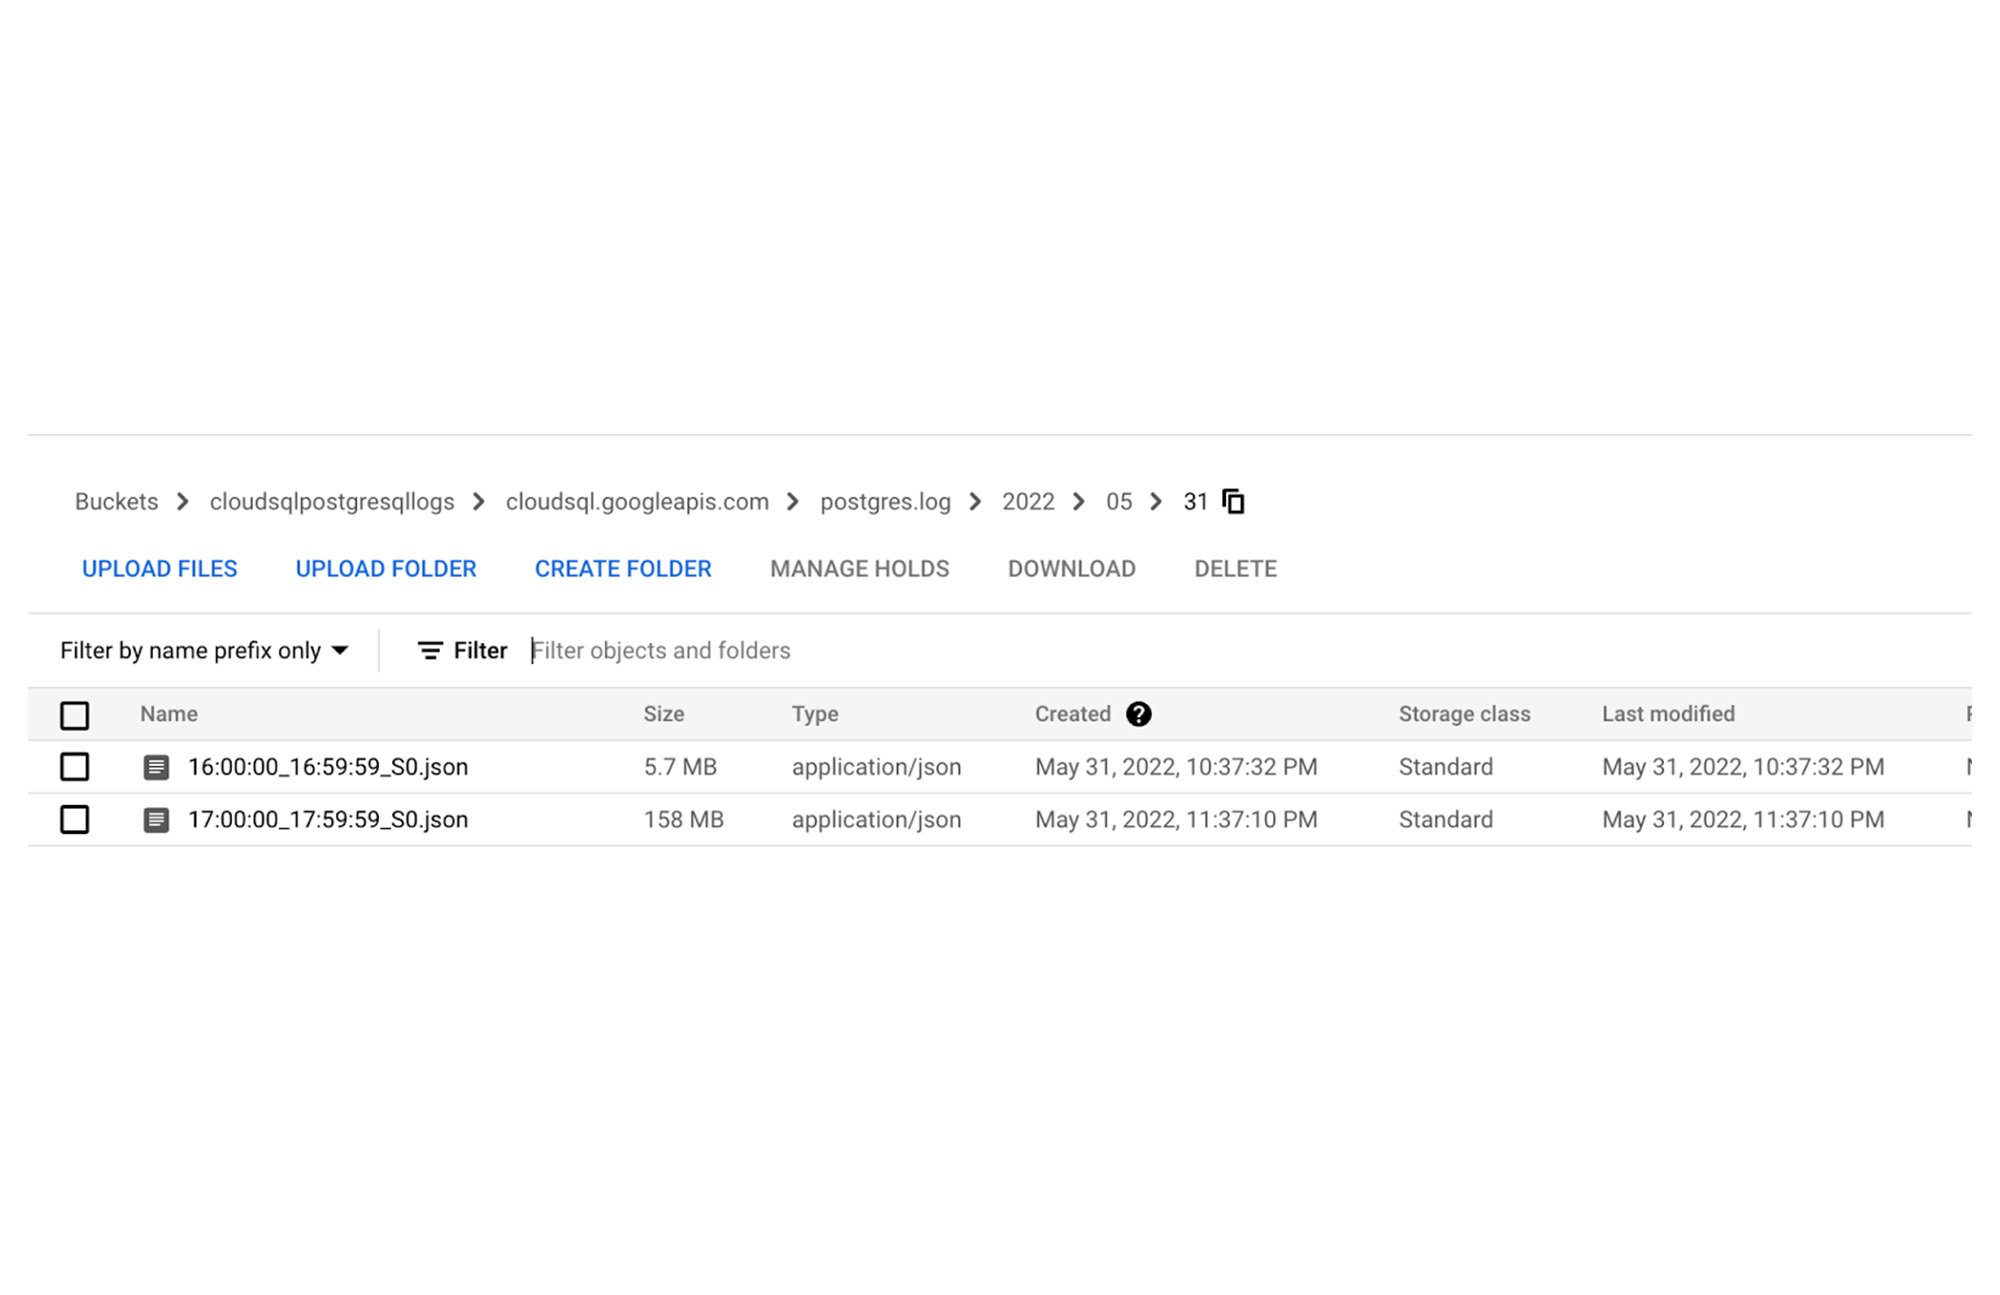
Once Cloud SQL logs are downloaded, you can use the pgBadger tool to generate HTML reports from the JSON-based logs.
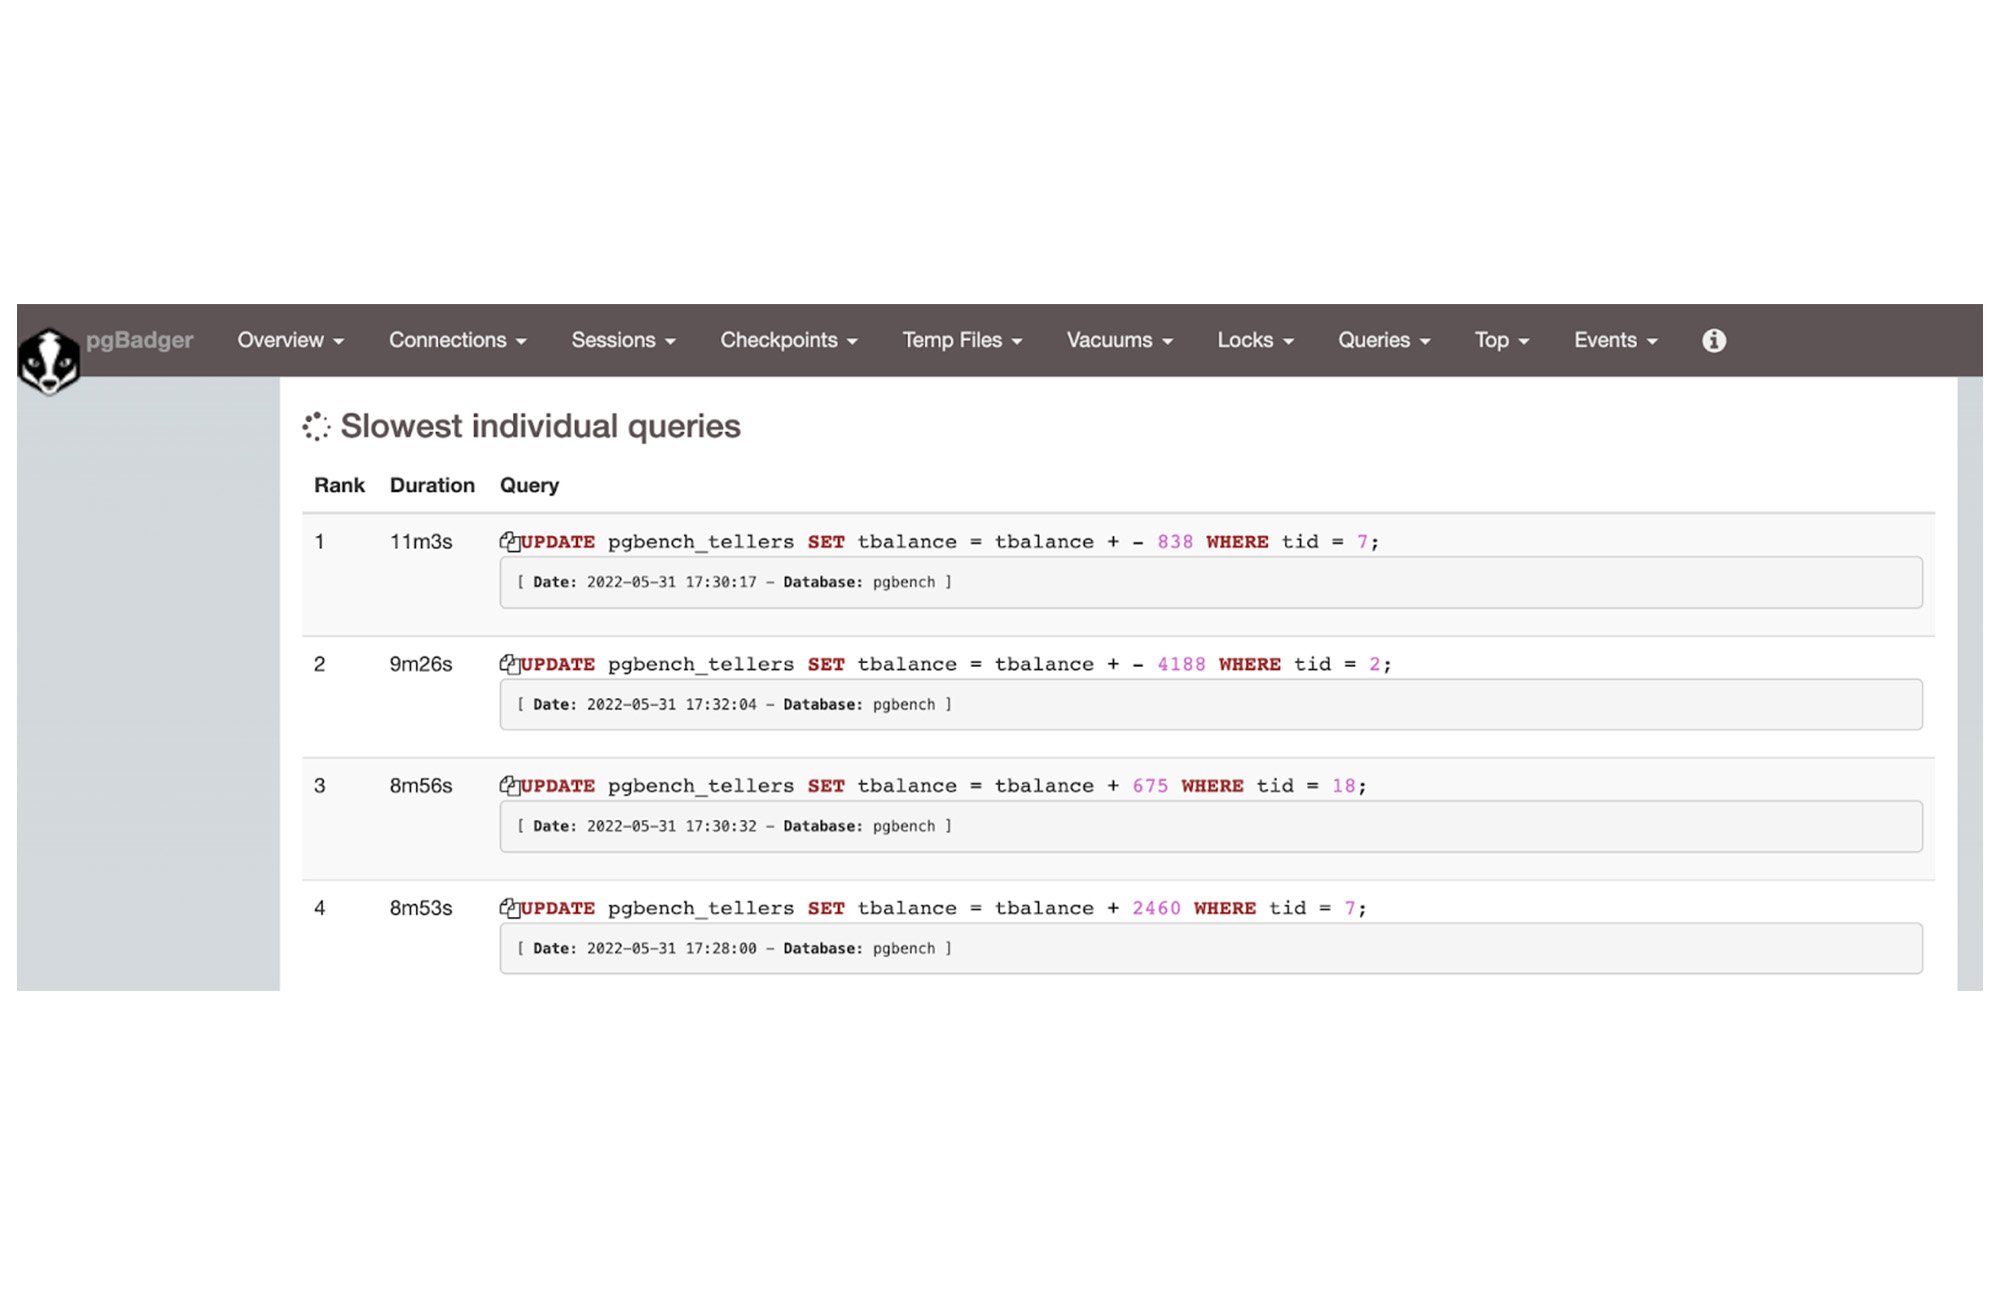
Initial look on the HTML report will look like the screenshot below.
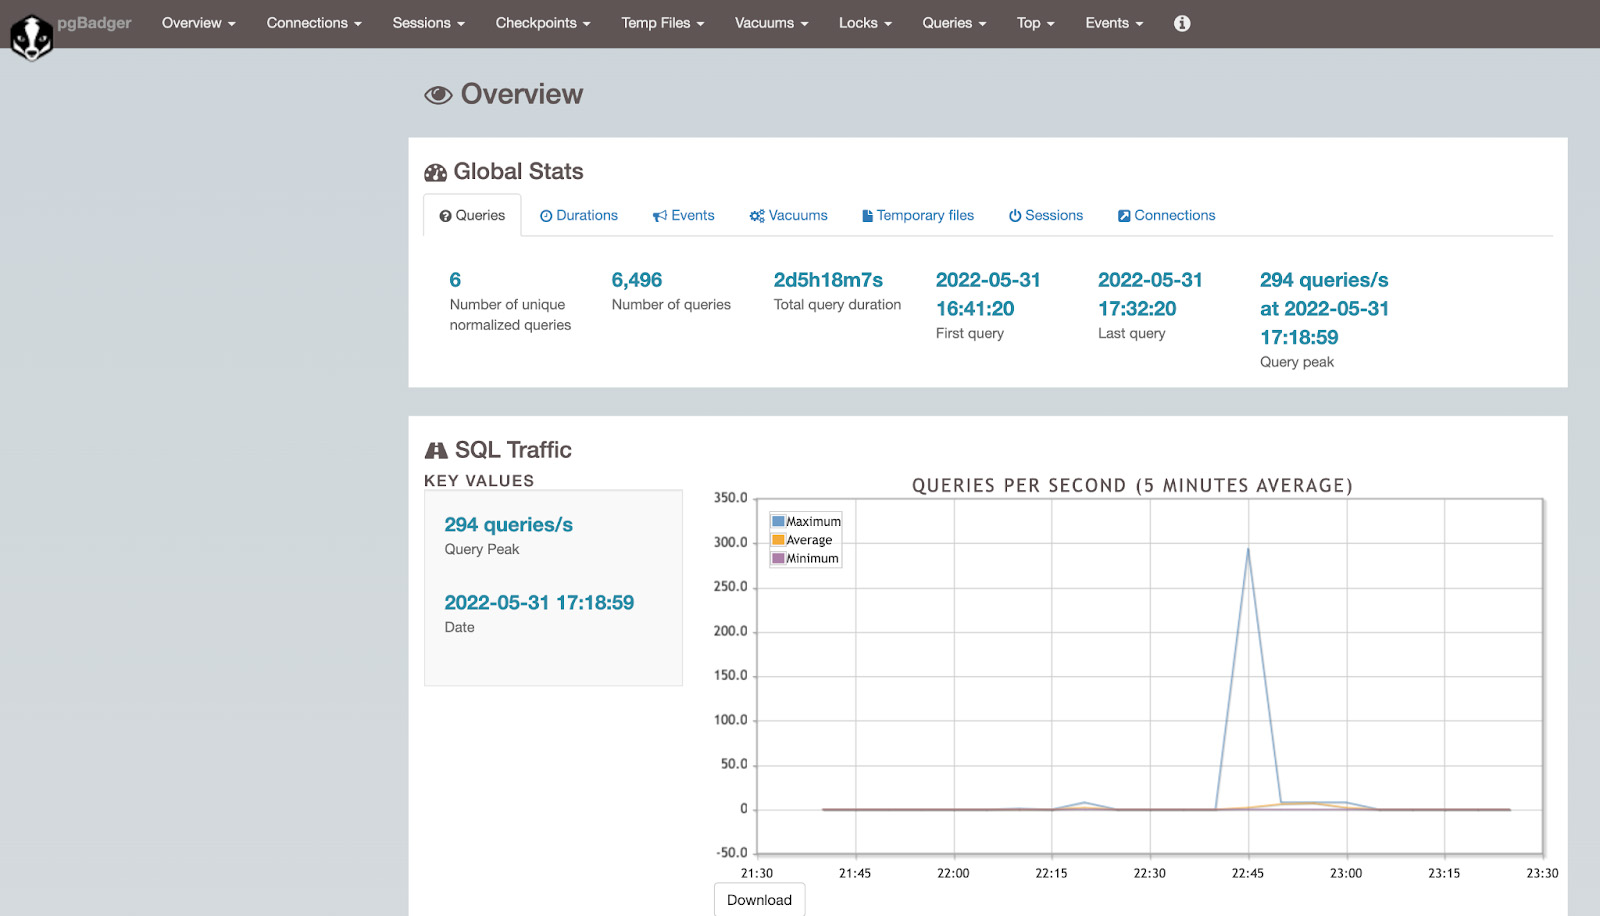
The HTML report includes information on connections, temp files usage, SQL execution statistics, and more.
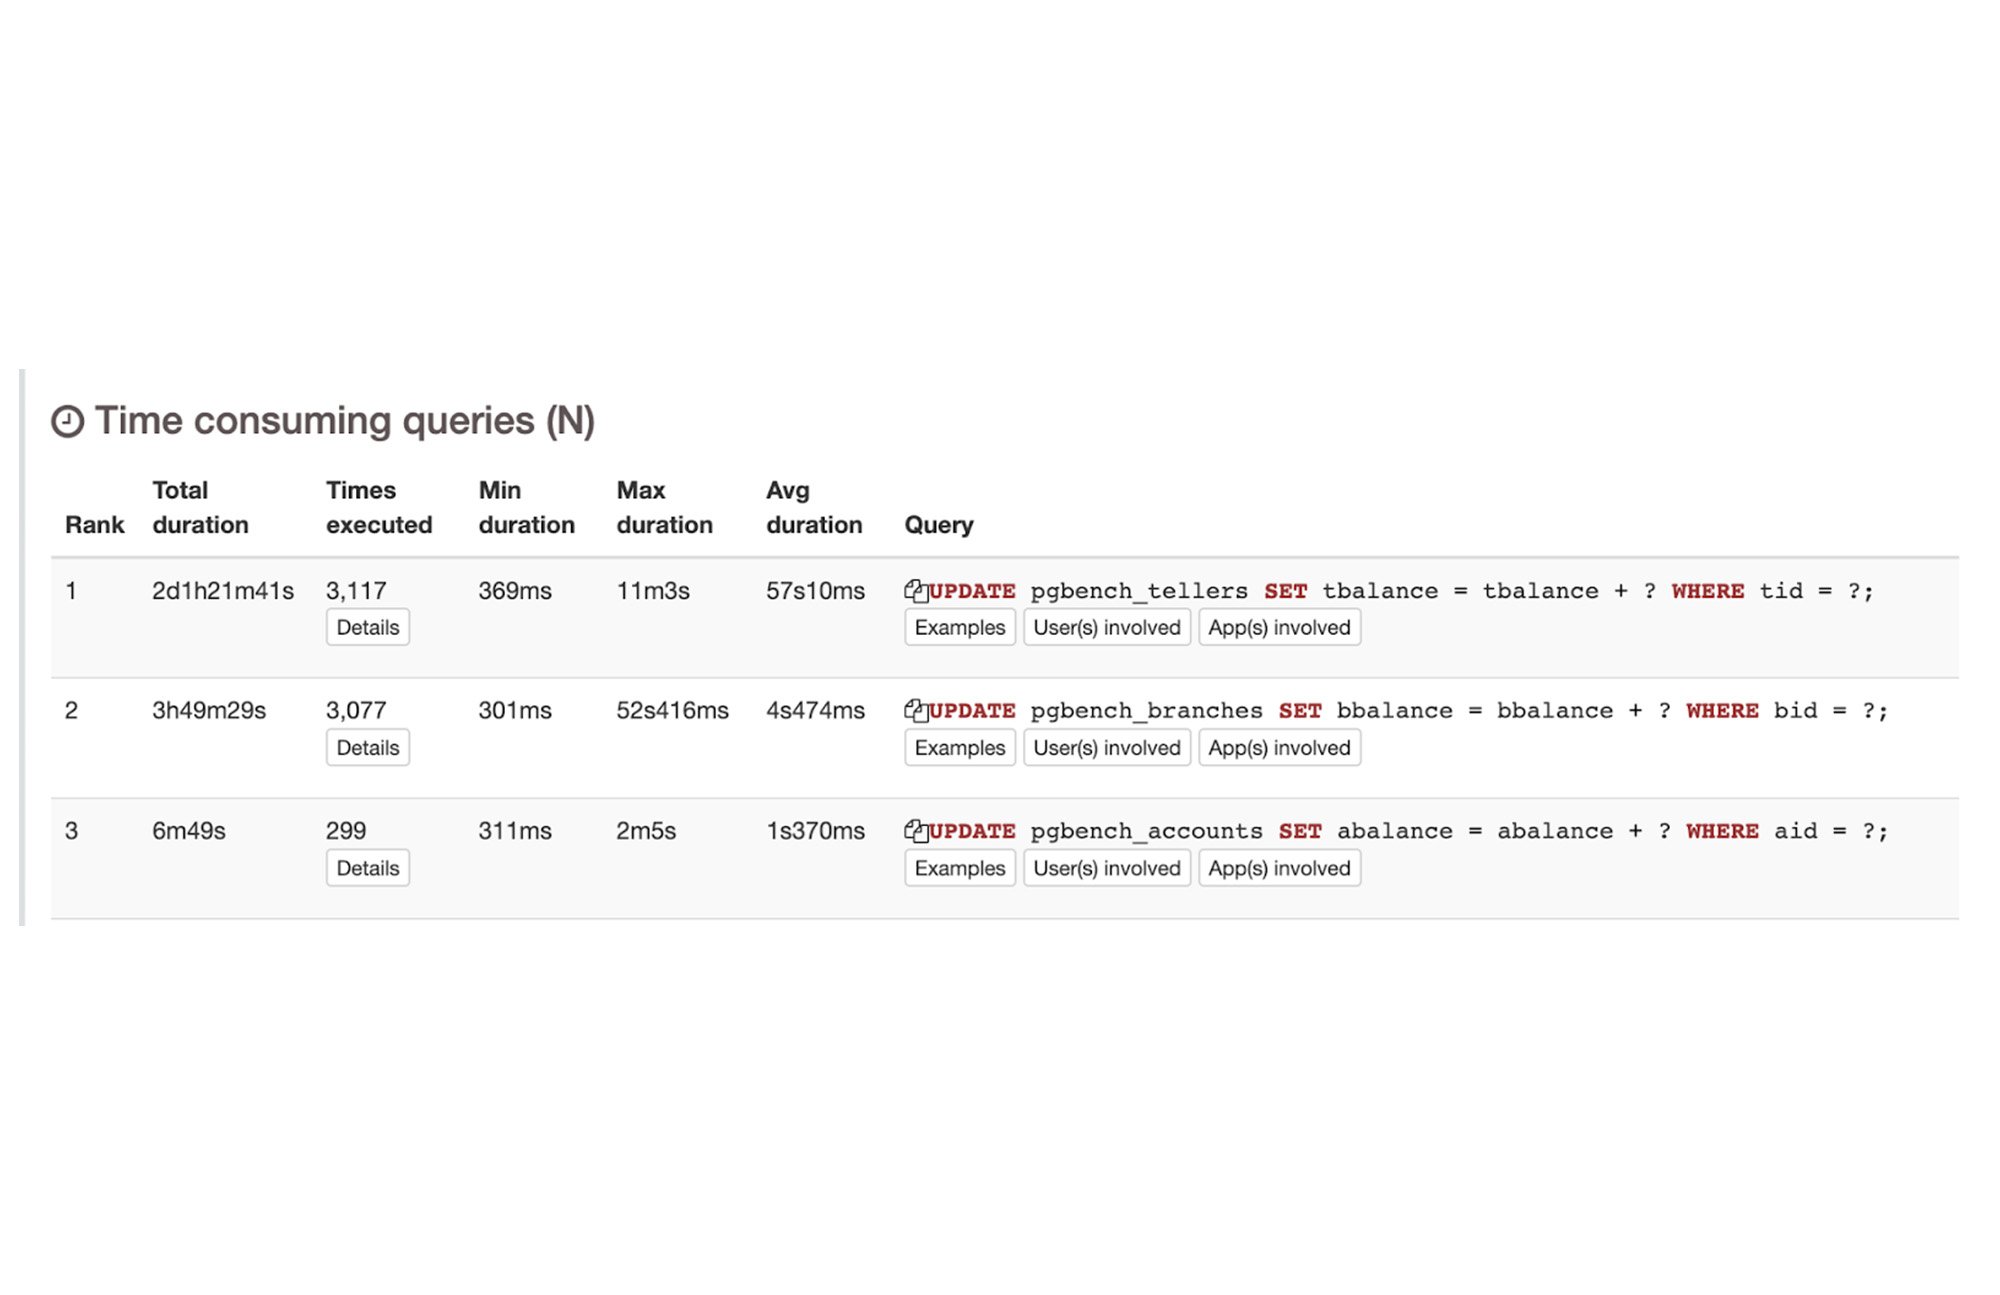
For example, we can check the slowest queries and the most resource-intensive queries under the TOP sections.
pg_stat_statements Extension
The pg_stat_statements extension provides a convenient way to view cumulative query execution statistics, which are displayed as a database view. It is preloaded in shared libraries and can be used in databases with the Create extension command.
The official documentation for PostgreSQL covers the pg_stat_statements extension in great detail. In this blog, we will discuss how to track nested calls as part of procedural calls using the flag pg_stat_statements.track.
During performance investigation, we might encounter a procedural call labelled as problematic or consuming considerable time in terms of execution.It becomes difficult to debug problematic statements or nested statements within procedural code causing or impacting overall performance.
When pg_stat_statements.track is set to all, nested queries executed within a procedural statement can be captured as part of the pg_stat_statements view itself.
Let’s create faulty procedural calls and run it as part of SQL in a loop.
The procedure for checking the existence of records uses count aggregation on an unindexed filter column, bid. If the procedure is called multiple times, it will add overhead to the overall performance of the procedure.
To get a clean result, we will reset pg_stat_statements to capture all SQL as fresh runs.
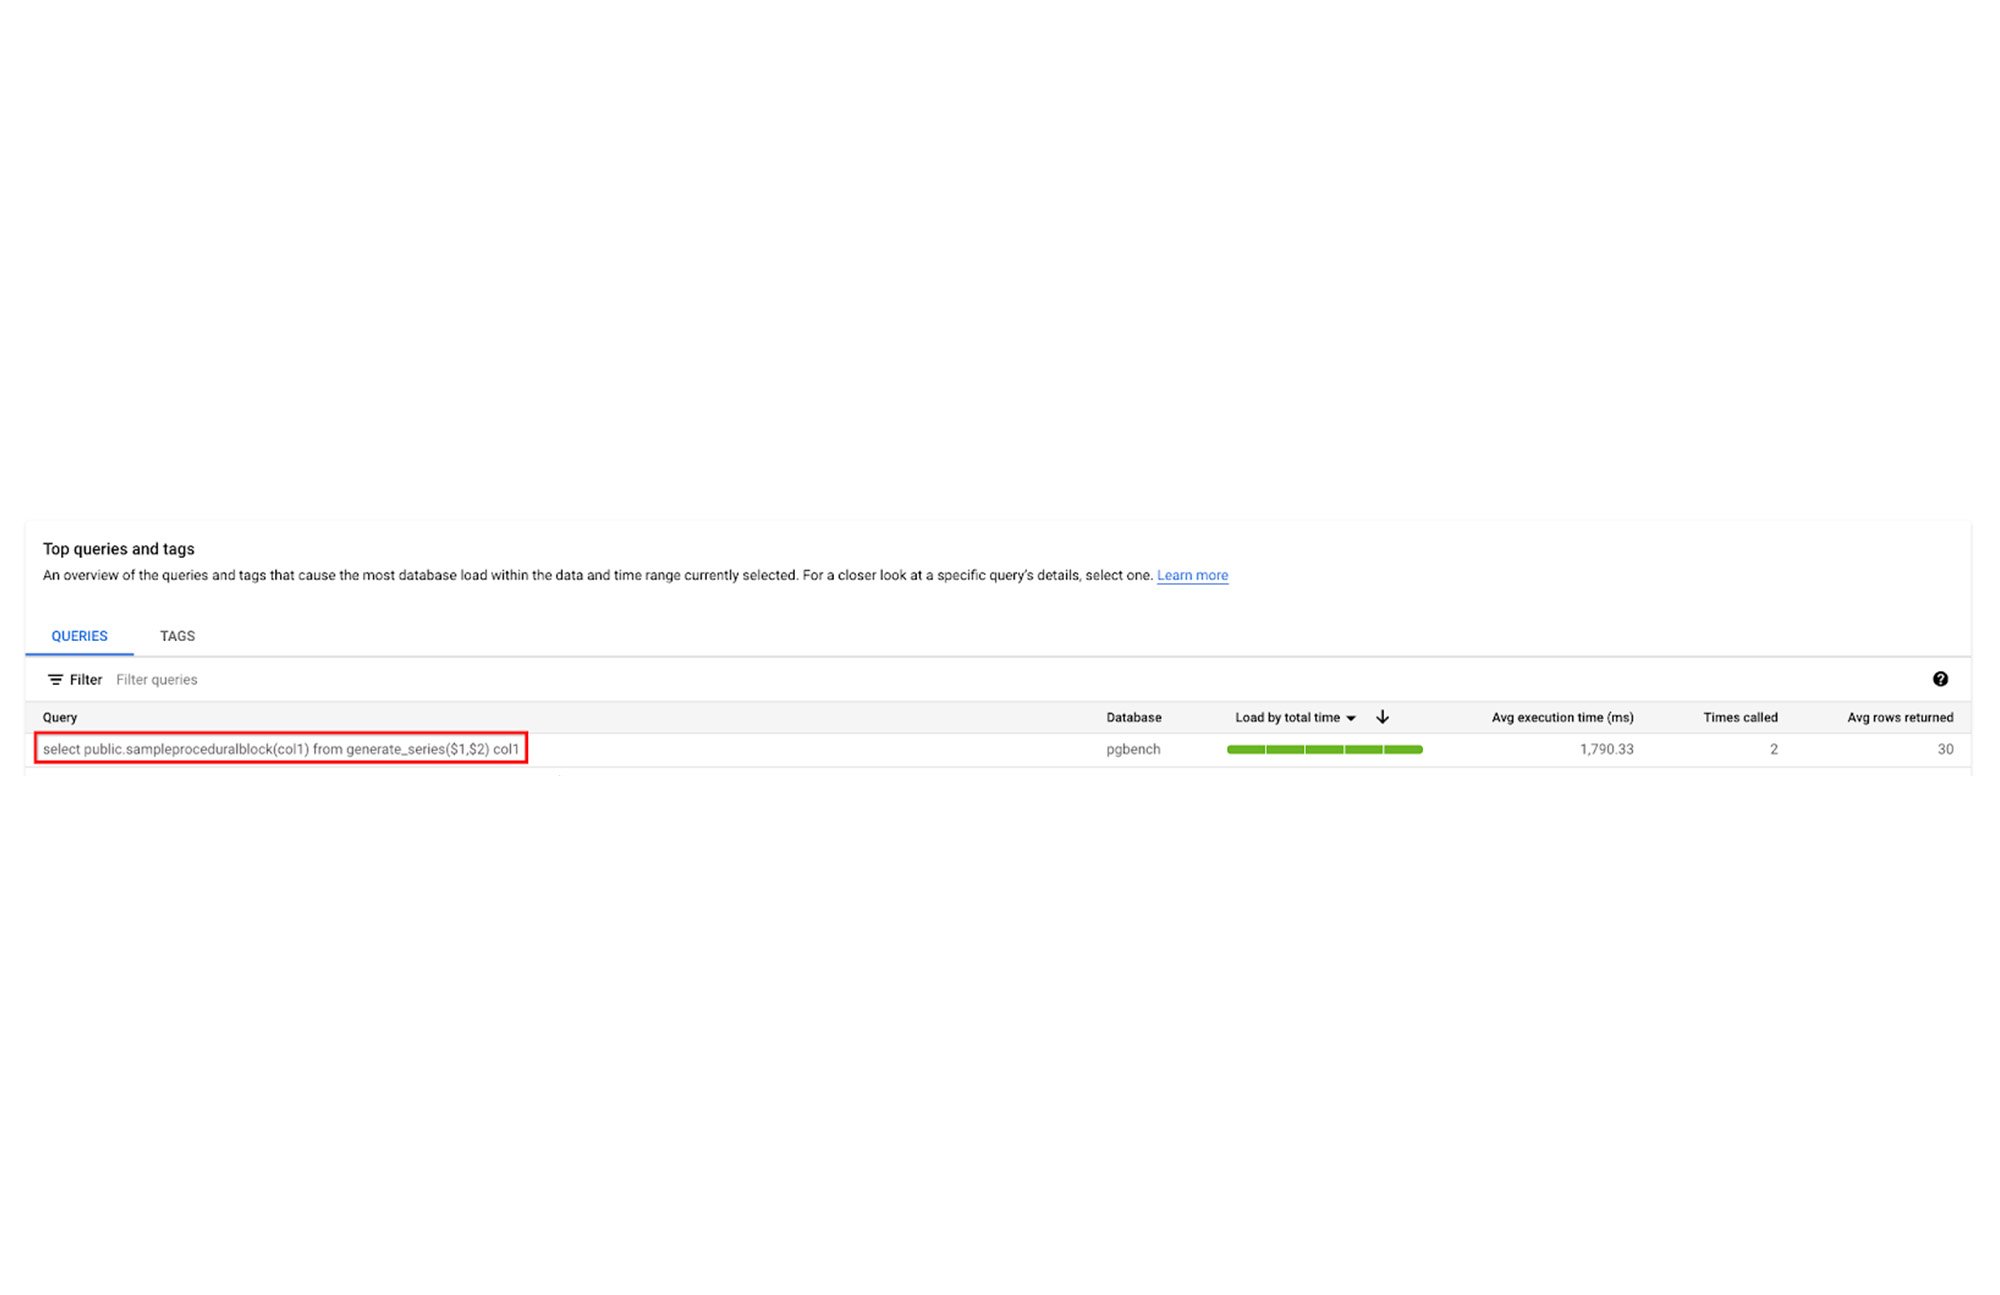
Let's execute the faulty procedural block repeatedly and query the pg_stat_statements extension to get the runtime execution time.
It highlights nested SQL calls within faulty procedural calls as a problematic statement. Now that we know which nested calls are problematic, we can provide recommendations and fix the overall procedural executions.
pg_stat_statements.track setting needs to change only for testing and finding problematic nested calls during the quality assurance phase; changing in a high workload environment may have additional overhead.
What's next?
PostgreSQL-native observability options, such as pgBadger and the pg_stat_statements extension, enable database developers and administrators to continue leveraging tools they are familiar with when using Cloud SQL for PostgreSQL.
Unlike Cloud SQL insights, pgBadger requires all necessary logging to be enabled in order to generate a complete report. A partial report will be generated if this is not done. Additionally, a server or GCE instance is required to download and generate a report with pgBadger.
Cloud SQL for PostgreSQL gives customers the best of both worlds: native PostgreSQL features and Cloud SQL insights. Cloud SQL insights provide intuitive monitoring and root-cause analysis for performance issues. We will cover Cloud Insights in the next part of this Database Observability series. In the meantime, you can learn more about this topic in our documentation.