Visualize 2030: meet the winners!
Elisse Roche
Data for Good
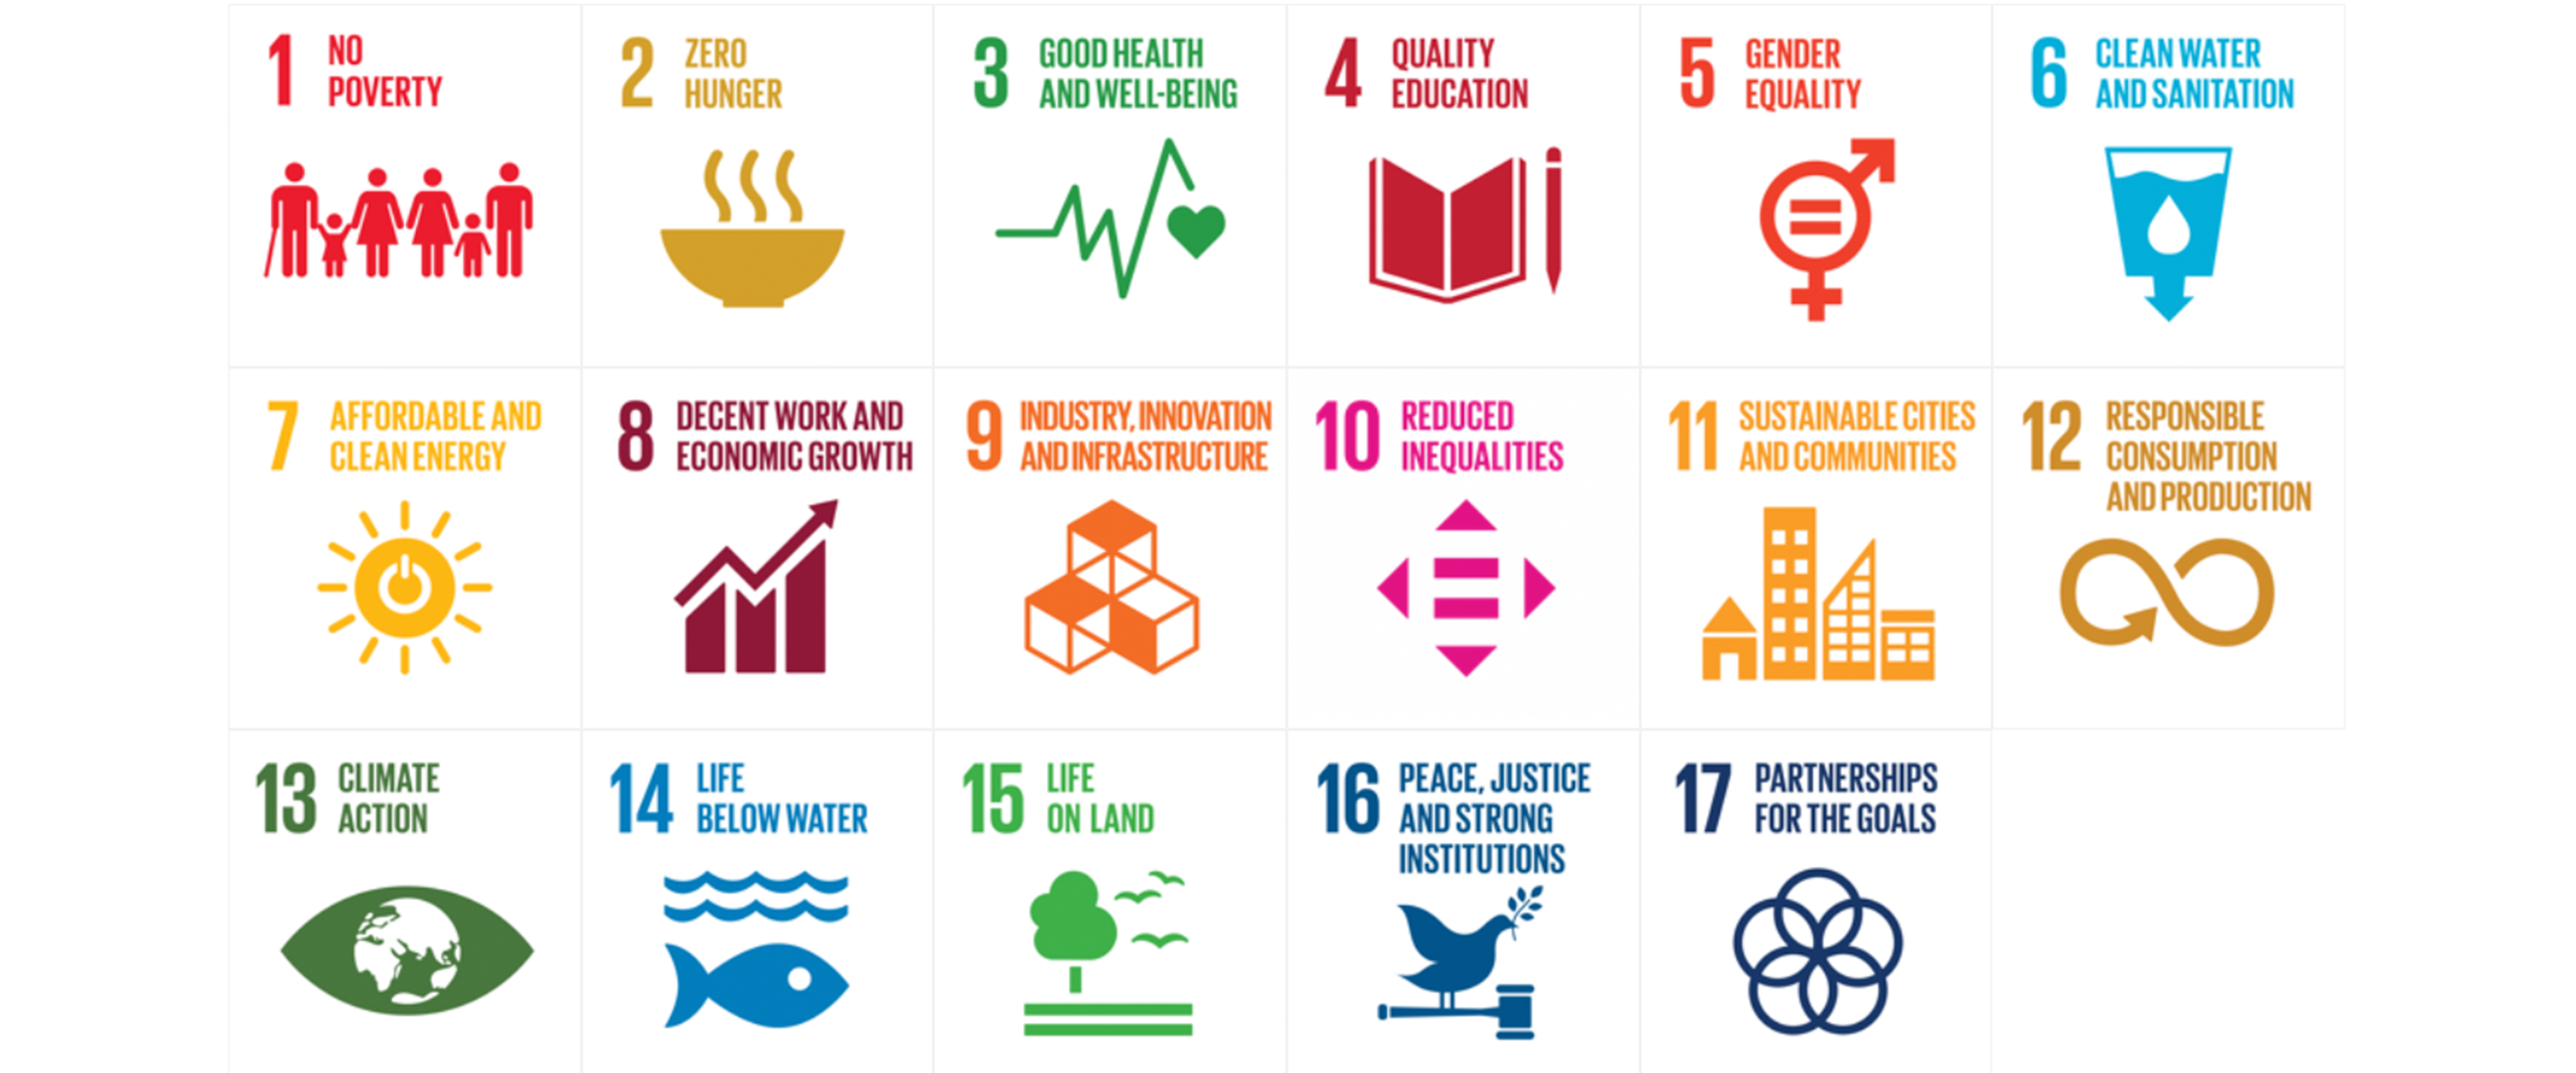
When the United Nations established the 17 Sustainable Development Goals (SDGs) in 2015, it challenged people to think creatively, broadly, and ambitiously about how to solve the world’s most pressing problems, from preserving biodiversity to ending poverty. Last year, in partnership with the World Bank, the United Nations Foundation, and the Global Partnership for Sustainable Development Data, Google Cloud launched a data storytelling contest for university students called Visualize 2030 | Data Stories for the SDGs.
Visualize 2030 is a collective effort and a part of the burgeoning “data for good” movement, bringing the public and private sectors together to apply modern technology to the world’s greatest challenges. We asked students to analyze datasets from the World Bank and the United Nations Statistics Division, visualize that data using Google Data Studio, and ultimately tell a data story about how at least two of the 17 SDGs influence each other and how to achieve them by 2030.
By collaborating together, we hoped to inspire the next generation of data scientists to leverage data for social and environmental good, to advance a shared repository of knowledge for collaborative action. And we did. During the course of the contest—from July 26 through November 16—over 1000 students took part. Submissions ranged from analyzing the relationship between well-being and gender, to economic growth and education. To evaluate submissions, we welcomed thought leaders and innovators to our judging panel with expertise in multimedia storytelling, data analytics, sustainable development, and journalism. The judges include:
- Rajesh Mirchandani | Chief Communications Officer, United Nations Foundation
- Claire Melamed | Chief Executive Officer, Global Partnership for Sustainable Development Data
- Haishan Fu | Director, World Bank’s Development Data Group
- Richard Curtis | Writer, Director, Co-Founder of Red Nose Day and UN Sustainable Development Goals Advocate
- Cindi Howson | Research VP, Gartner
- Fausto Ibarra | Director of Product Management, Google Marketing Platform
- Simon Rogers | Data Editor, News Lab at Google
In addition to leveraging their expertise, the judges assessed the submissions based on key criteria that spanned a data-first approach, a developed narrative arc, an interactive experience, a unique look and feel, and accessible insights. Overall, they sought thoughtful data stories that juxtaposed two or more SDGs and explored how they influence each other based on the provided datasets. Successful applications provided a clear synthesis of the SDG datasets, along with actionable recommendations on how to achieve their SDGs of choice.
Today, we are excited to announce the winners of the Visualize 2030 contest and share their data stories. Meet the winners:
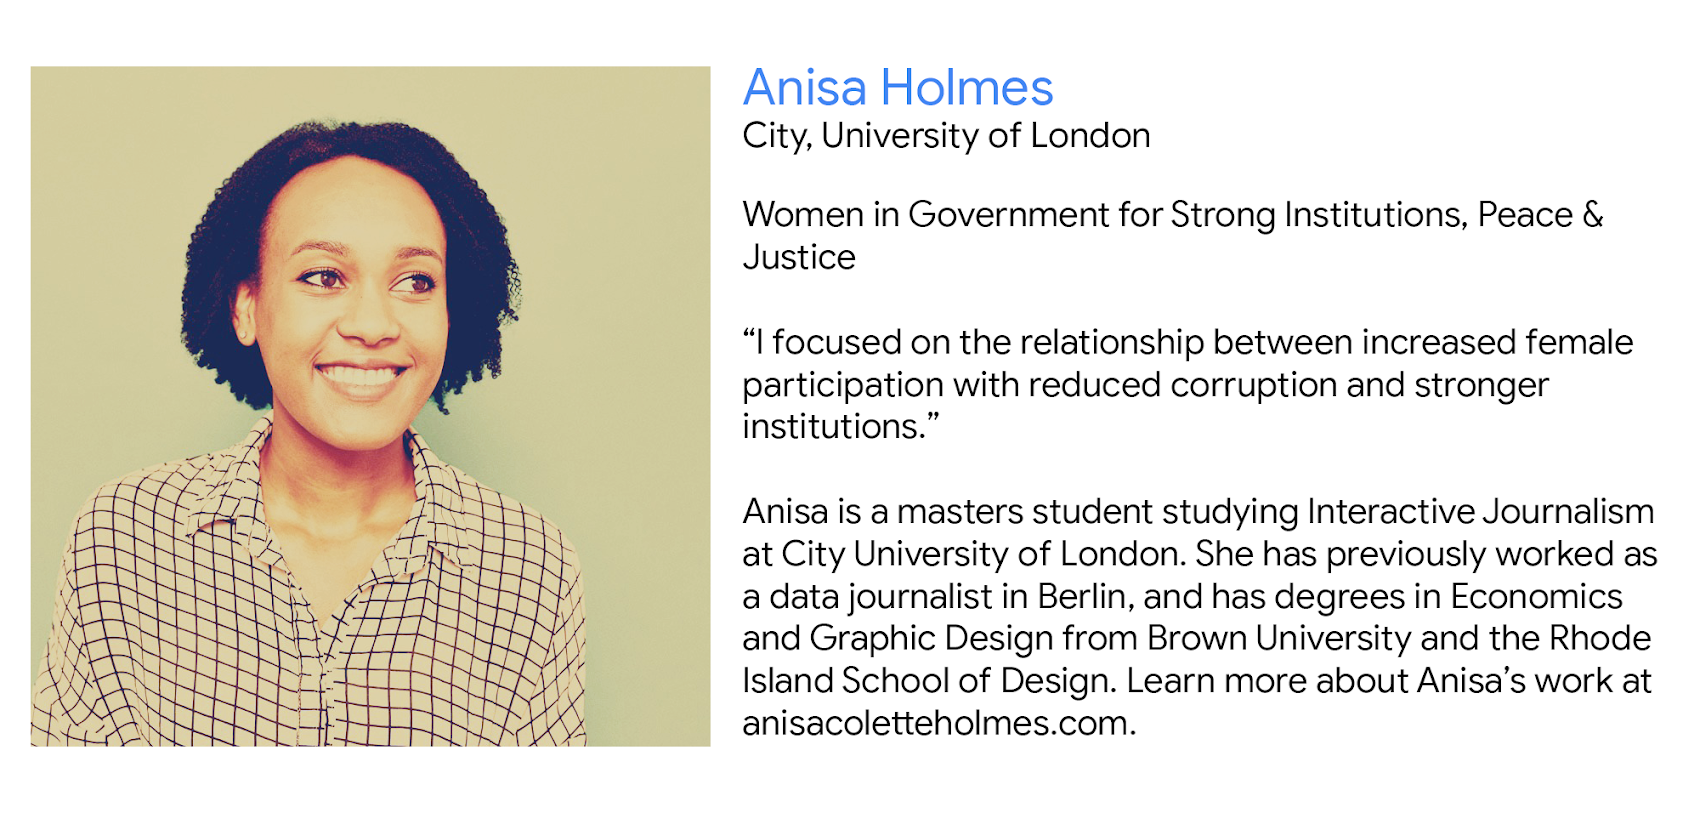
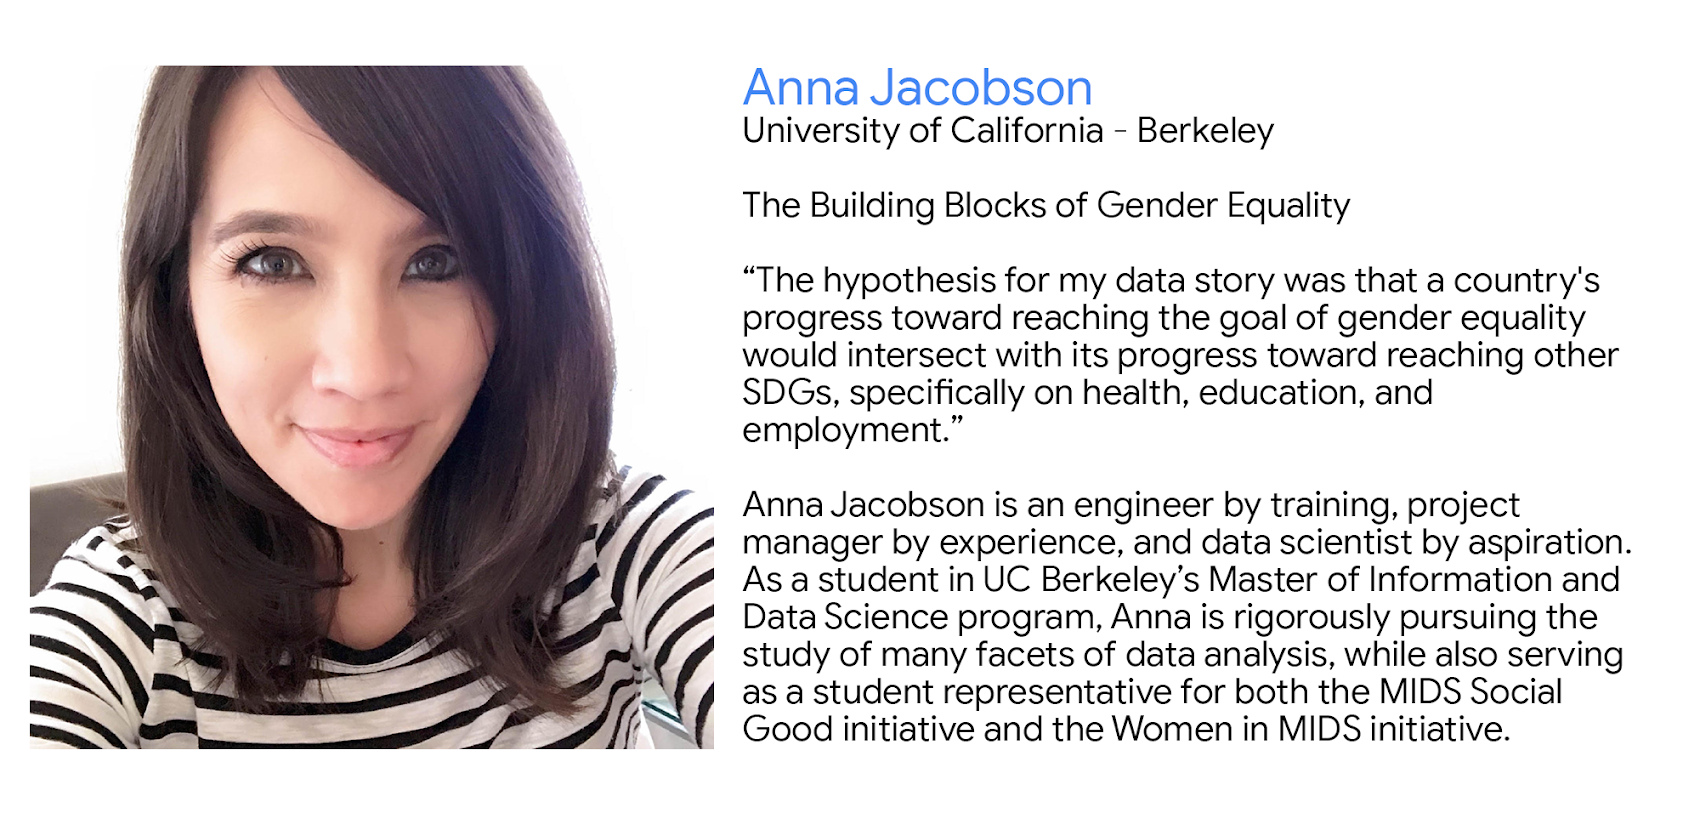
We congratulate the Visualize 2030 contest winners for not only their perceptive data analysis, but also for their passion for the Sustainable Development Goals and what they represent. Each of them will receive a $10,000 cash prize and publication and promotion by Google Cloud. Today and in the future, we look forward to continuing to celebrate their work as exemplary of what data analytics and data visualization can do to advance public knowledge and inspire action.
While Visualize 2030 is now closed, the adventure continues. We are thrilled to announce a new contest for the SDGs, hosted in partnership with SAP, called Circular Economy 2030. If you’re a social entrepreneur that believes in business as a catalyst for positive change, this is your opportunity to spark a sustainable revolution. Learn more and apply here.
And if you’re at the World Economic Forum at Davos, stop by the Google Cloud Lounge, which features demonstrations of these winning data stories.