Optimizing BigQuery + GCP with Looker Blocks from Datatonic
Andrew Powell
Data Science Consultant at Datatonic
Google BigQuery is an extremely powerful analytics data warehouse. It allows you to run terabyte-scale queries, getting results in seconds, and gives you the benefits of being a completely fully managed solution. BigQuery and other Google Cloud Platform (GCP) services offers “pay as you go” pricing. Whilst this leads to greater flexibility and can keep costs low relative to other providers, it also means keeping track of all of your costs across your business can get a bit tricky. To help simplify this, we’ve taken logs and billing data from GCP, and surfaced analysis through Looker to give everyone a detailed view of your usage and associated costs.
GCP and BigQuery monitoring
Stackdriver Logging offers a managed service to track cost and usage of BigQuery across your entire GCP environment. With Stackdriver Logging, you can export these logs to BigQuery for more detailed analysis and reporting. We've included set-up instructions for this at the bottom of this post.


While these logs tend to have a slightly complicated structure - utilising nested and repeated fields in order to fully utilise the power of BigQuery - with the right tools, we can use these logs to get detailed information about BigQuery usage and costs across your enterprise.
To make analysing BigQuery audit data easy, we’ve built a Looker Block to model the logs allowing you to analyse the logs in a simple way, whilst utilising the underlying power of Google BigQuery.
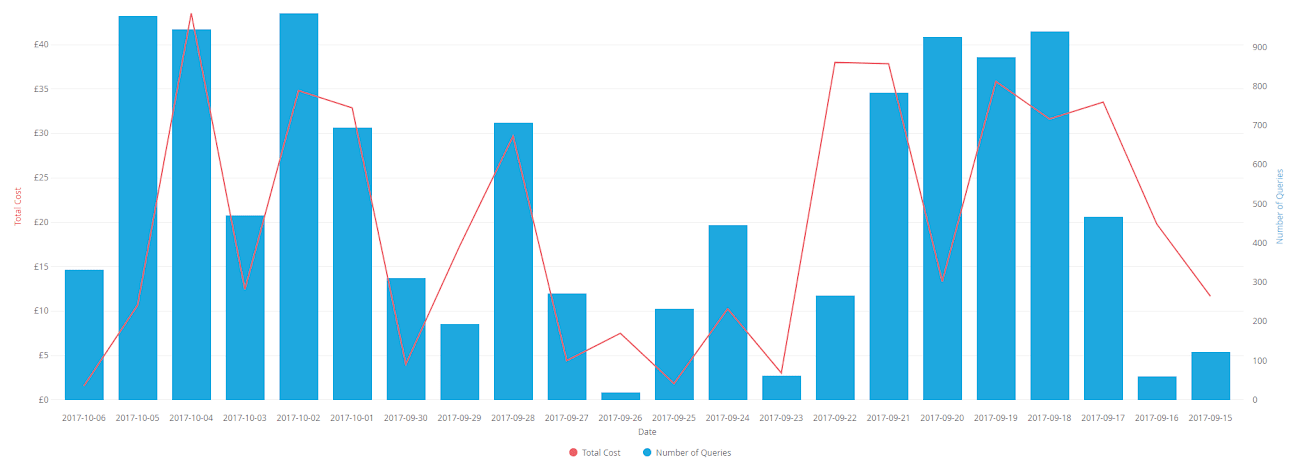

With the Looker Block, you can now easily track BigQuery billing and monitor performance. When combined with cross-project log exports, it becomes a powerful way to manage costs across your business.
The block allows you to:
- Analyse which queries are using the most resources or running the longest
- Monitor your active user base
- Track which users are running the most expensive queries
- Set up alerts when a user submits expensive queries, allowing you full flexibility to control costs


Using our easy-to-plug-in Looker Block, you can now go away and analyse your BigQuery logs, and export the data anywhere.
GCP Billing
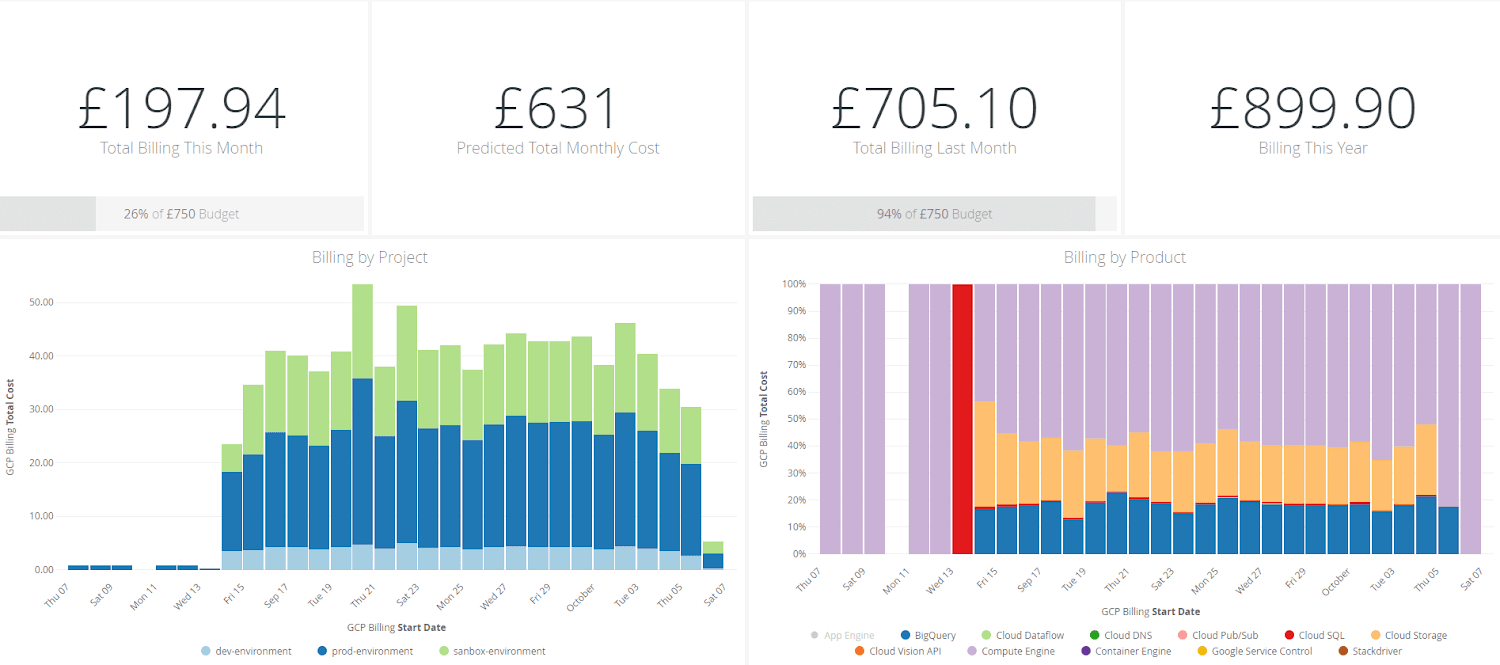
In addition to our BigQuery Monitoring Block, we’ve also just released a block for analysing GCP Billing exports. The Google Cloud console allows you to extract monthly reports on your billing account already, but using our Block gives you much more flexible analysis, more granularity, and the ability to combine this data with other sources.
You can use this Block to easily track GCP spend across your many projects, across services, and across labels applied to your GCP resources. As the majority of GCP products are pay as you go services, this provides a simple way to analyse spend, monitor resource usage, and even a projection of your total spend this month, based on current usage levels.

Try the Looker + GCP Blocks
Access the Datatonic Looker Blocks® by reaching out to your assigned Looker analyst, or request a Looker demo and trial.
This is just the starting point for analysing your entire GCP environment. Here at Datatonic, we’ve worked many companies to help them monitor and optimise their GCP environment. We have consultants who are experts across the GCP data stack, who can help employ best practices to enable you to save costs, and get the most out of the GCP services. Visit Datatonic to find out more about how we can optimise your analytics stack, or get you starter on GCP.
Setting up our Looker Block
Let's run through the steps in both the Google Cloud Platform, and in Looker, to setup the logging exports and the Looker block.
Google Cloud Platform setup
Create a BigQuery dataset for the billing and BigQuery audit logs. Go to the Google Cloud Platform console, and select BigQuery, or go to https://bigquery.cloud.google.com/. Click the drop down next to the project name and select Create New Dataset, set a location and click OK.
Optional: We recommend setting up a new GCP Project, purely for this purpose.
Setting up the billing export
To setup a billing export to BigQuery do the following:
- Go to the Google Cloud Platform console and select Billing
- Choose the appropriate billing account (if you have more than one) using Manage billing accounts
- Click Billing Export > BigQuery export
- Select the Project and Dataset you created earlier
- Click Enable BigQuery export
Billing data will now be exported to your dataset at regular intervals. The Billing export table is date partitioned, and will incur a small data storage charge.
Setting up BigQuery audit logs export
To set up the BigQuery log export do the following in a project that contains BigQuery:
- Go to the Google Cloud Platform console and select Stackdriver Logging
- Click Exports and then Create Export
- Add a Sink Name and select Custom Destination as the Sink Service. The Sink Destination should be set to
bigquery.googleapis.com/projects//datasets/, adding the project and dataset names you created earlier. - Click Create Sink
If you got a permission error then that is perfectly normal. It is because the project you have set up the export to is different to the project you have set up the logging export in. In this case the Service Account which writes the logs into the BigQuery dataset you have created will not have permission to do so. Follow the steps below to complete the setup:
- Go to BigQuery in the project the logs are exported to and click on the dropdown next to the dataset you have chosen. Click Share Dataset
- Get the name of the service account by going to Stackdriver Logging in the project where you set up the logging export, then Exports, and copy the Writer Identity
- Add this Writer Identity into the Share Dataset window in BigQuery from Step 1
- Give the account Can edit access, and click Add, and then Save Changes
The BigQuery audit log export should now be set up. The table will be updated throughout the day. The BigQuery audit log table is date sharded rather than date partitioned.
If you have more than one project using BigQuery, repeat the steps above. All logs from different projects will be added to the same table, allowing easy querying across projects.
Using the Google Cloud SDK
Alternatively, if you have the Google Cloud SDK installed, you can set up the BigQuery logging using the following command (make sure you in the project you want to set up the logging for by running gcloud config set project )
gcloud beta logging sinks create
bigquery.googleapis.com/projects//datasets/
--log-filter='resource.type="bigquery_resource"'
Looker configuration
This block requires almost no configuration once added to your Looker instance. We will only need to change the billing export table name:
- Go to BigQuery and copy the name of the billing export table, this will start gcp_billing_export_
- In Looker, go to the view file gcp_billing_export
- Replace the table name in the FROM statement of the derived table with your billing export table name
- Create a new Database Connection in Looker to connect to the BigQuery dataset: follow the steps here to create a service account in GCP and add a new connection to Looker, ensure you use BigQuery standard SQL
- Change the connection name in the Looker model files to the connection name you chose in Step 4
You should now be ready to start monitoring your BigQuery and GCP usage.
