Enriching Knowledge Graphs in Neo4j with Google Enterprise Knowledge Graph
Ben Lackey
Director, Global Cloud Channel Architecture at Neo4j
Lewis Liu
Group Product Manager, Google Cloud
Try Google Cloud
Start building on Google Cloud with $300 in free credits and 20+ always free products.
Free trialKnowledge graphs are inevitably built with incomplete information, complete knowledge being somewhat hard to come by. Knowledge graphs stored in Neo4j Graph Database can be enriched with data from Google Enterprise Knowledge Graph to provide more complete information.
Knowledge graphs enriched in this way contain more information, enabling the systems that use them to answer more questions. Those downstream systems can then make more accurate business decisions and provide better customer experiences.
In this blog post, we’ll demonstrate how to use Neo4j in conjunction with Google Enterprise Knowledge Graph to enrich a knowledge graph.
Neo4j
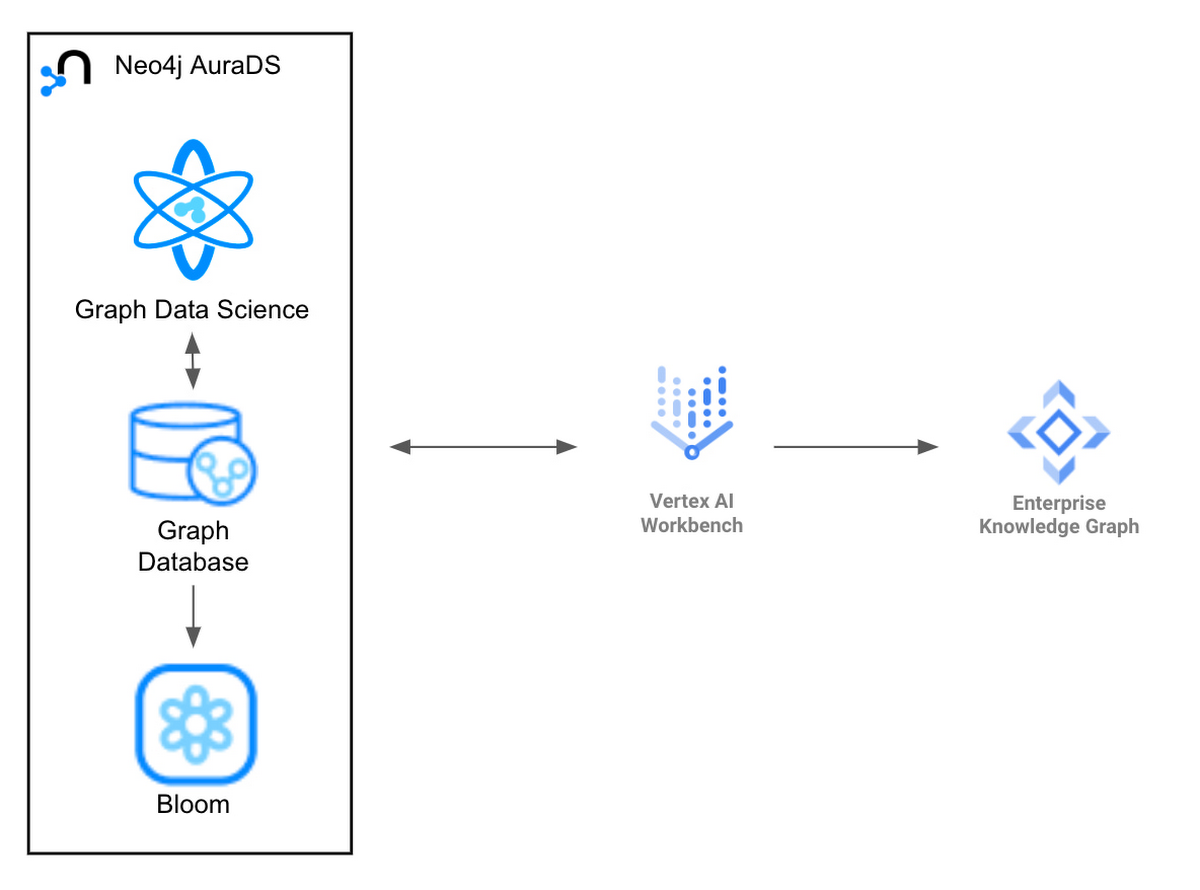
Neo4j Aura is the leading graph database. It is available on Google Cloud Marketplace. Neo4j Aura is the only graph database embedded in the Google Cloud Console. Neo4j AuraDS (Data Science) includes three components:
Neo4j Graph Database (GDB) - Graph database for storing, retrieving and managing data natively as graphs
Neo4j Graph Data Science (GDS) - A collection of 60+ graph algorithms for computing centrality, embeddings, etc
Neo4j Bloom - A graph specific business intelligence (BI) tool
Google Enterprise Knowledge Graph
Google Enterprise Knowledge Graph consists of two services:
The Entity Reconciliation API lets customers build their own private Knowledge Graph with data stored in BigQuery.
Google Knowledge Graph Search API lets customers search for more information about their entities, such as official name, types, description, etc.
Architecture
The easiest way to enrich a knowledge graph stored in Neo4j Aura with Google Enterprise Knowledge Graph is to access both tools via Python APIs from Vertex AI Workbench. The architecture for such a system is shown below
Example with Private Equity Data
To illustrate this architecture, we’re going to look at some data from ApeVue, a data provider for private equity markets information. ApeVue aggregates price data on pre-IPO companies from a variety of private equity brokers and distributes market consensus prices and index benchmarks based on that information.
For this example we’re going to construct a knowledge graph in Neo4j Aura from some CSV files provided by ApeVue. These files cover the ApeVue50 Benchmark Index and its constituent companies. An iPython notebook that runs the load is available here. You’re more than welcome to run it yourself!
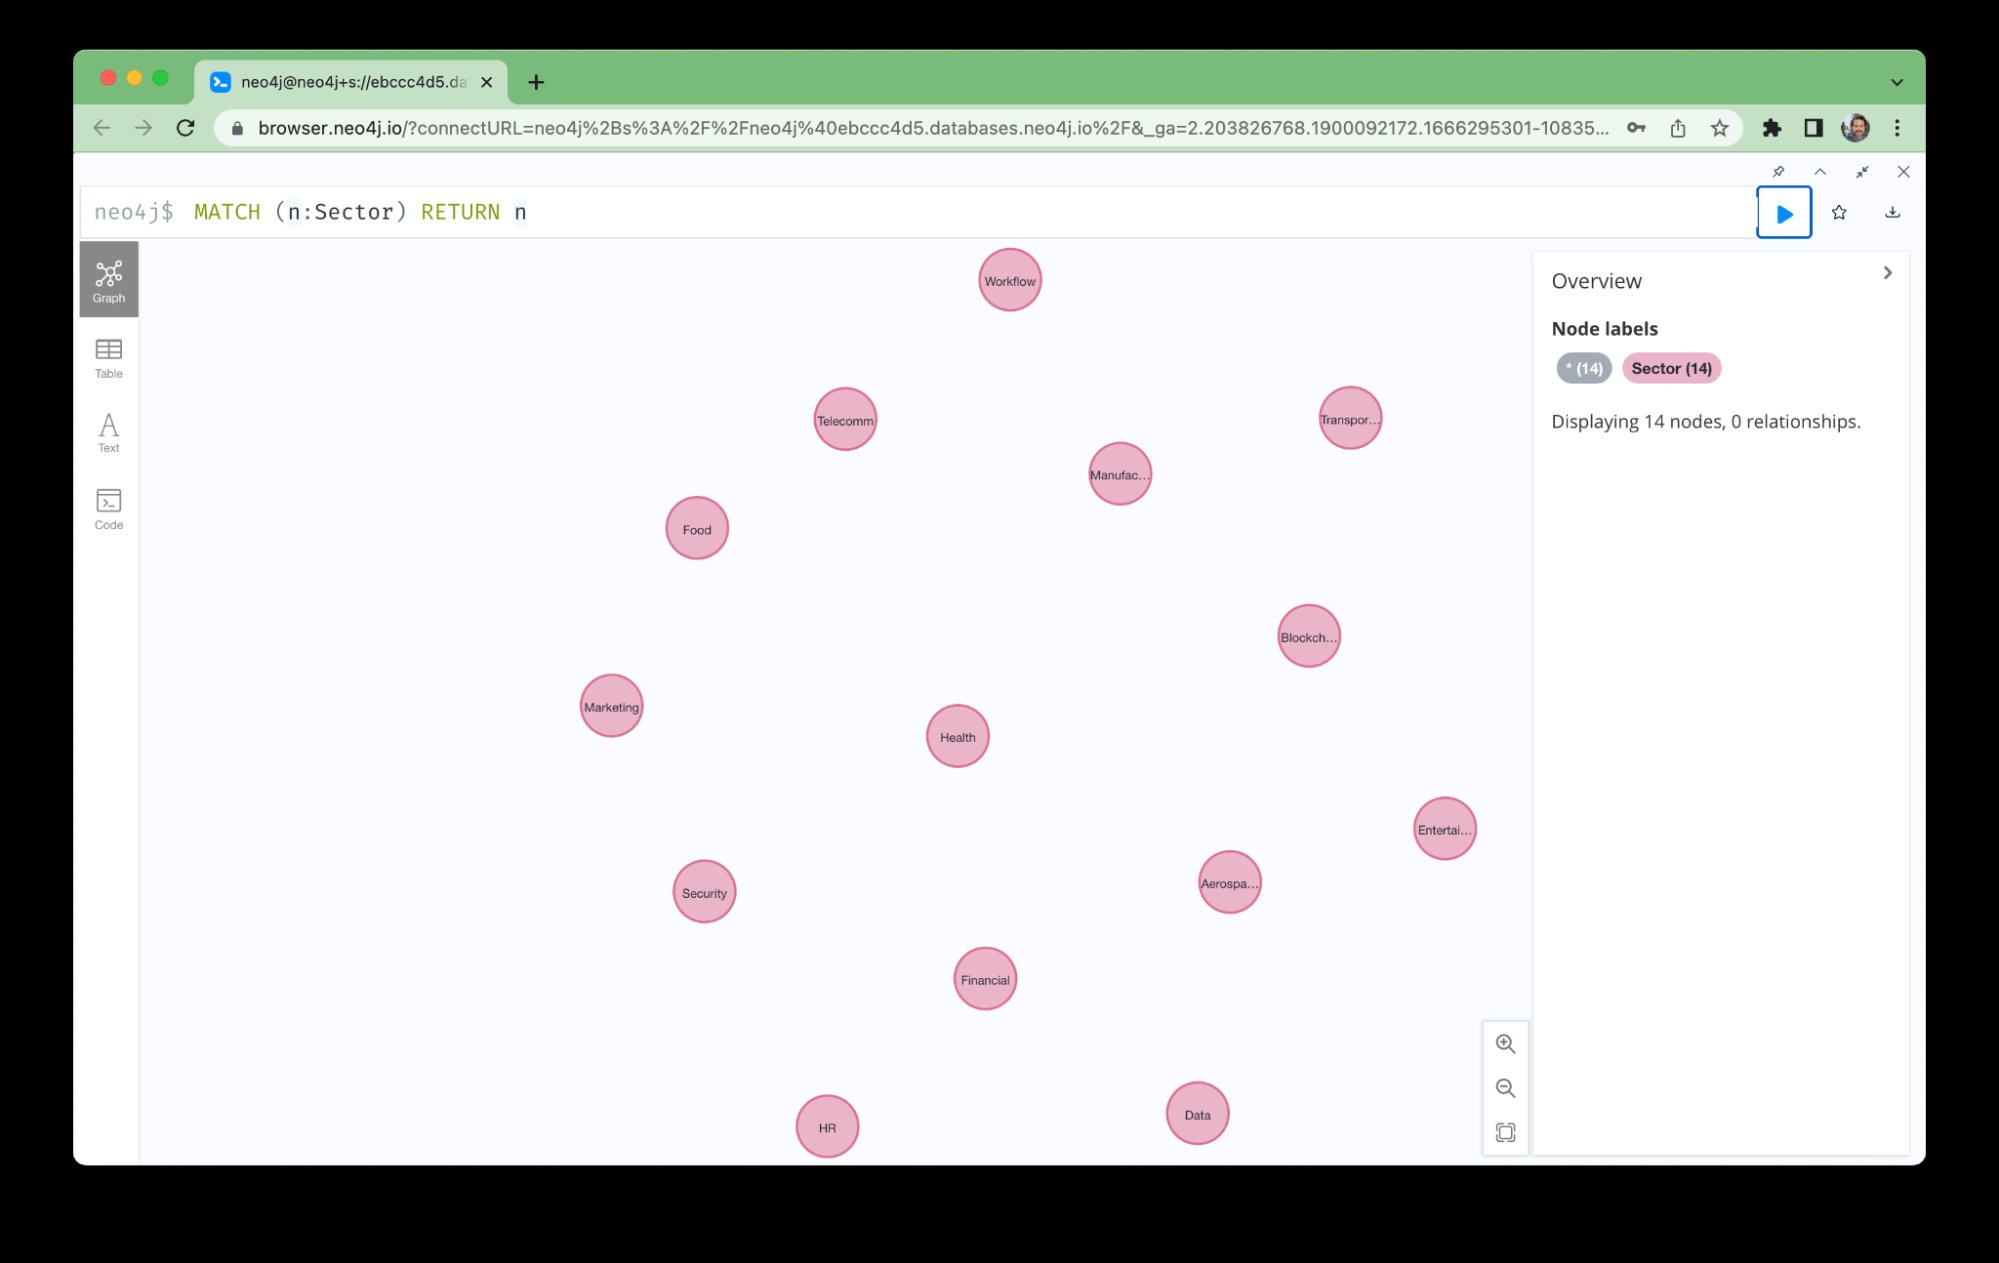
When complete, we can inspect the graph and see the index and subindices. One way to do that graphically is with Neo4j Browser. You can open that from within the Neo4j Aura console.
Now, we run the query:
MATCH (n:Sector) RETURN n
The result is a view of all the sectors in the data set, in this case 14 of them.
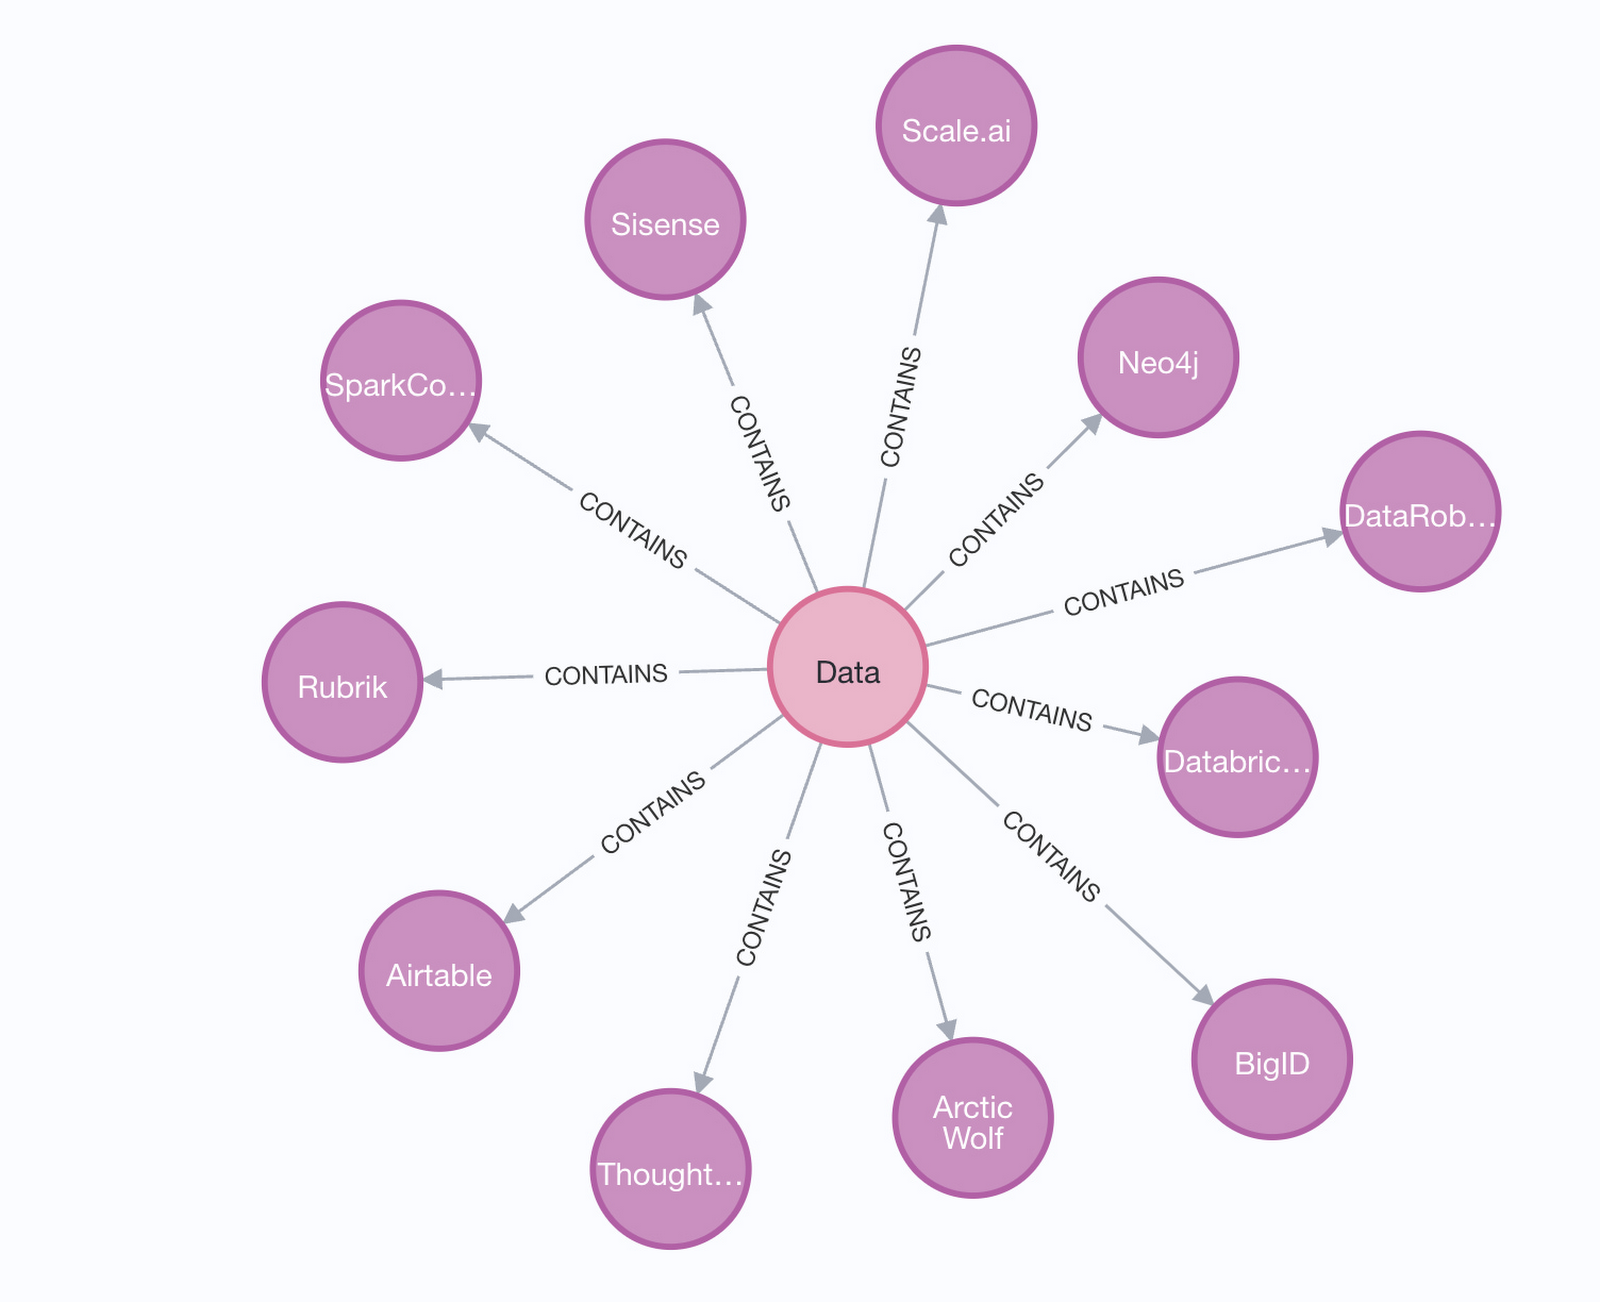
We can click on any of those sectors to view the companies which are part of it as well:
Similarly, we can search for specific items within our knowledge graph and then view the neighborhood around them. For instance, we can search for Neo4j by running the Cypher query:
MATCH (n:Company {name: 'Neo4j'}) return n
When complete, expanding the neighborhood around the Neo4j node gives an interesting view of how it relates to other firms and investors:
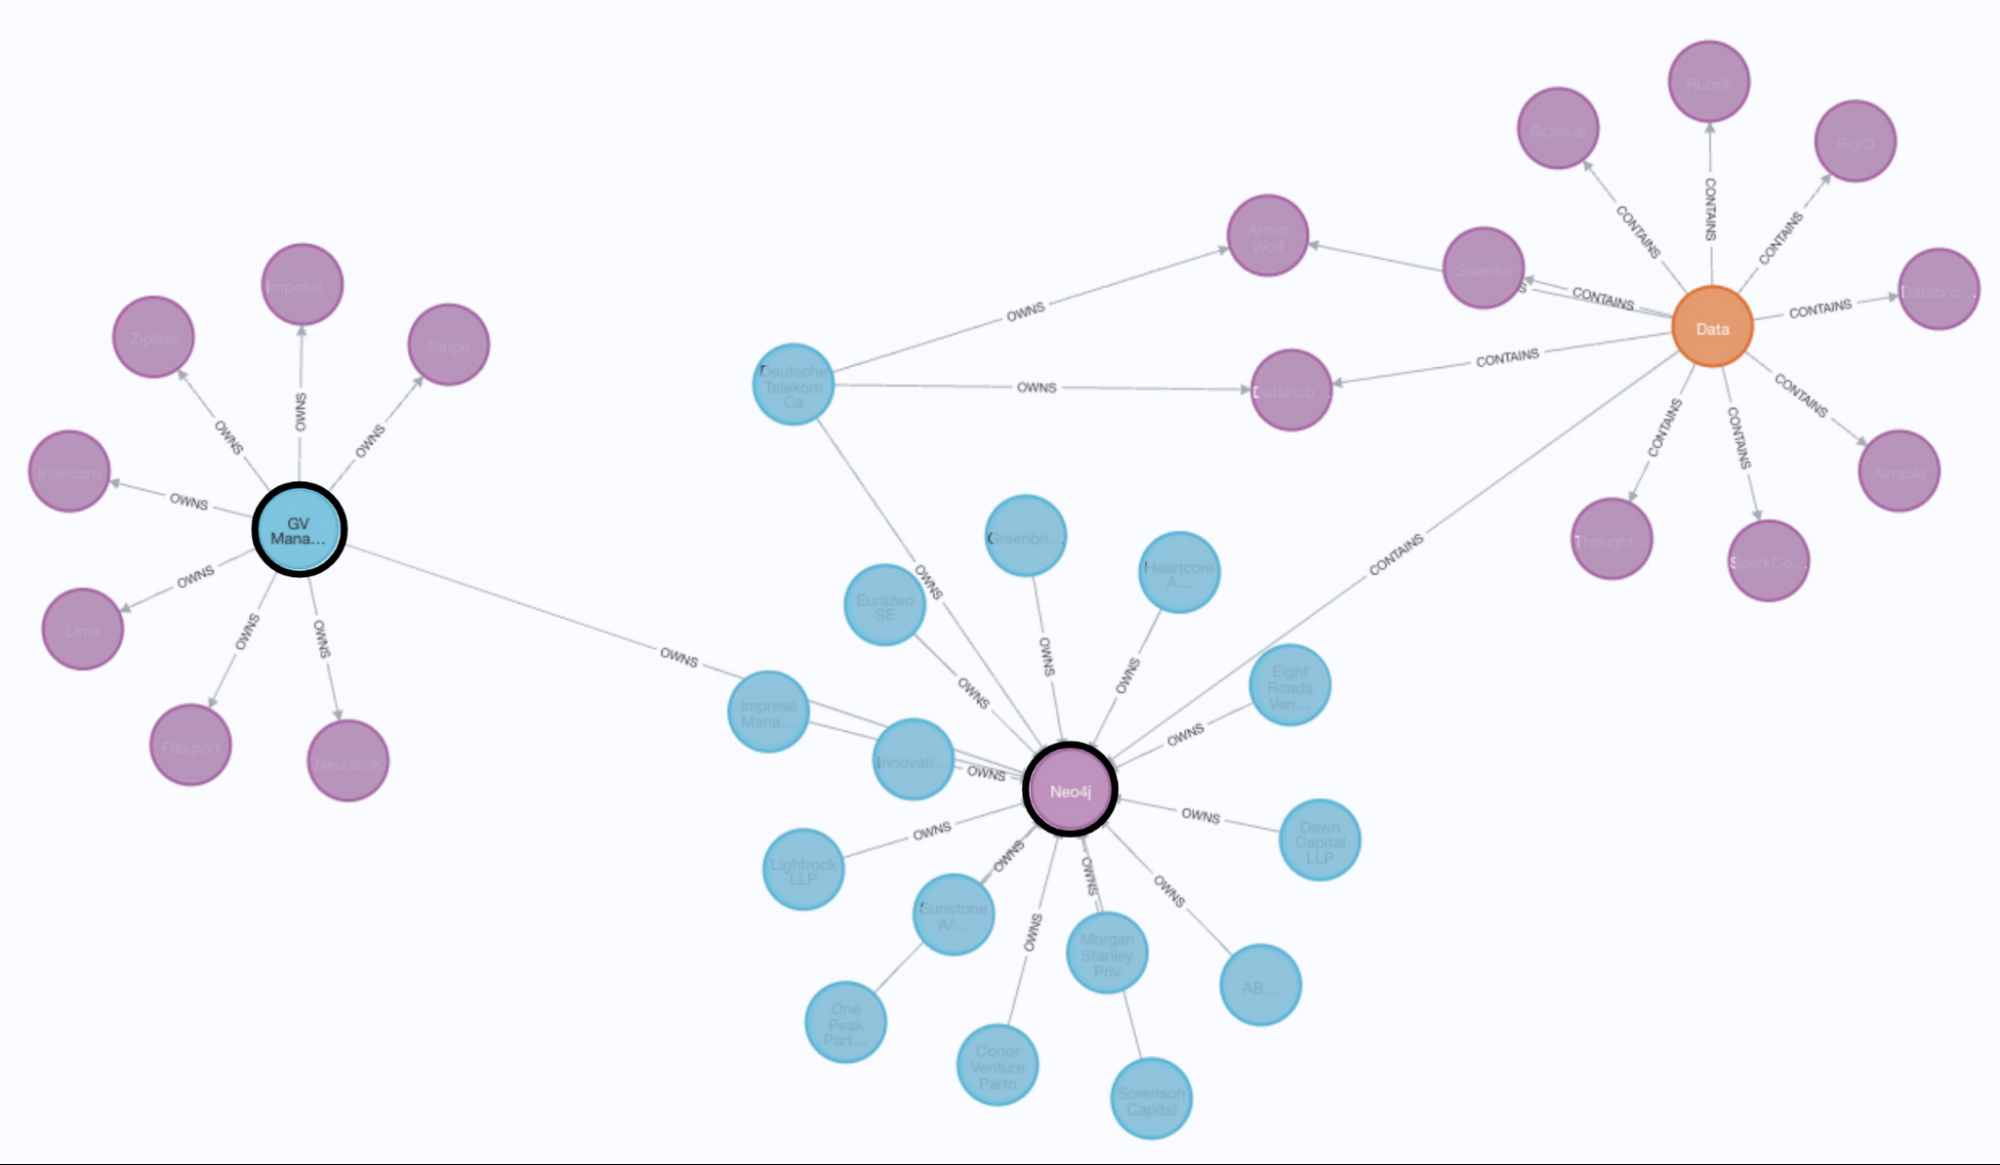
In this case, we can see that Neo4j has a number of investors (the blue nodes). One of these is named “GV Management Company, LLC,” previously known as Google Ventures.
Enriching the Data with Enterprise Knowledge Graph
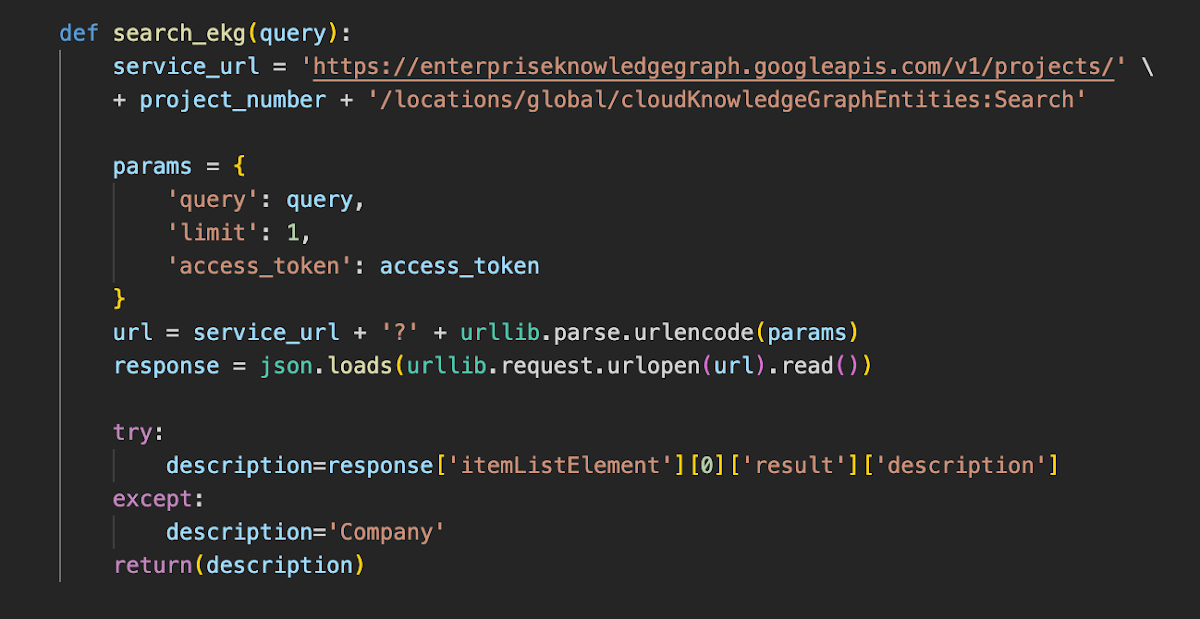
Our knowledge graph is pretty interesting in and of itself. But we can make it better. There’s no way to view the graph underlying Enterprise Knowledge Graph. However, we can query that graph and use it to enrich the knowledge graph we’ve built in Neo4j. In this case, we’re going to pass the company name into the API and get the description of that company back. We’ll then add a new property called “description” to each “Company” node in the Neo4j database.
That’s done via some Python code running in Vertex AI Workbench. A notebook showing an example of this is available here. The main part of that is the call to the Cloud Knowledge Graph API here:
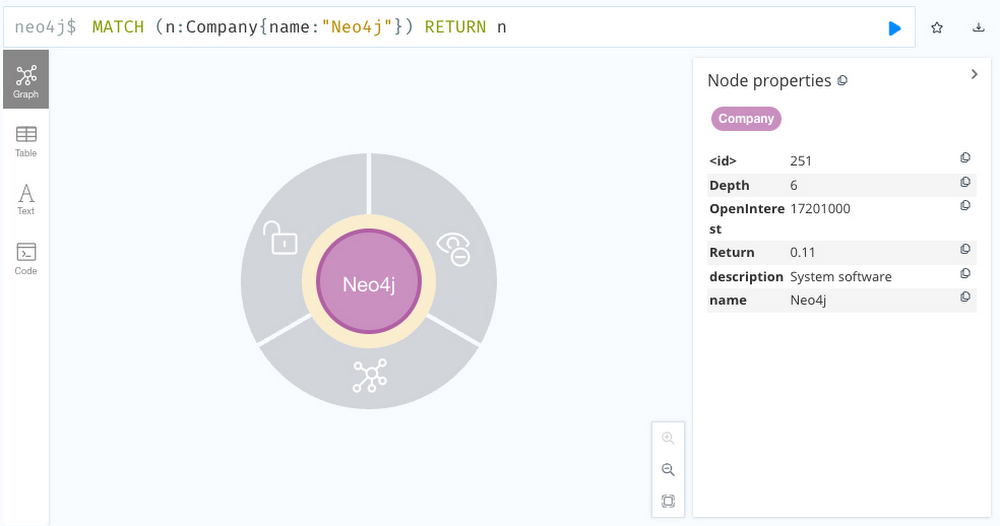
Once we’ve run through the notebook, it’s possible to inspect the enriched data set in Neo4j. For instance, if we query for “Neo4j” again in our knowledge graph, we’ll see it now has a property called description:
What we’ve done here is take the best of both worlds. We’ve leveraged Google’s incredible expertise in search and knowledge aggregation with Neo4j’s market leading ability to store, query and visually represent data as graphs. The result is a very powerful way to build custom knowledge graphs.
Exploring the Knowledge Graph
Now that we’ve loaded and enriched our data, let’s explore it. To do so we’ll use Neo4j Bloom, a graph specific business intelligence tool.
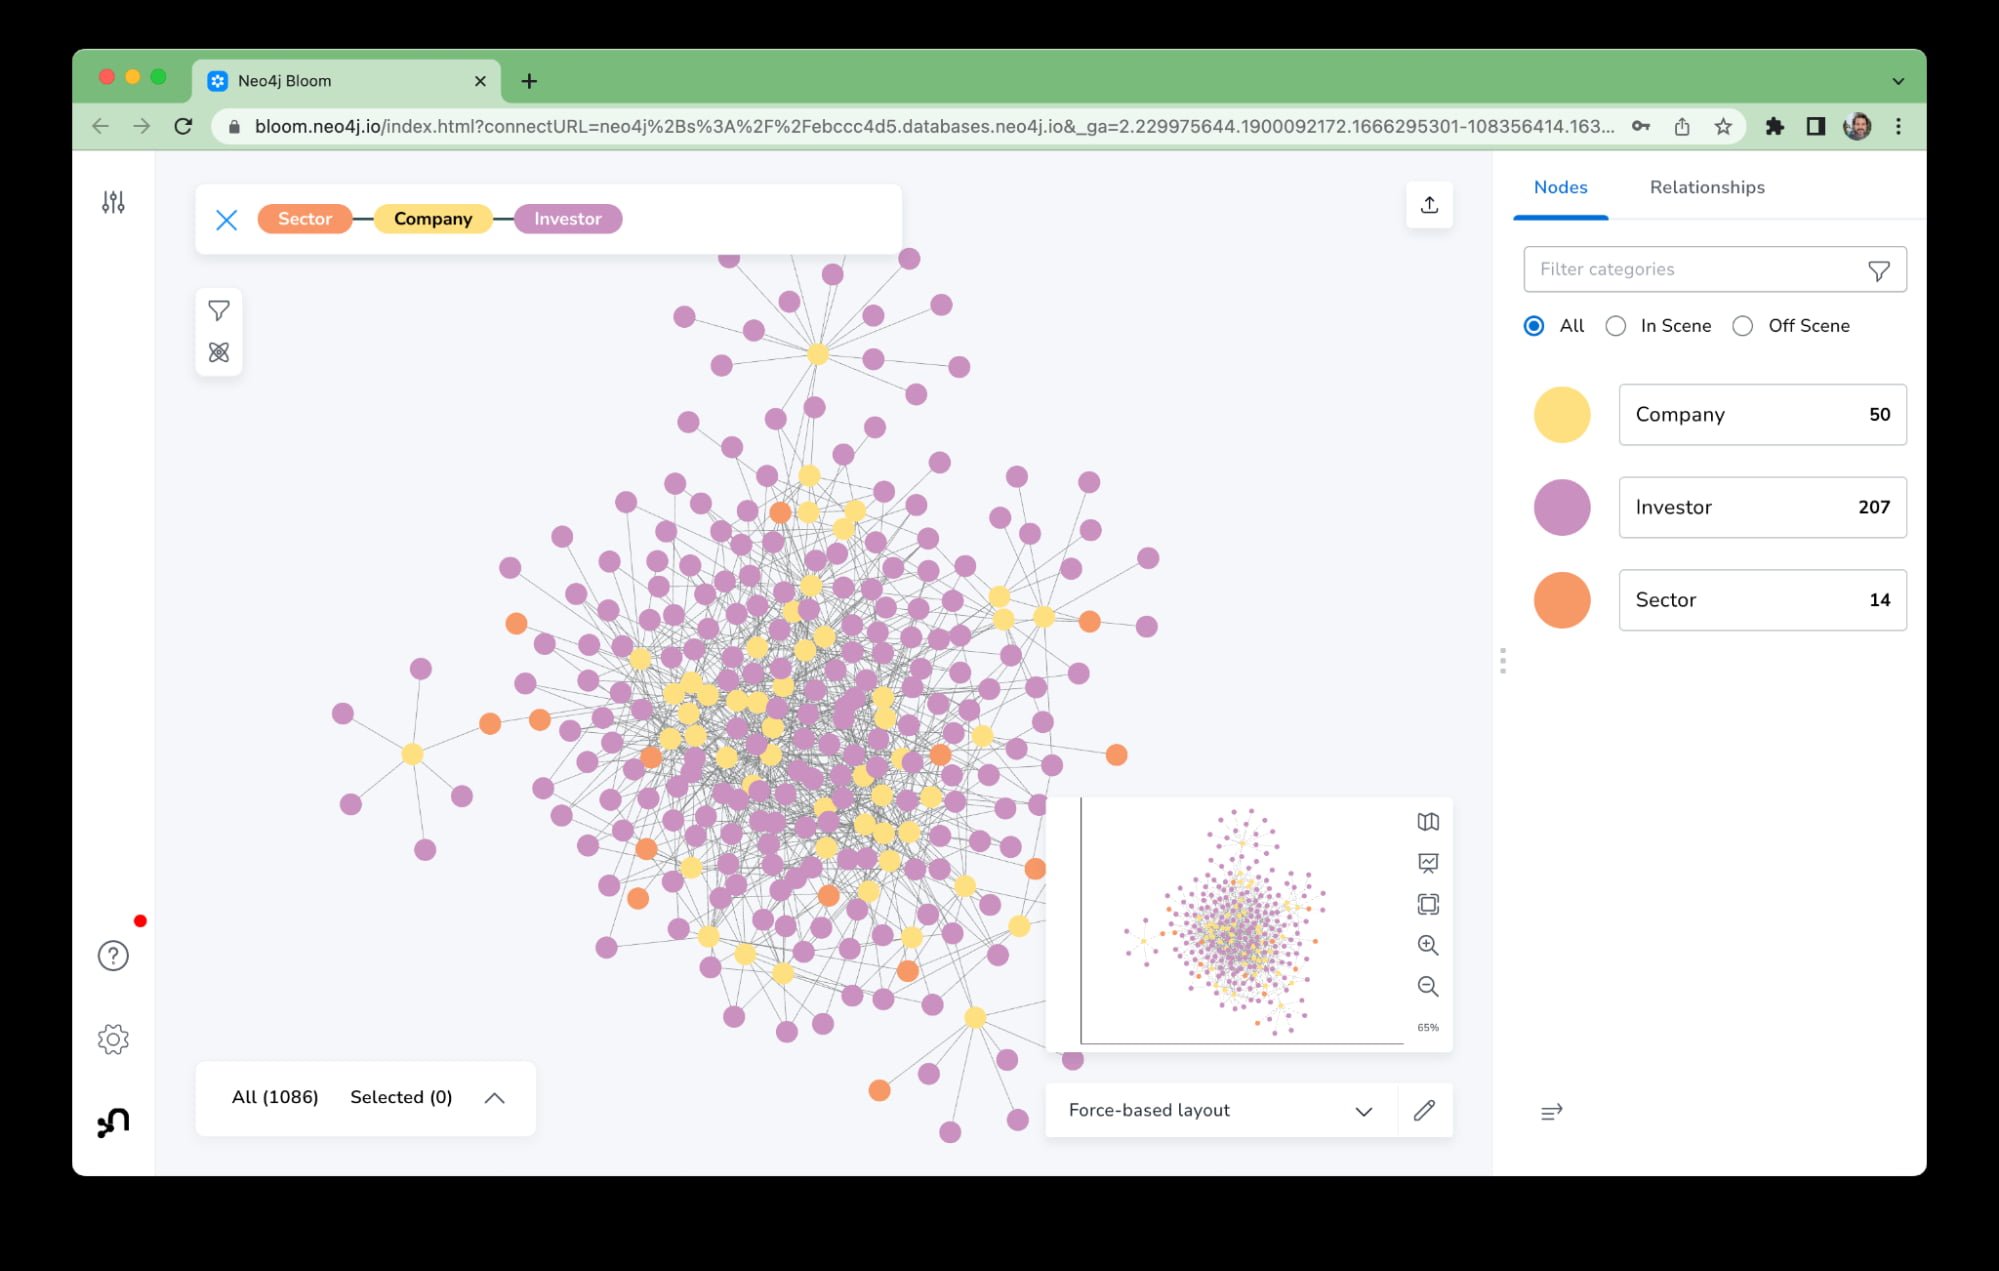
First off, let’s take a look at the companies and graphs:
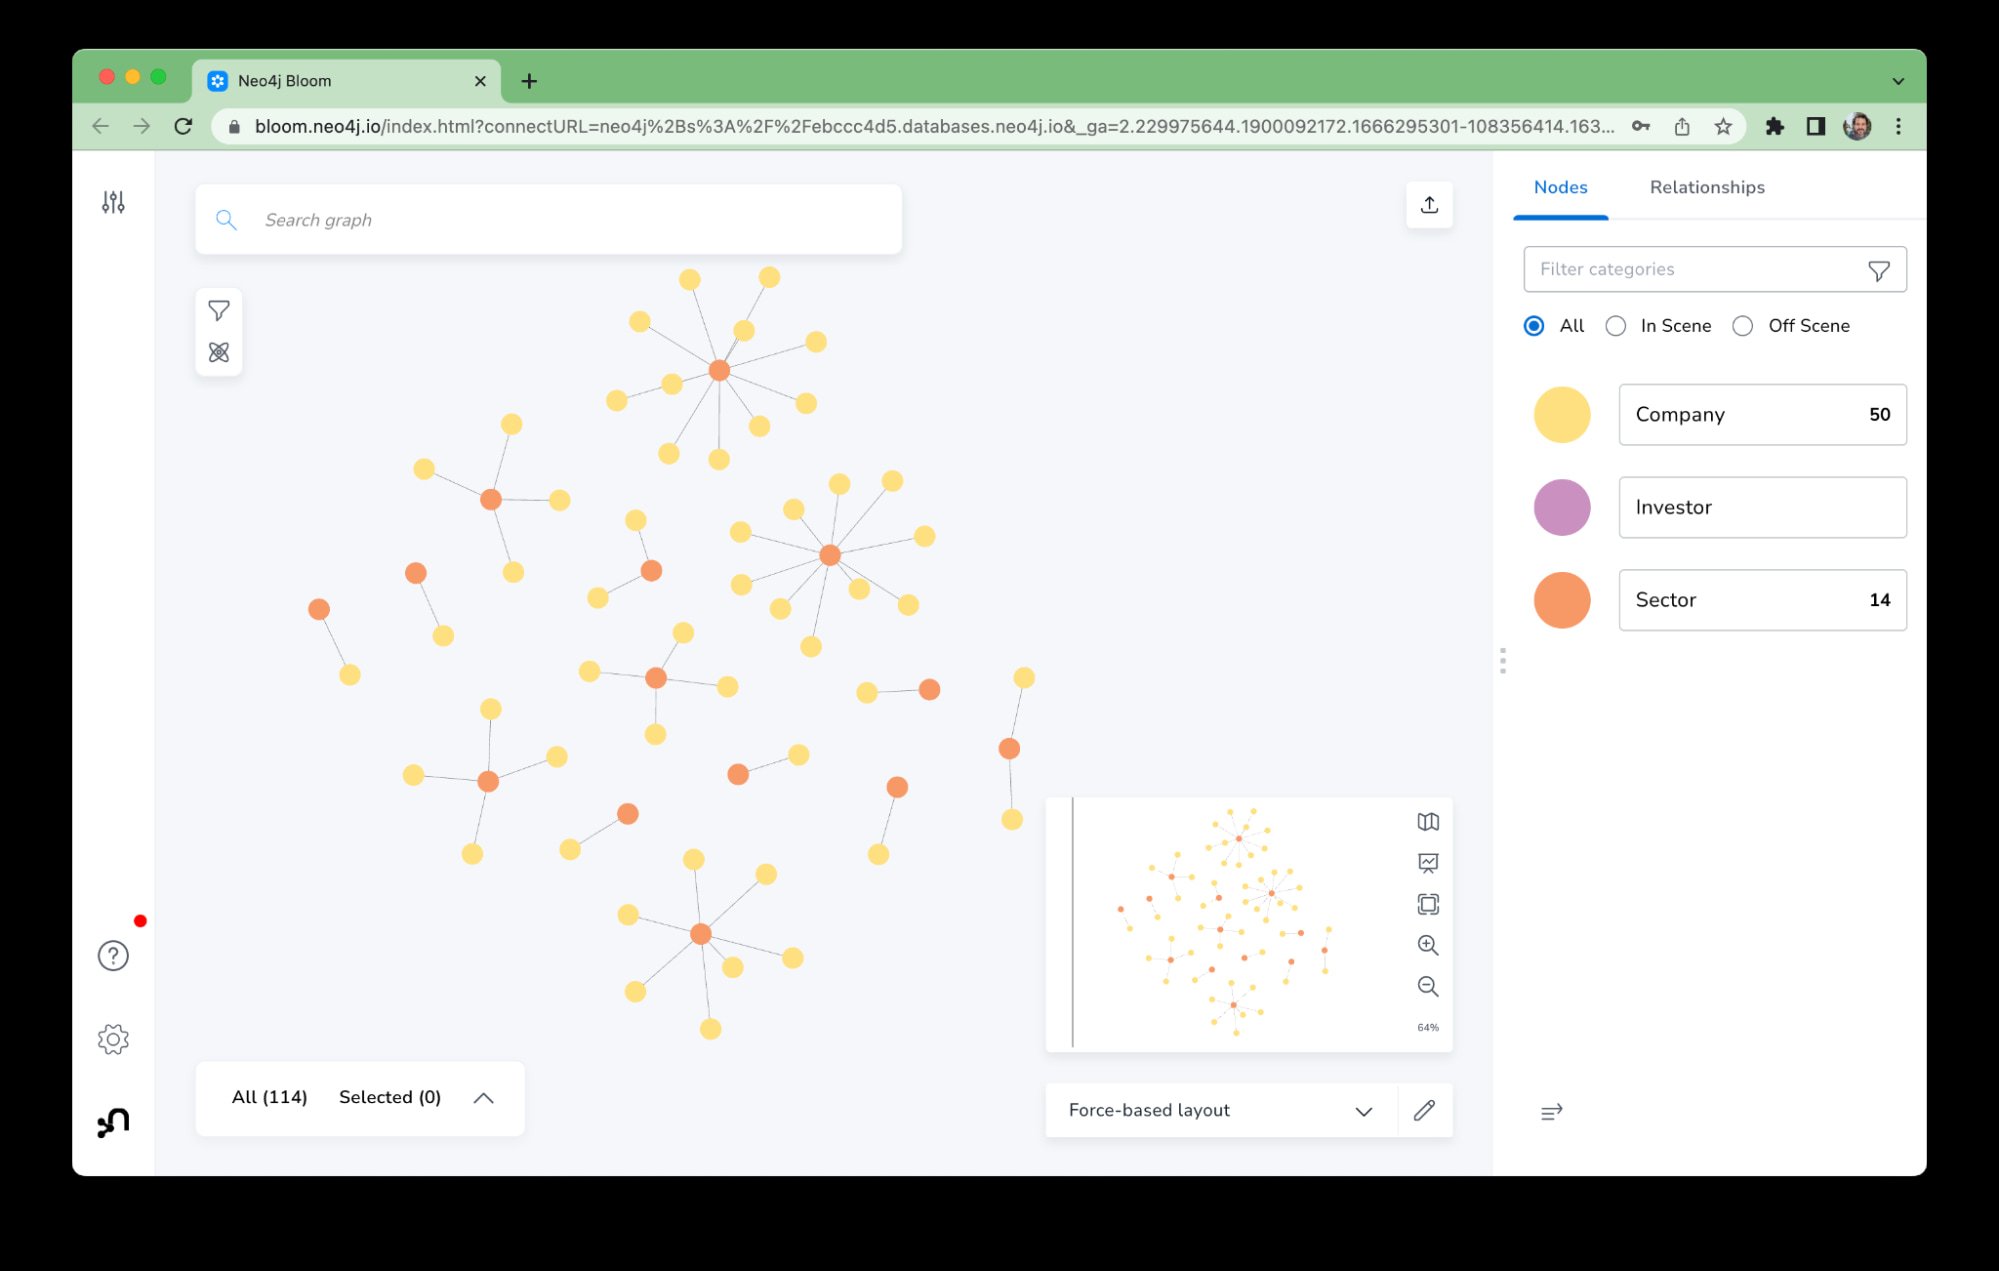
Here we can see our 14 sectors as the orange dots. A few sectors only have one company as part of them but others have many. Rerunning the search to include our investors, we now get a much more crowded view:
We can use the Neo4j Graph Data Science component to better make sense of this picture. Computing the betweenness centrality on the graph gives us this view.
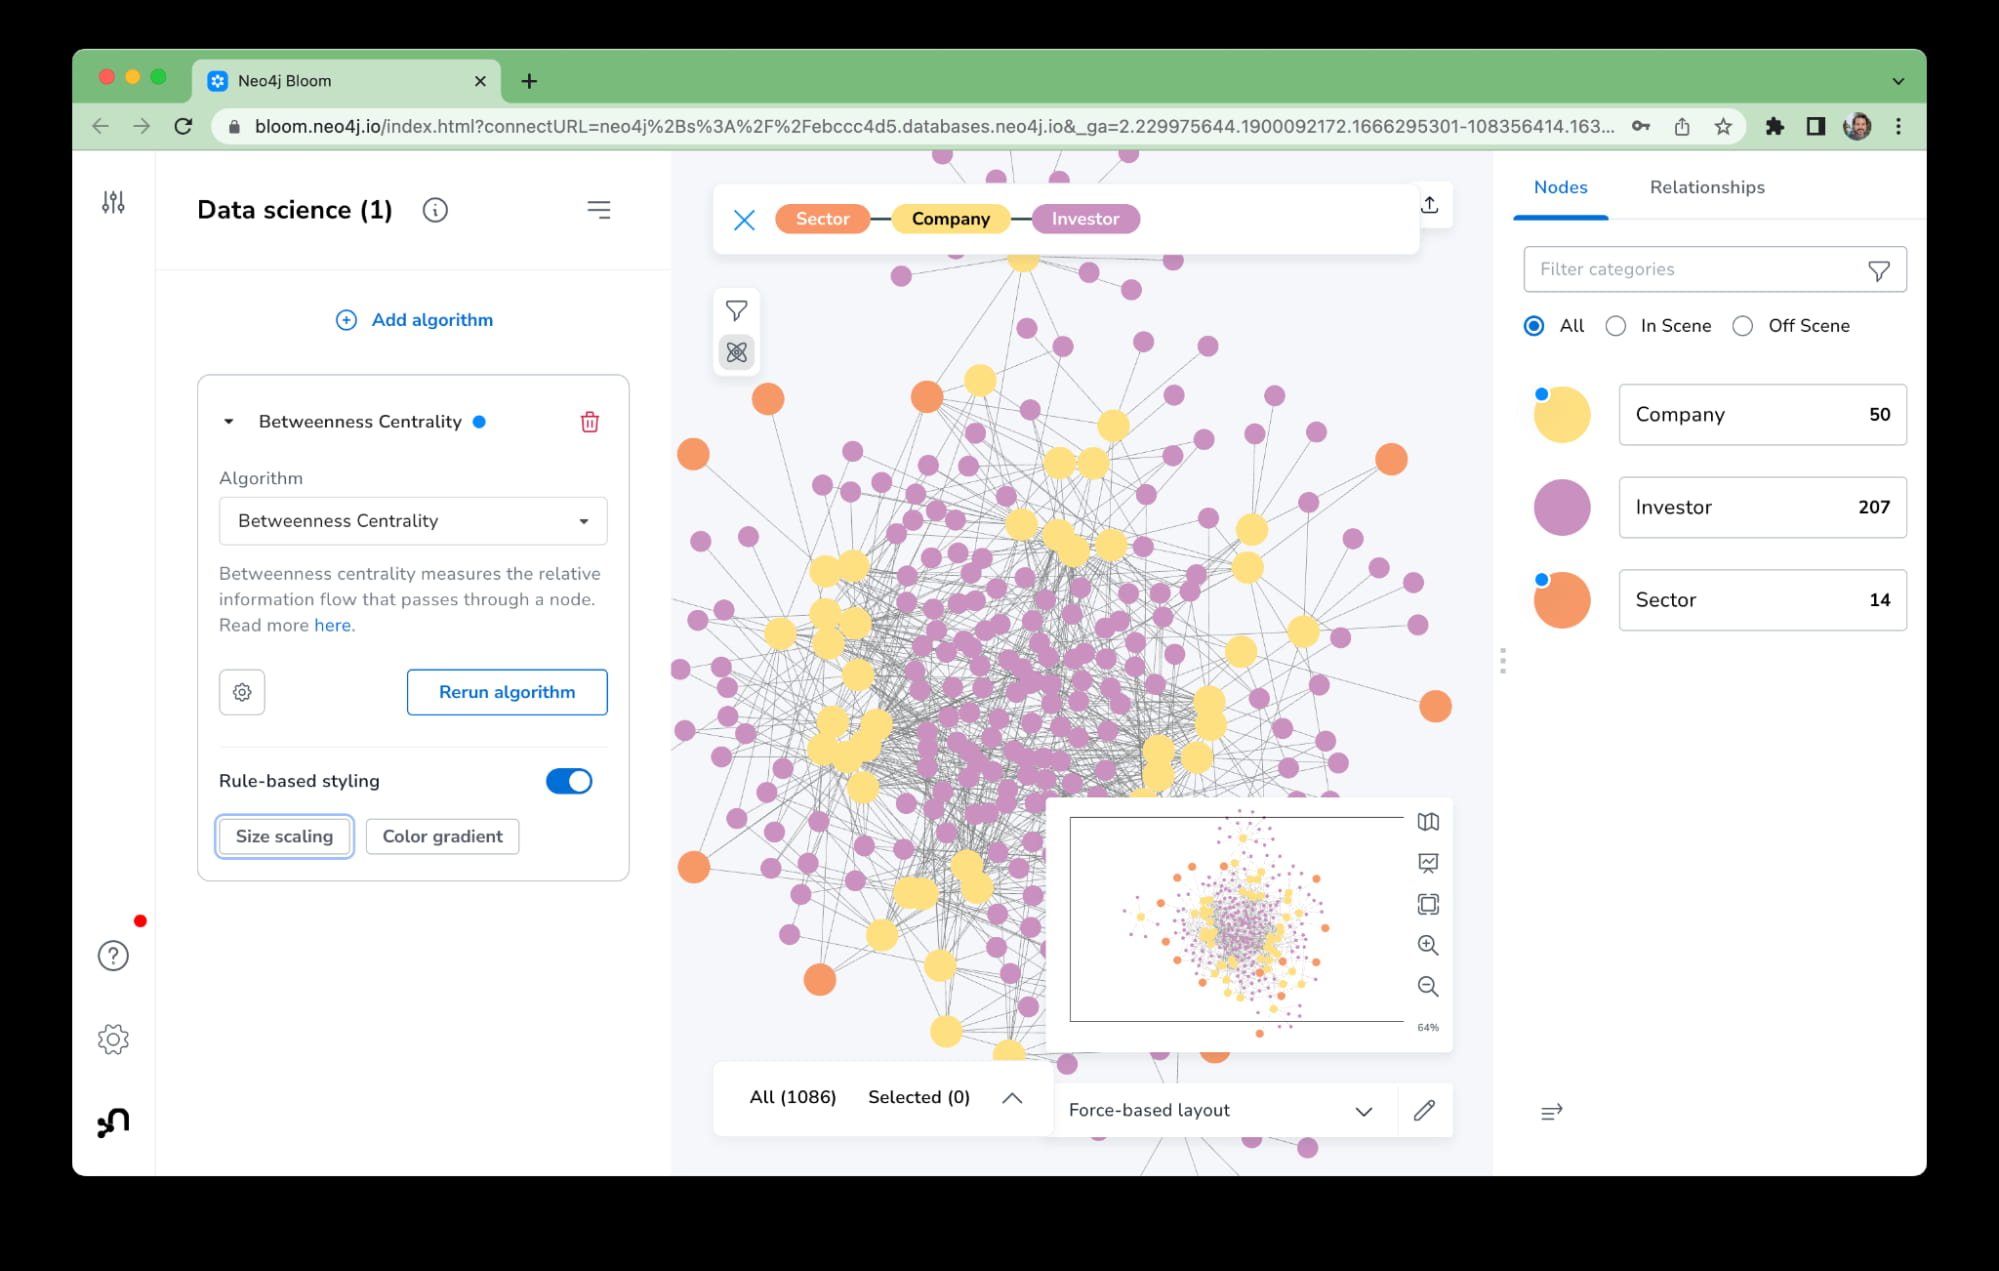
In it we’ve sized nodes according to their score. One surprising thing in this is that the investors aren’t what’s important. Rather, the companies and sectors are the main connecting points in our graph.
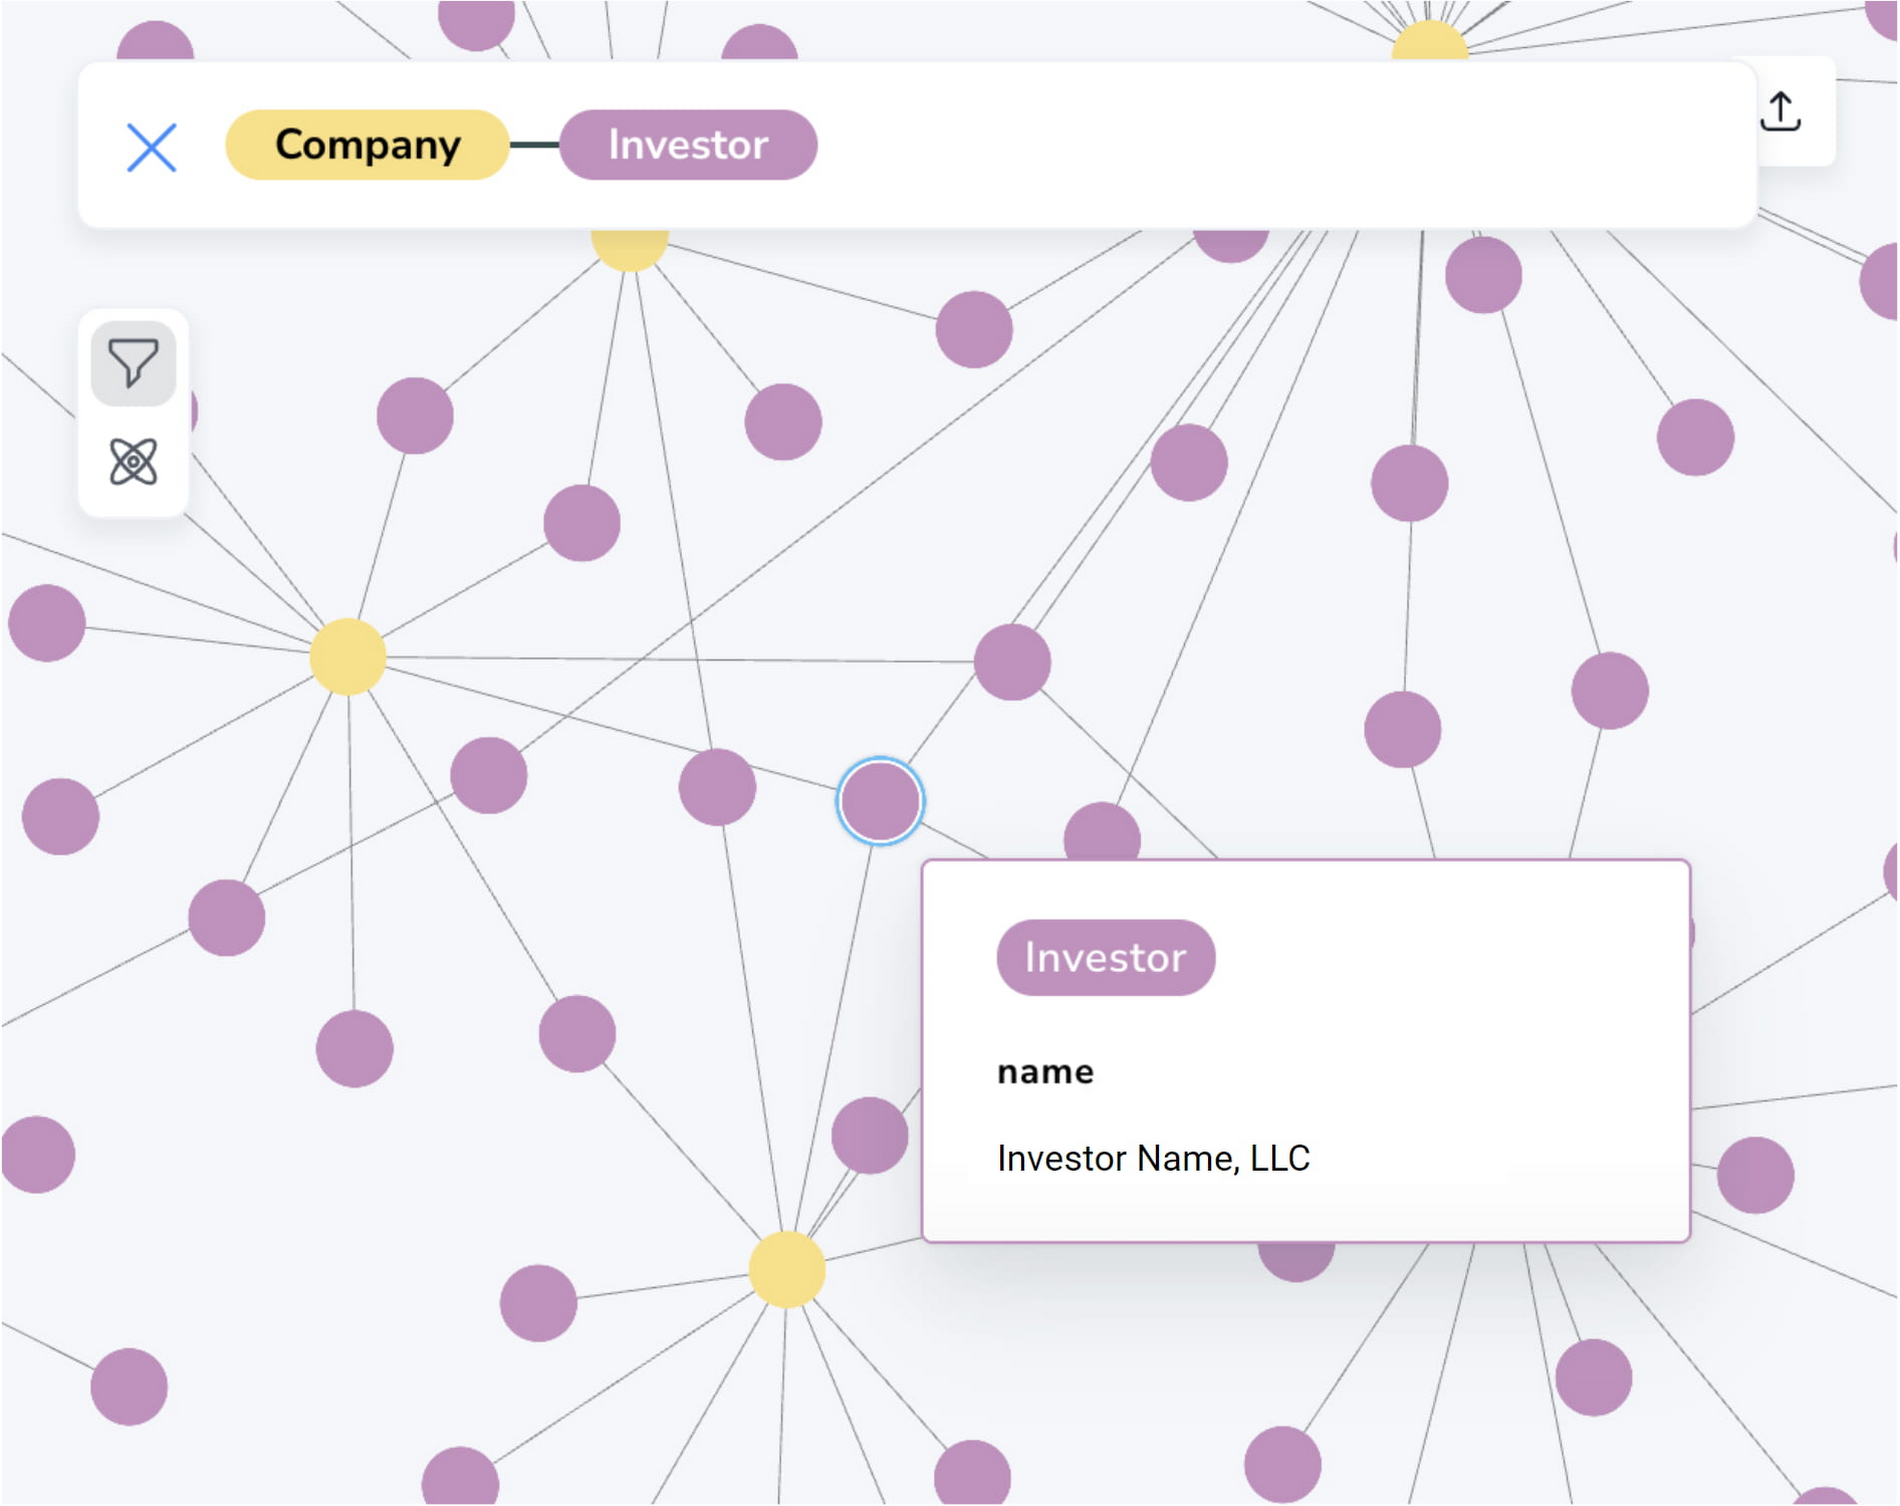
We can also add filters to our perspective. For instance, we can filter to see what companies had a return of 10% or greater in the last month. That gives us this view:
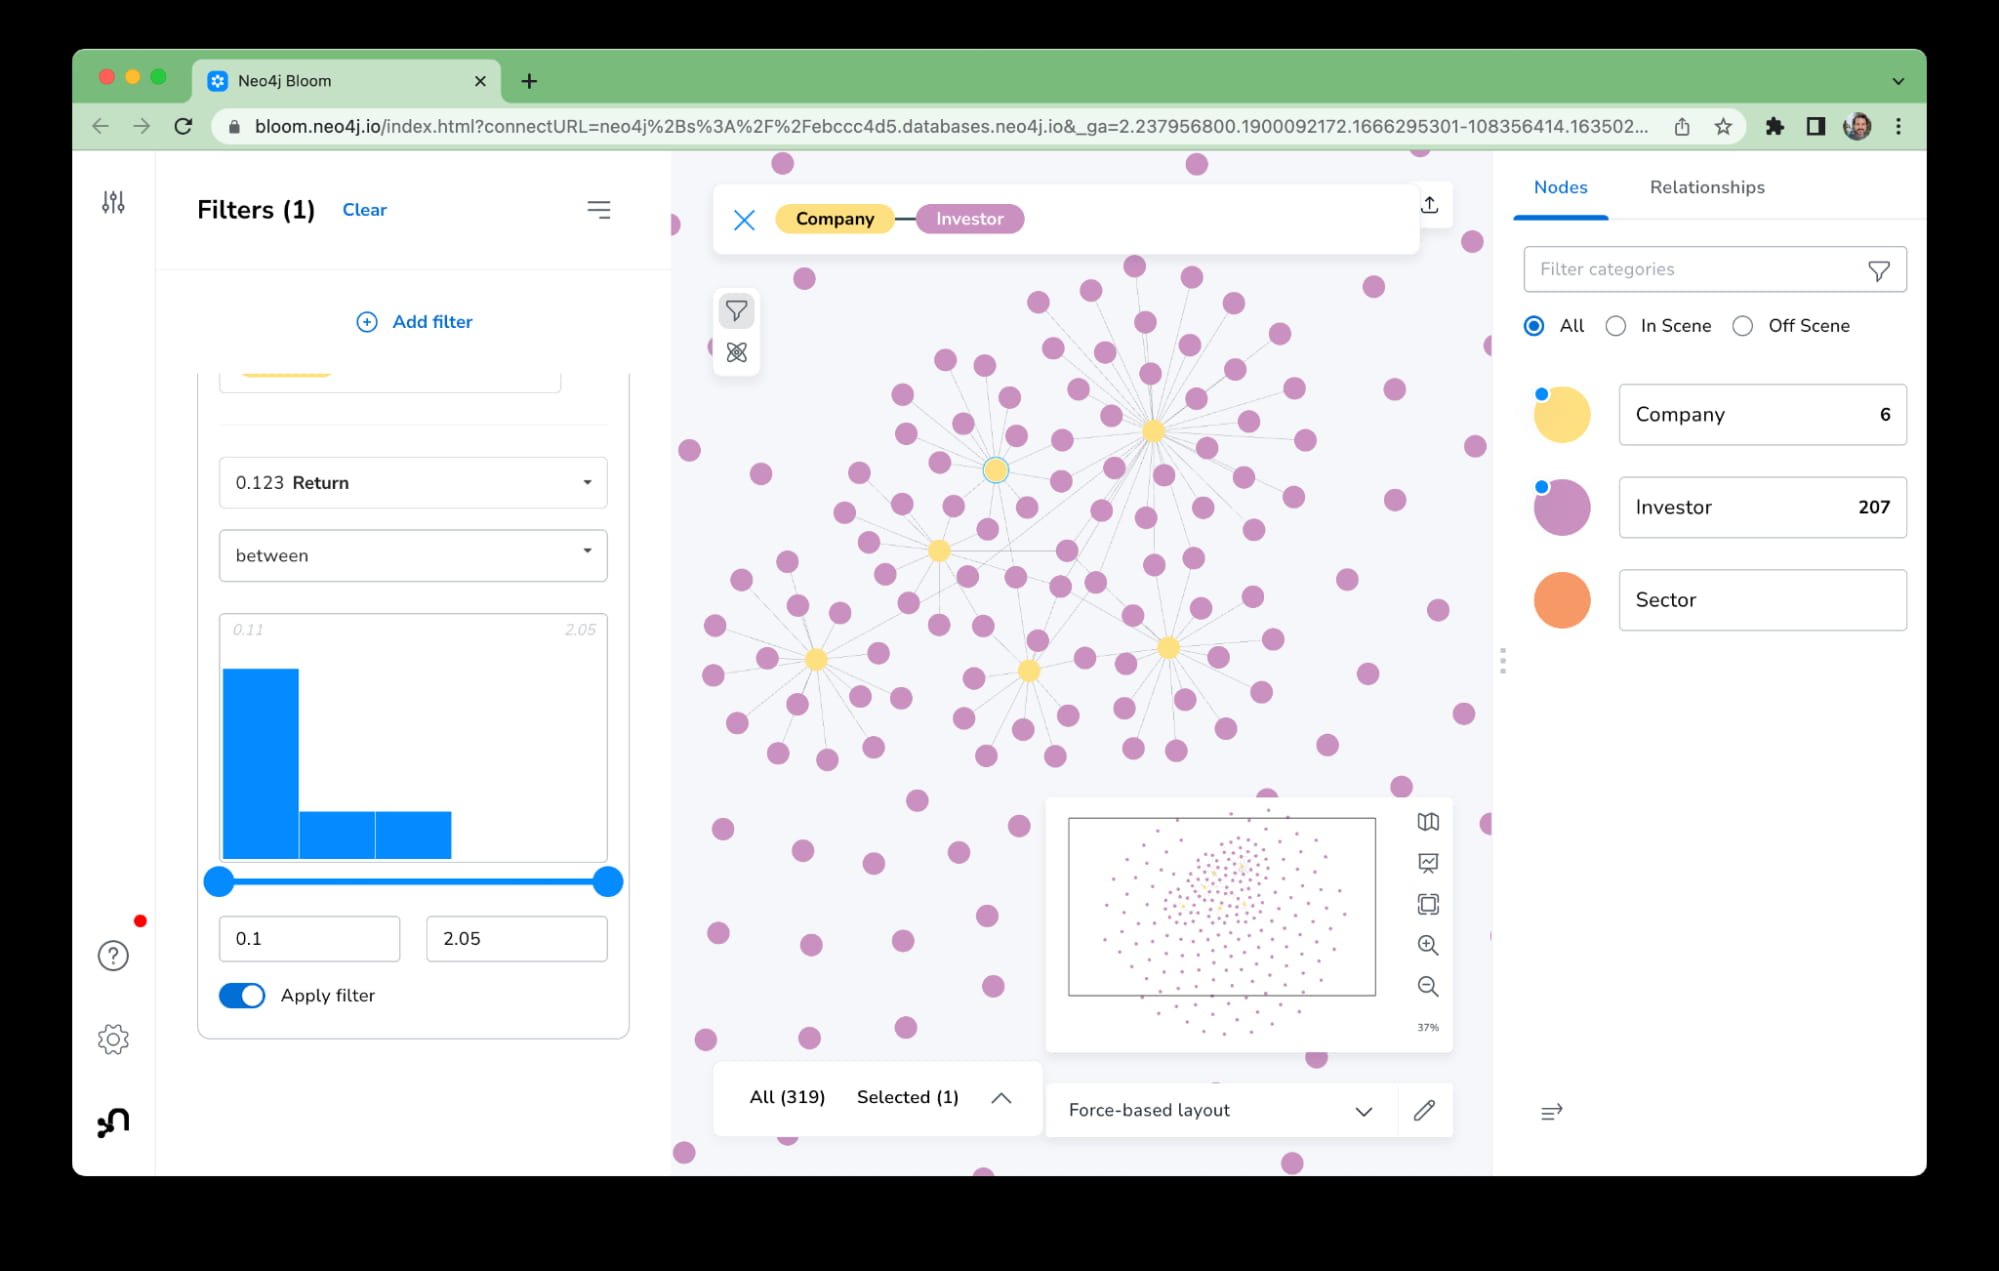
Zooming in on that view, we can identify a firm that invested in four of those companies that returned 10% or greater.
This is a small subset of what’s possible with Bloom. We invite you to explore this data on your own!
Conclusion
In this blog post we loaded a dataset provided by ApeVue into Neo4j AuraDS. AuraDS is Neo4j’s managed service, running on Google Cloud Platform. The data we loaded consisted of the ApeVue50 index, including return, depth and open interest data. We queried the data using Neo4j Cypher and Browser. We enriched that dataset with queries to Google Enterprise Knowledge Graph. Finally, we explored the dataset using Neo4j Bloom.
The enriched knowledge graph gives us a more complete view of the private equity data. Downstream systems using this knowledge graph would have access, not just to return investor and sector information, but also to a natural language description of what the company does. This could be used to power conversational agents or be fed into full text searches of the data set.
Systems that use Neo4j and Google Enterprise Knowledge Graph can provide better insights and understanding of connected information than otherwise possible. Downstream systems can then make more accurate business decisions and provide better customer experiences.
You can find the notebooks we used on GitHub here.
If you’d like to learn more about the dataset, please reach out to Nick Fusco and the team at ApeVue (contact@apevue.com). For information on Neo4j, please reach out to ecosystem@neo4j.com with any questions.
We thank the many Google Cloud and Neo4j team members who contributed to this collaboration.