Data science with Looker: part I
Haarthi Sadasivam
Data Evangelist
Looker isn’t just a BI tool. It’s a full data platform, which means you can use it as part of a data science workflow. Looker is great for cleaning data, defining custom metrics and calculations, exploring and visualizing data, and sharing findings with others across your organization, including scheduled data deliveries. For many types of analysis, you can efficiently complete your entire workflow in Looker.
But for more advanced analytics there are specialized tools that are going to work better for the remaining 20% of your workflow. Looker writes SQL, and while SQL is great for a lot of things, you’re not going to use it to run a clustering algorithm or build a neural network. Because of these limitations, data scientists usually turn to Python or R and run them in a dedicated Data Science Environment (DSE) like R Studio or Jupyter Notebooks.
A typical workflow may look like this:
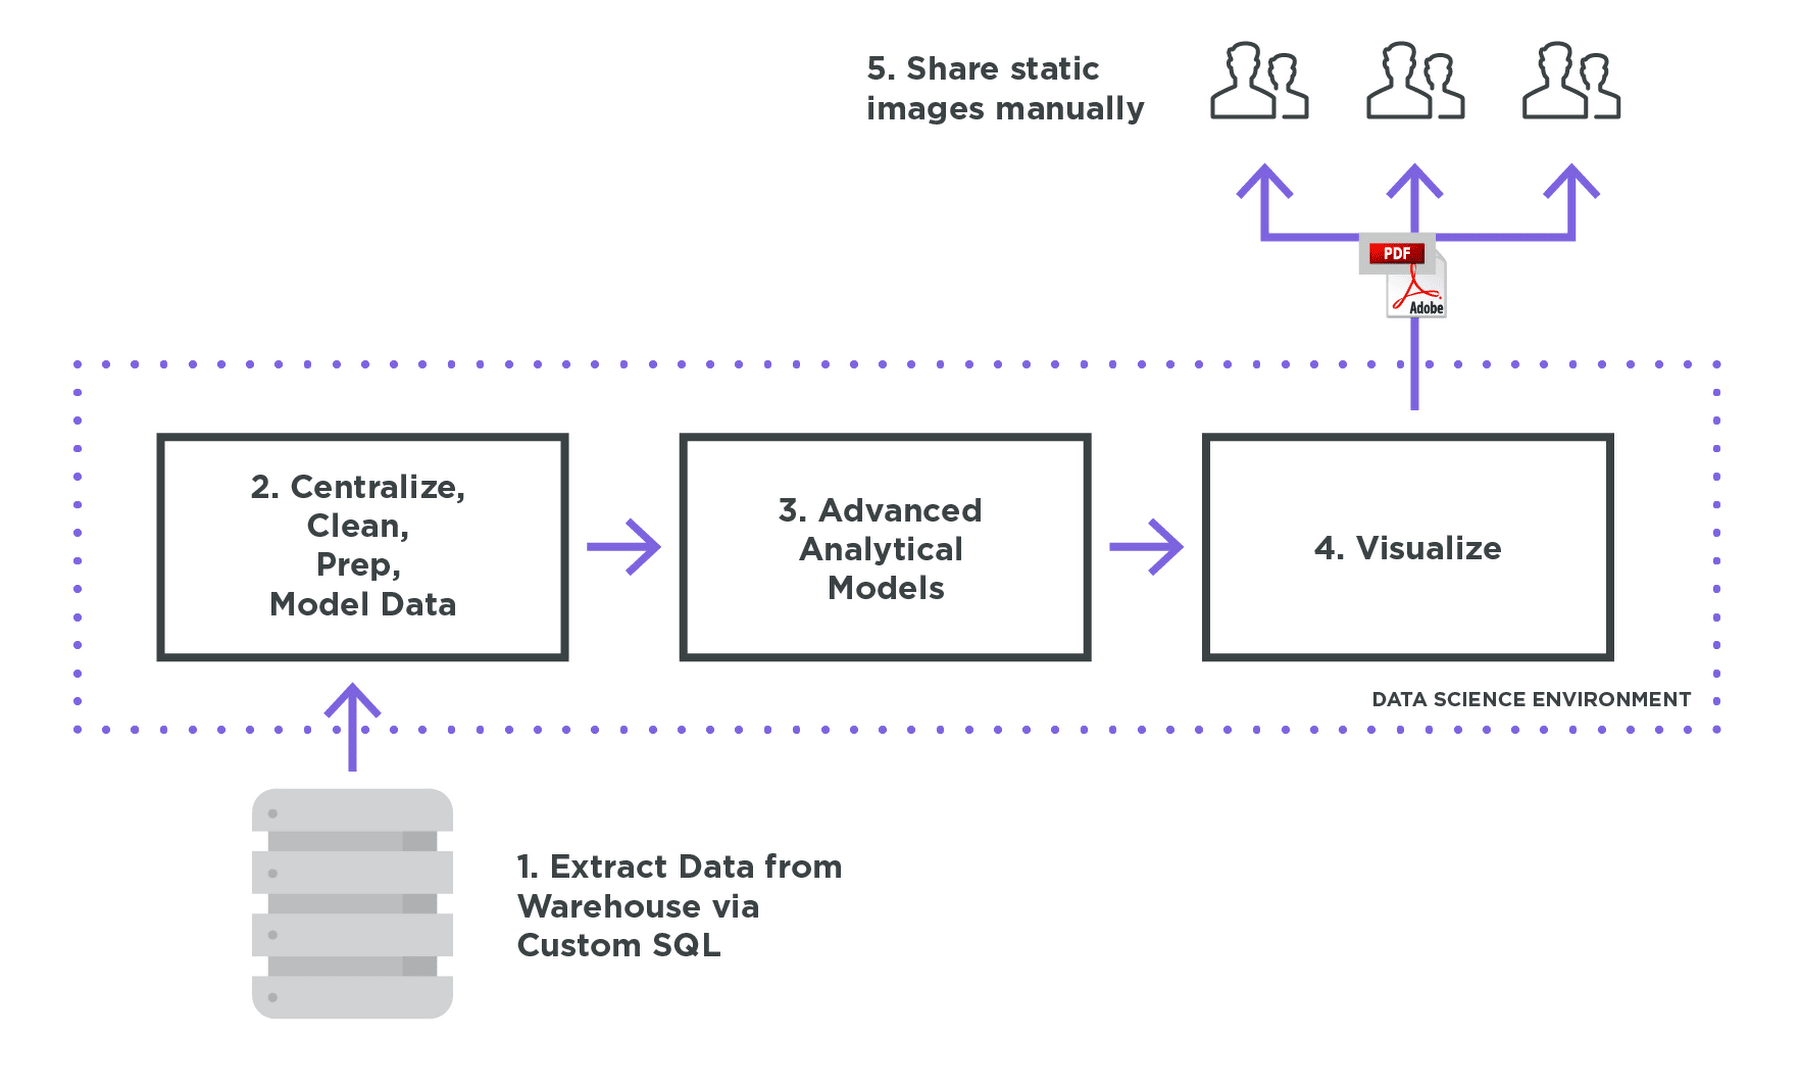
Before a data scientist can start analyzing data in a DSE, they first extract the relevant data from their company’s warehouse. They then spend a considerable amount of time preparing the data, including merging, reshaping, and cleaning this data in their DSE. Once the data has been prepped, advanced functions -- whether they are predictive models or optimizations -- can finally be written in Python or R. But most advanced analytics workflows are iterative. Models are constantly updated to include additional variables. This means repeating steps 1 and 2 (extraction and data prep) multiple times in order to arrive at an optimal dataset.
Once you finally have something you’re ready to share, you’re faced with the question of how to get the findings out of your Data Science Environment and out to your stakeholders and decision-makers for review. Because visualizing data and then sharing it isn’t the core function of DSEs, is often a labor-intensive process.
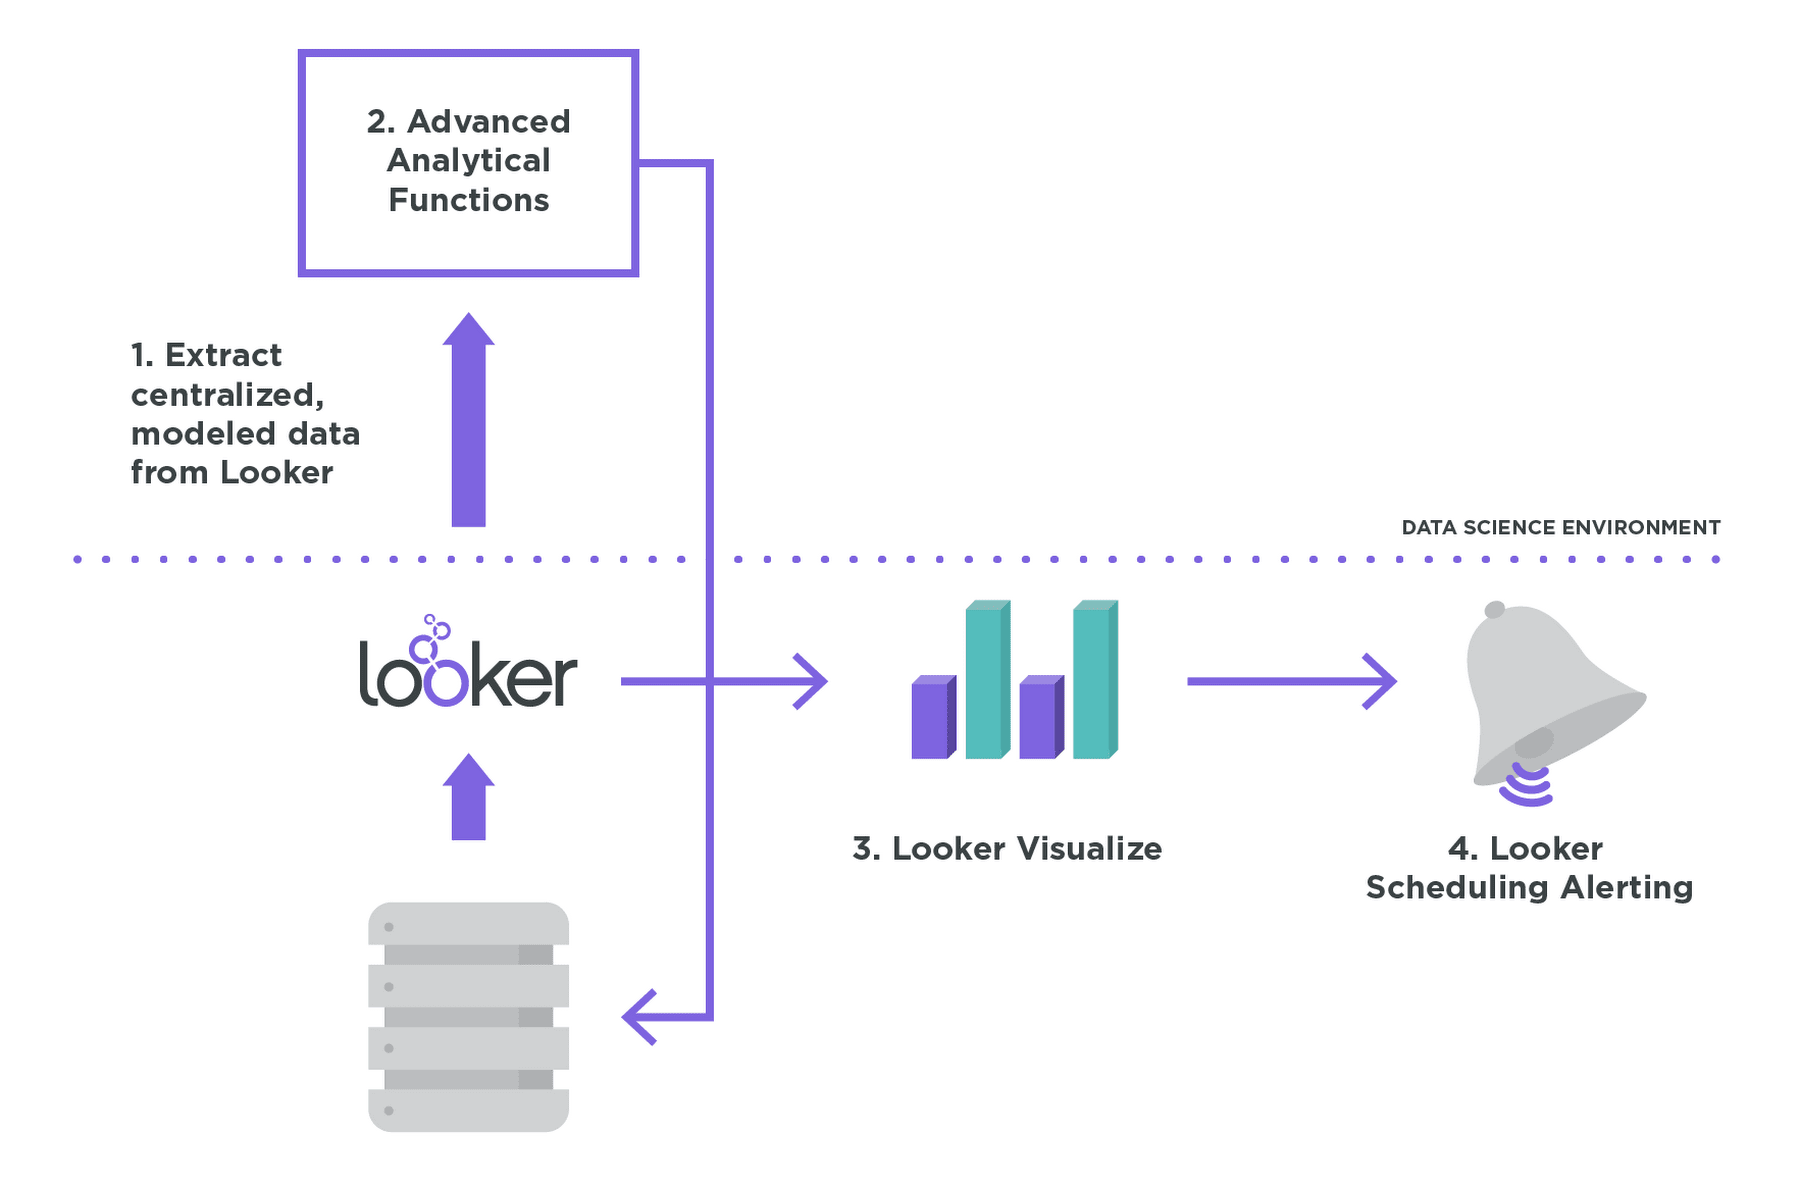
So, while a data scientist spends most of their time in the DSE, only a small portion of their time is actually spent doing the thing that the DSE is best at: advanced analytics. Most of their time is spent preparing data and maintaining ways to share that data with the rest of the organization. But Looker is good at exactly the pieces of the workflow that DSEs are bad at. So we’ve seen data scientists adopt a right-tool-for-the-job workflow that lets them get more done, more efficiently. Here’s what that usually looks like:
What’s different about this approach?
Looker lets you accomplish the first steps of extraction, data prep and data exploration far more quickly than in a pure DSE workflow. Then, when you’re ready to tackle the data science portion of this workflow, you use the DSE for what it’s great at: writing advanced predictive models and tuning them.
Looker’s modeling layer allows you to define how tables relate to each other and specify custom metrics in an intuitive, reusable way that lets you iterate, clean, and explore more quickly. Looker automatically writes the right SQL to get access to the data you need, in the shape you need it. And because Looker is a data platform, it’s easy to simply pull in the data you’ve curated (or the pre-written SQL that’s producing it) with a single API call.
Once you’ve finalized your model and are ready to deploy it in production, you can use your DSE to generate predictions or make use of an external tool like Spark, or AWS or Google’s Machine Learning APIs. And as those predictions get pumped back into your database, users can access those predictions right in Looker.
That means anyone in your organization can explore real data and predictions right alongside each other. It means they can visualize them to make sure that the model is continuing to perform well. And they can even schedule data deliveries or alerts from Looker based off of ongoing predictions.
All of this is easy because you’re using best-in-class tools together harmoniously, rather than trying to use one tool for everything.
To show you how easy and effective this workflow can be, look out for our follow-up post walking through a predictive model that we’ve built using Looker, Python, and Jupyter on some neat bikeshare data.
