Reports empower customer success, packaged in Wix’s signature, easy-to-use platform
Michal Baram
Head of Wix Exposure and Director of Product Management, Wix
Try Google Cloud
Start building on Google Cloud with $300 in free credits and 20+ always free products.
Free trialAt Wix, we help our customers create, manage, and grow their business online with a website builder our customers can use to make stunning websites — all without coding. Our 200 million users span 190 countries and 31 languages, and range from novices to experts. From bloggers, musicians, and law firms to medical businesses, event planners, and store owners, our customers are exceptionally diverse and constantly growing.
We’ve been successful because we’re obsessed with the user experience and making data-driven decisions. We believe that if our customers are successful, then we will be too. For that reason, we decided to provide an analytics solution to our customers — so that they could access the same kind of reports that helped us succeed.
The journey to a data analytics offering
Prior to Looker, we felt that we had created perhaps the best website builder in the world — but we weren’t finished. We knew that data analytics would play a key role in our customers’ growth (as it did in ours). Investing in analytics for our customers was the next step.
Finding the right solution
The main factors we considered in evaluating solutions were:
- User friendliness
- Ability to incorporate seamlessly into our UI
- Cost (we needed a price point that would make sense given that we would offer analytics to both paying and non-paying customers)
Eventually, we decided on Looker for our data visualization layer and Snowflake as our database. Looker met all our search criteria and we especially appreciated the flexibility of its data modeling. We were able to get off the ground quickly.
Building and iterating on our data offering
We used the sprint method of software development: we launched a limited, prototype version of the product first. During this proof of concept (PoC), we talked to our users, gathered feedback, and iterated. We were able to go from PoC to first production version in only three months. In order to achieve that speed, we brought all relevant parties together into one single team. Our Wix analytics team included product managers, data developers, front-end developers, back-end developers, mobile developers, analysts, and designers.
Our solution, “Reports by Wix Analytics,” is both versatile and customizable for our wide range of customers. Basic users get access to free ready-made reports, while expert users can access advanced features. The reports give our customers insights into key business areas like sales, traffic, and visitor behavior.
How we introduced Reports to our customers
We wanted our customers to quickly grasp the value being provided in these reports. Aside from highlighting the basic organization of the analytics in our communications, we described the reports through the lens of how our customers could use the data to improve their businesses. Here’s a sample of what we said about the reports:
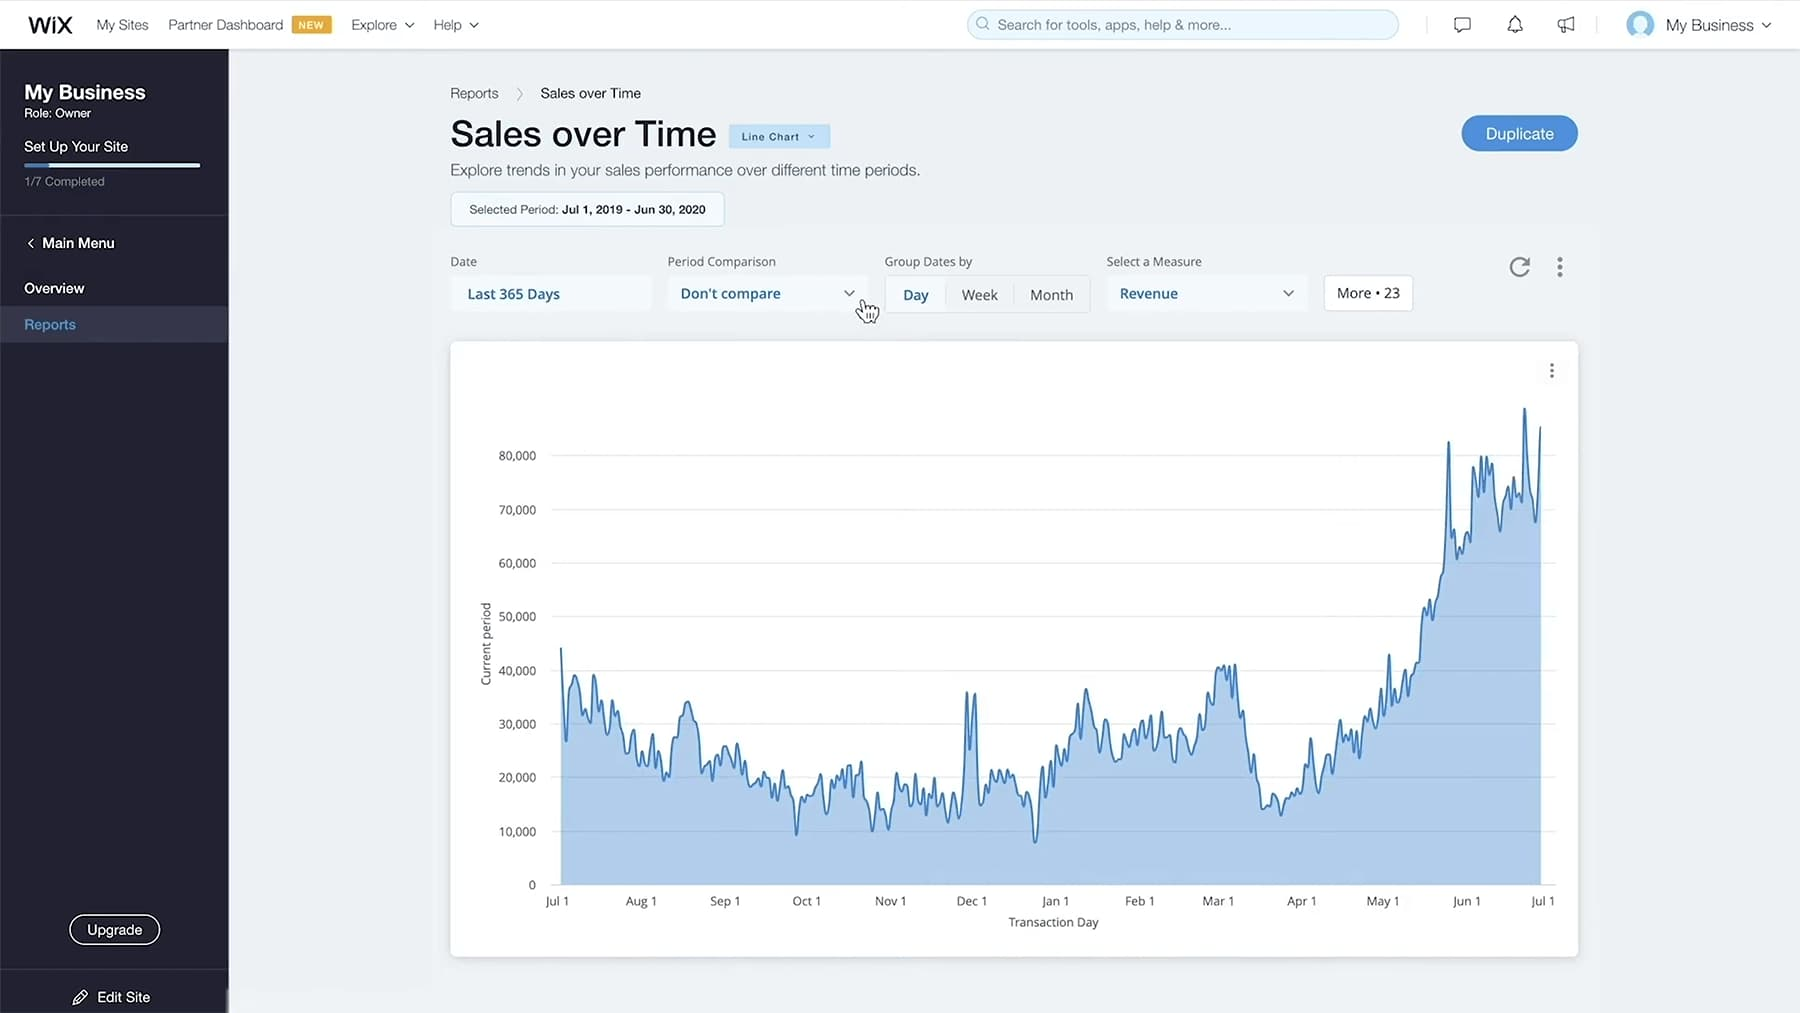
Sales: Get an overview of your sales over time, analyze your business trends, seasonality, and their effects, so you can optimize your strategy accordingly.
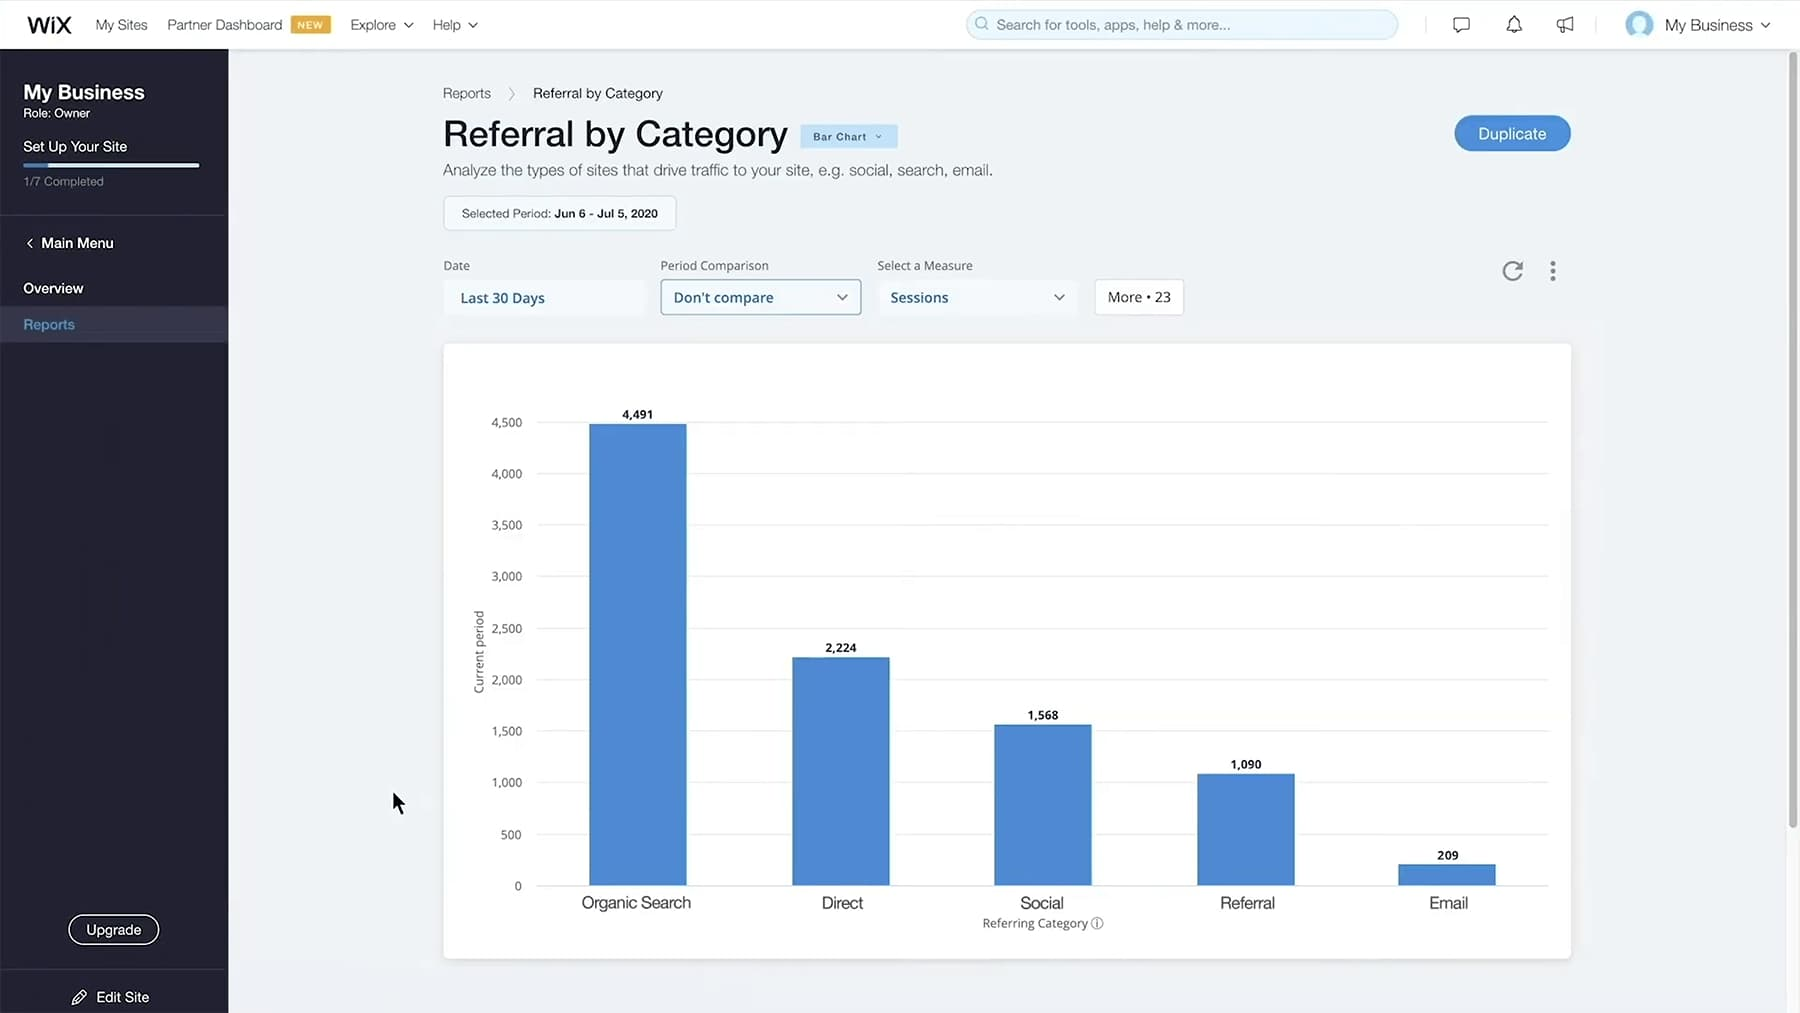
Traffic and behavior: Learn where your website visitors are coming from, which pages they are interested in, and where you lose them.
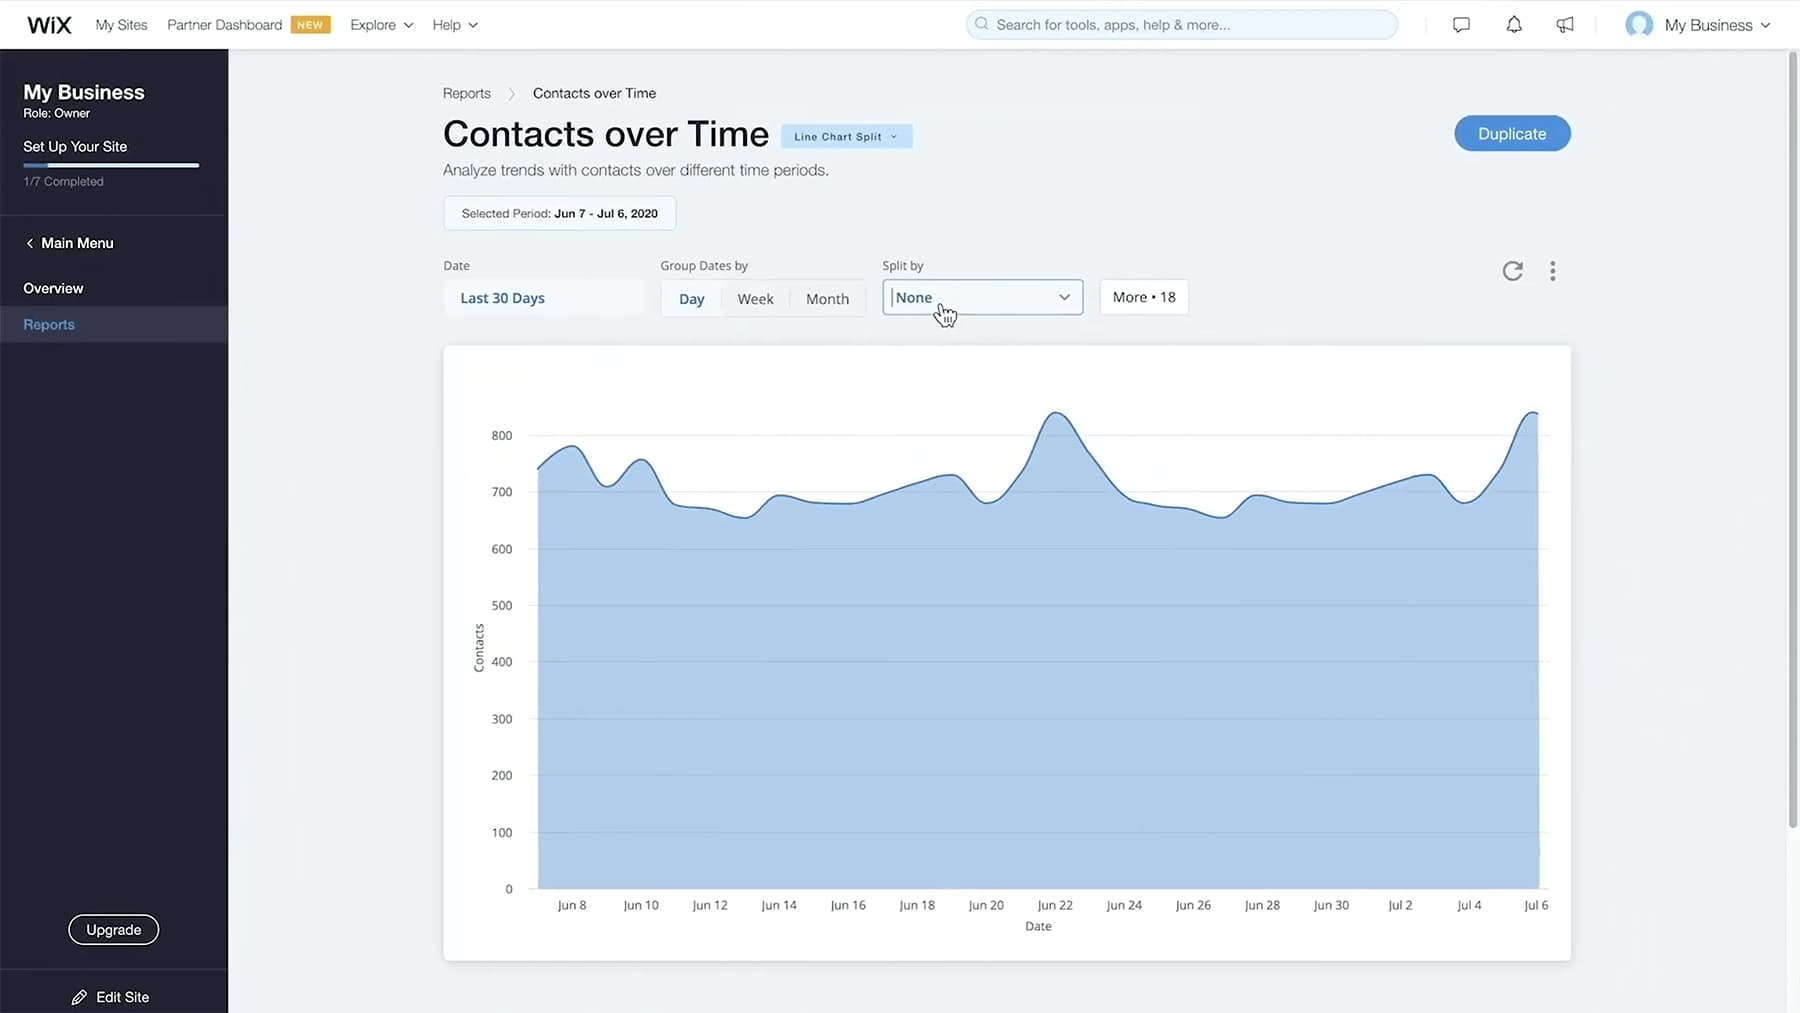
People: Get the full picture of the people coming to your site. See how many people contacted you and who became a registered member. Measure loyalty trends, and find out who your best and top-paying customers are.
Beyond those basics, we explained how to personalize and dive deeper into the data. For instance, customers can choose between line charts, bar charts, tables, and other visualizations. On top of that, the data can be traced back, compared, and filtered. For example, by comparing sales performance year over year, customers can glean insights on which categories perform best during particular months, identify which marketing channels are working for them and which ones are not, and so on.
Since we knew these analytics would aid our customers’ success,we put the reports in a central and dominant place within the Wix dashboard. We know our customers are getting value from this feature. We’ve learned since launching Reports that, from their perspective, this is a product on its own.
Looking to the future
So, what’s next? We’ve got some ambitious plans to take Reports by Wix Analytics to the next level:
- Help our customers find the right insights and take actions that will bring their businesses to the next level. In a sense, we will be hand-holding them through the process of learning how to utilize the data in decisions that drive their business forward.
- Complete the build of our data model. Though we have some useful reports available, there’s an ongoing company-wide effort to gather all of the data from across the different business units at Wix.
- Improve performance. We are working to reduce our load time of Reports from six seconds to three.
- Simplify the UI. We currently use the Looker UI for Reports, which presents a more advanced experience for our users. It’s at the heart of our mission to simplify complicated processes for our customers, and simplifying the Reports UI is no exception. We’ve made major strides towards that goal. We’d like to see our customers creating their own reports within our professional offering level.
We have learned a lot so far, and we feel optimistic about how the Reports feature impacts our mission to help our customers improve their business online.
To learn more, watch my recent session, “Wix Analytics: How Wix Empowers Millions” from JOIN 2020.