Automating data pipelines with BigQuery and Fivetran
Shane Glass
Developer Advocate, Google Cloud
Companies from every industry vertical, including finance, retail, logistics, and others, all share a common horizontal analytics challenge: How do they best understand the market for their products? Solving this problem requires companies to conduct a detailed marketing, sales, and finance analysis to understand their place within the larger market. These analyses are designed to unlock insights in a company's data that can help businesses run more efficiently. They also share a common set of tasks: Collecting a variety of data sources, integrating those into a centralized data platform, and developing analytic capabilities that support the development of reports and dashboards.
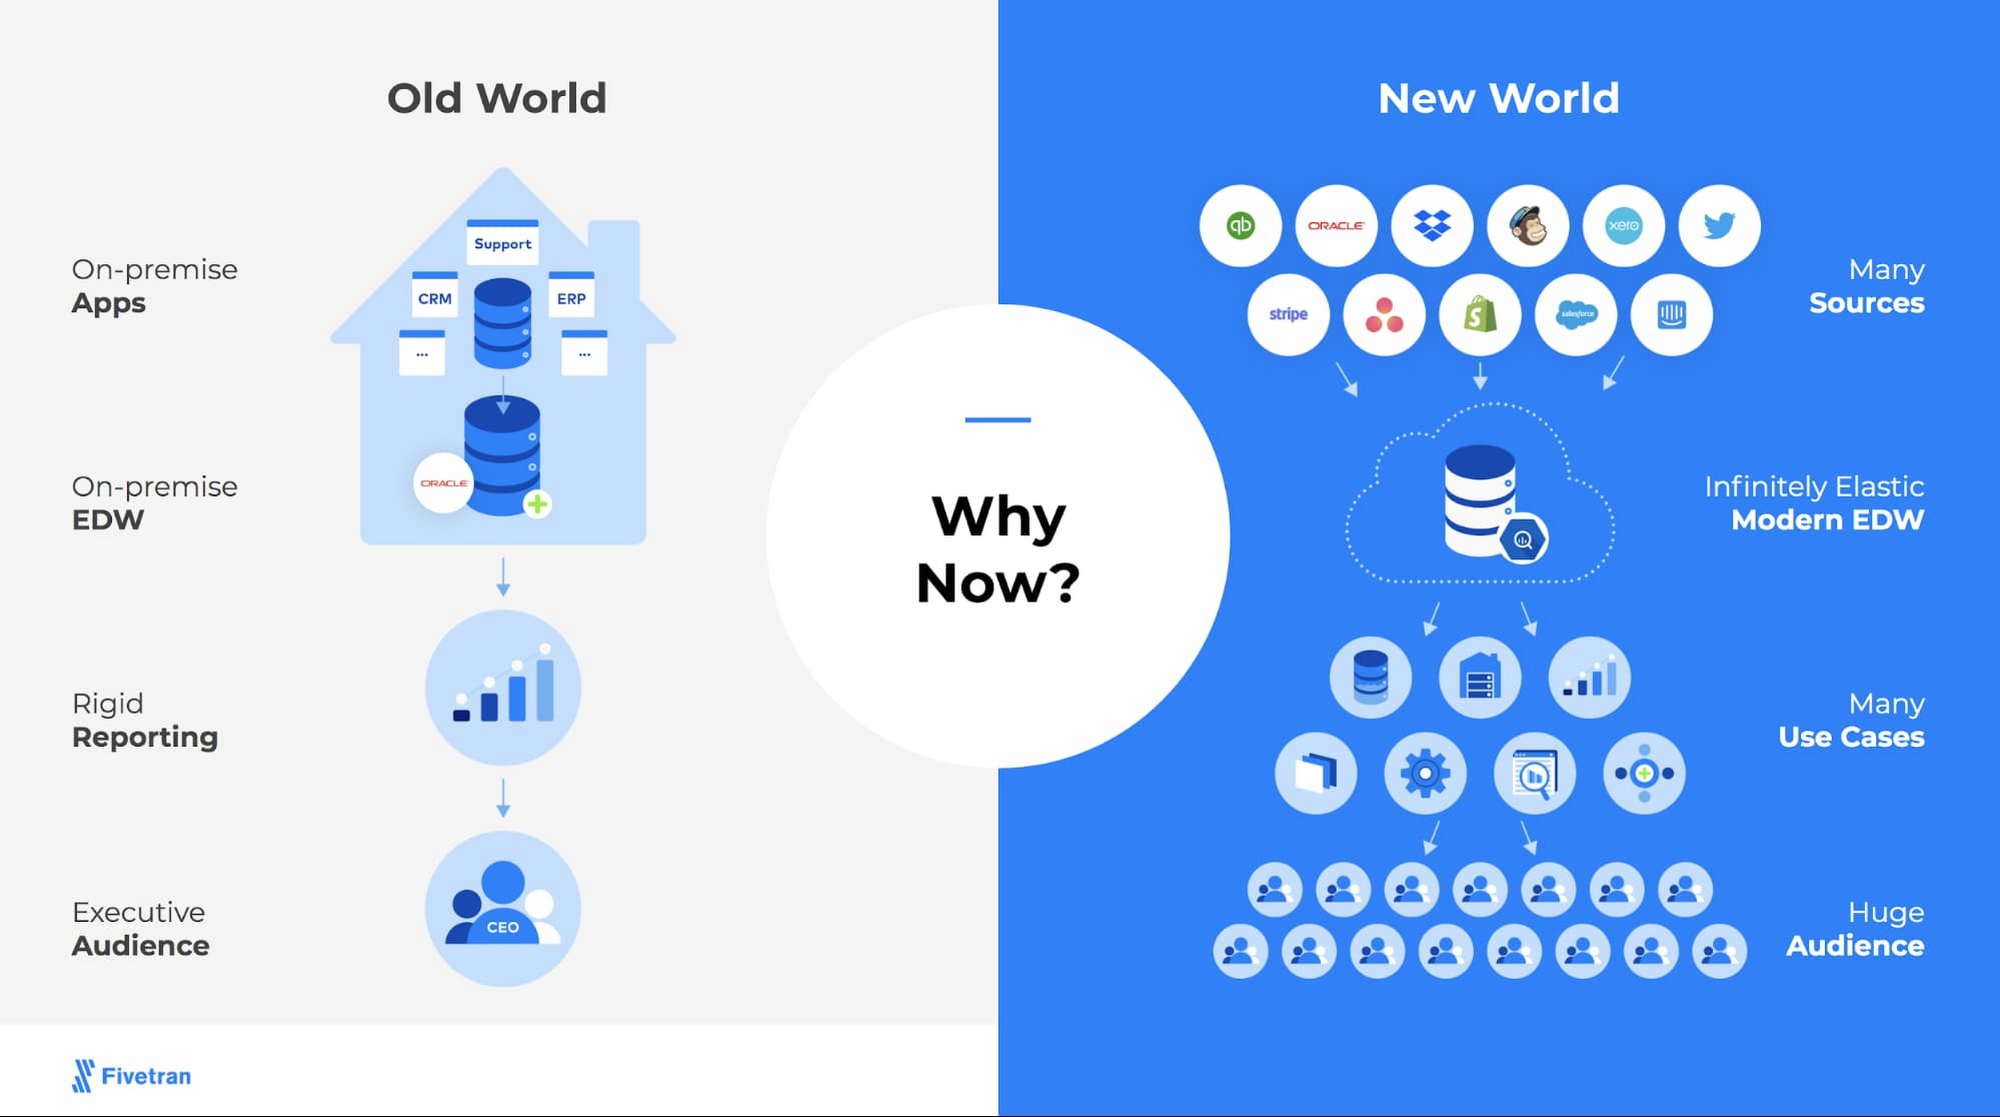
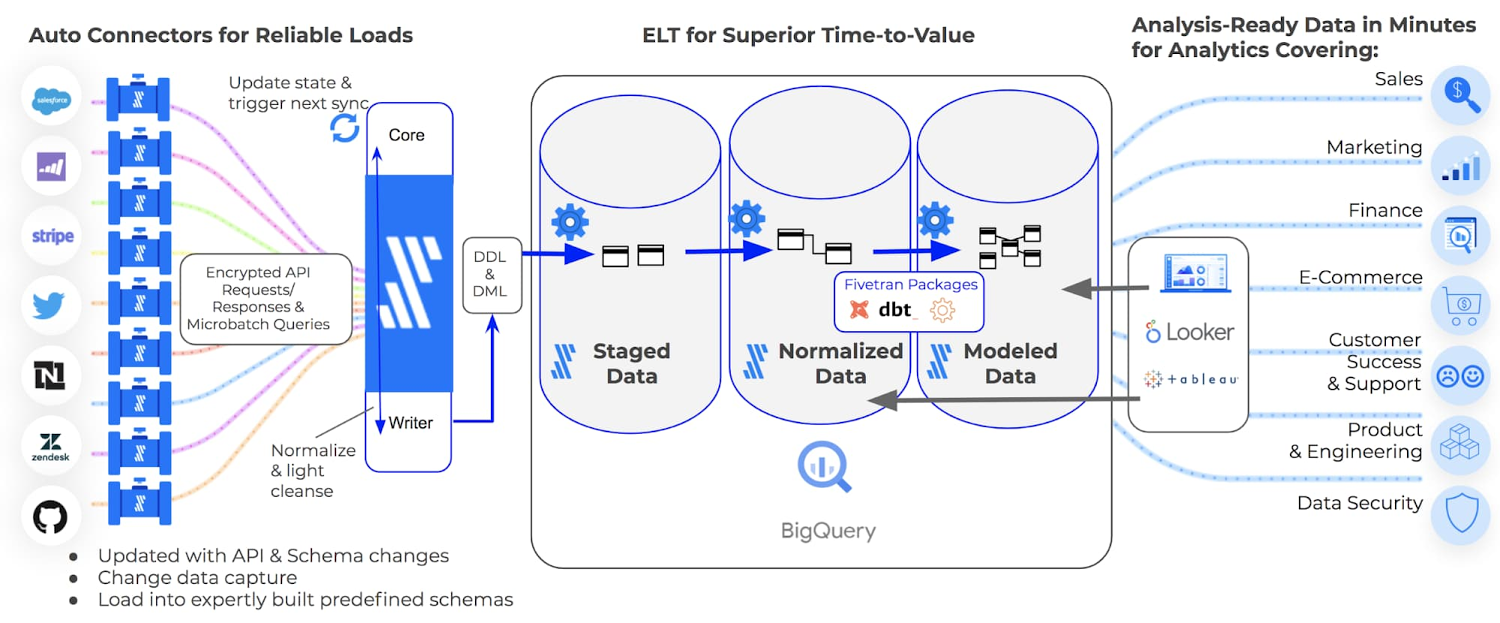
The most common solutions to these challenges require a large suite of tools that each are used to perform a single step of the process, then pass the data along to the next tool. This requires data engineering teams to learn, build, operate, and monitor a data pipeline with a large number of points of potential failure and significantly lengthens the development process. Many customers use Fivetran's automated data integration to solve this challenge—it can reduce complexity by automating many of these processes and help your teams reduce the time to value by enabling earlier analysis. This post shares an example of a customer who is doing exactly that, as well as step-by-step instructions on how to implement something similar in your environment.
Connecting the dots across systems
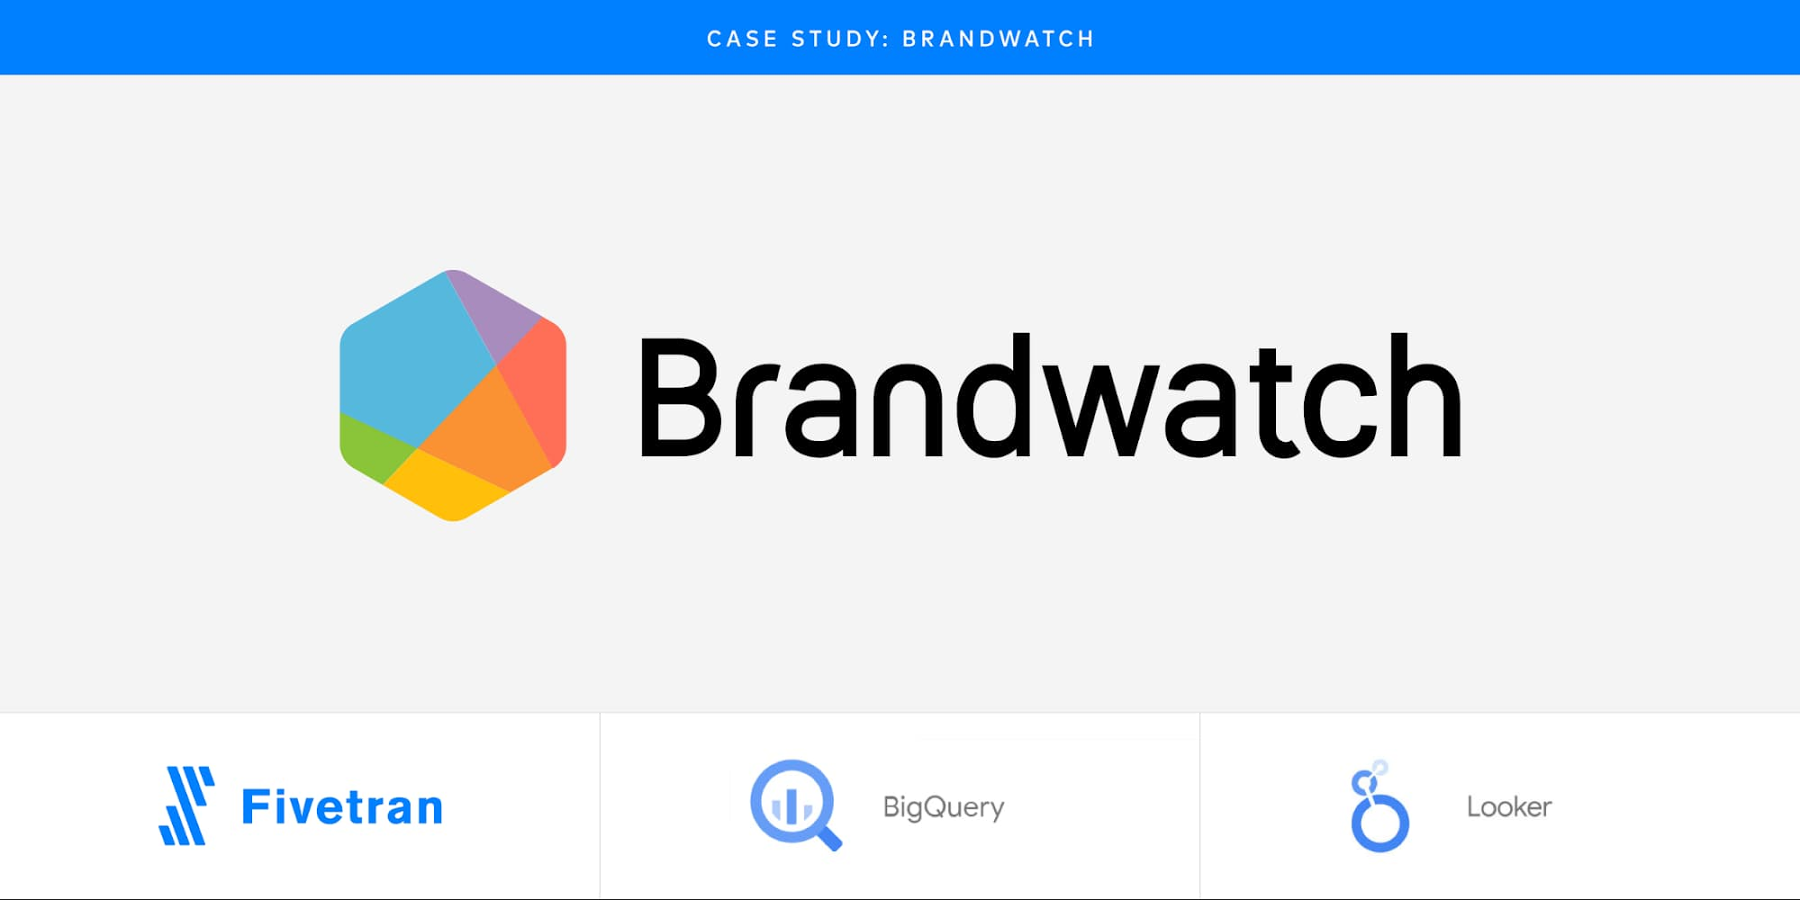
Let’s consider the predictive sales analytics use case of Brandwatch, who wanted to focus on understanding the ties between customer events on their application and their Salesforce data. This type of example has implications that are broadly applicable across other industries and solutions, where the requirements are still focused on centralizing data into a common data platform across a variety of sources such as a customer relationship management (CRM) platform, event data, and other marketing data sources you may have.
In the case of Brandwatch, understanding the ties between their tracked events collected through Mixpanel, a service that helps companies understand how users interact with their products, and how those features impacted sales and accounts required centralizing that information into a single, central data warehouse. The most pressing question from Brandwatch’s product team was simply whether new features were getting adopted. After these initial findings, more options become available to answer tangential questions, such as refining standalone product features to improve customer retention, seeing how previous customer feedback tied into new features, and the result of implementing new features in the sales pipeline.
Traditional challenges in ETL
Traditional approaches to bringing disparate data, such as Brandwatch's CRM and events tracking data, into a centralized data warehouse are typically fraught with a set of challenges. Included among these are the challenges presented by legacy approaches to ETL, which requires us to piece together several tools to form a solution that may or may not scale across the entire business. Additionally, tackling these modern analytics challenges with traditional approaches is a cumbersome process that requires significant investment in infrastructure and skill development. The typical drawbacks to traditional ETL approaches can be summarized as:
Performance: The inherent nature of ETL requires data to be pushed to an intermediate server for transformation prior to being loaded into a data warehouse such as BigQuery This doubles the effort, time, and infrastructure required to move data between products instead of simply loading the data directly from the original sources into the data warehouse. Additionally, ETL server processing is often slower and more costly since each row is typically transformed individually within ETL engines, instead of doing so as a set in a cloud data warehouse.
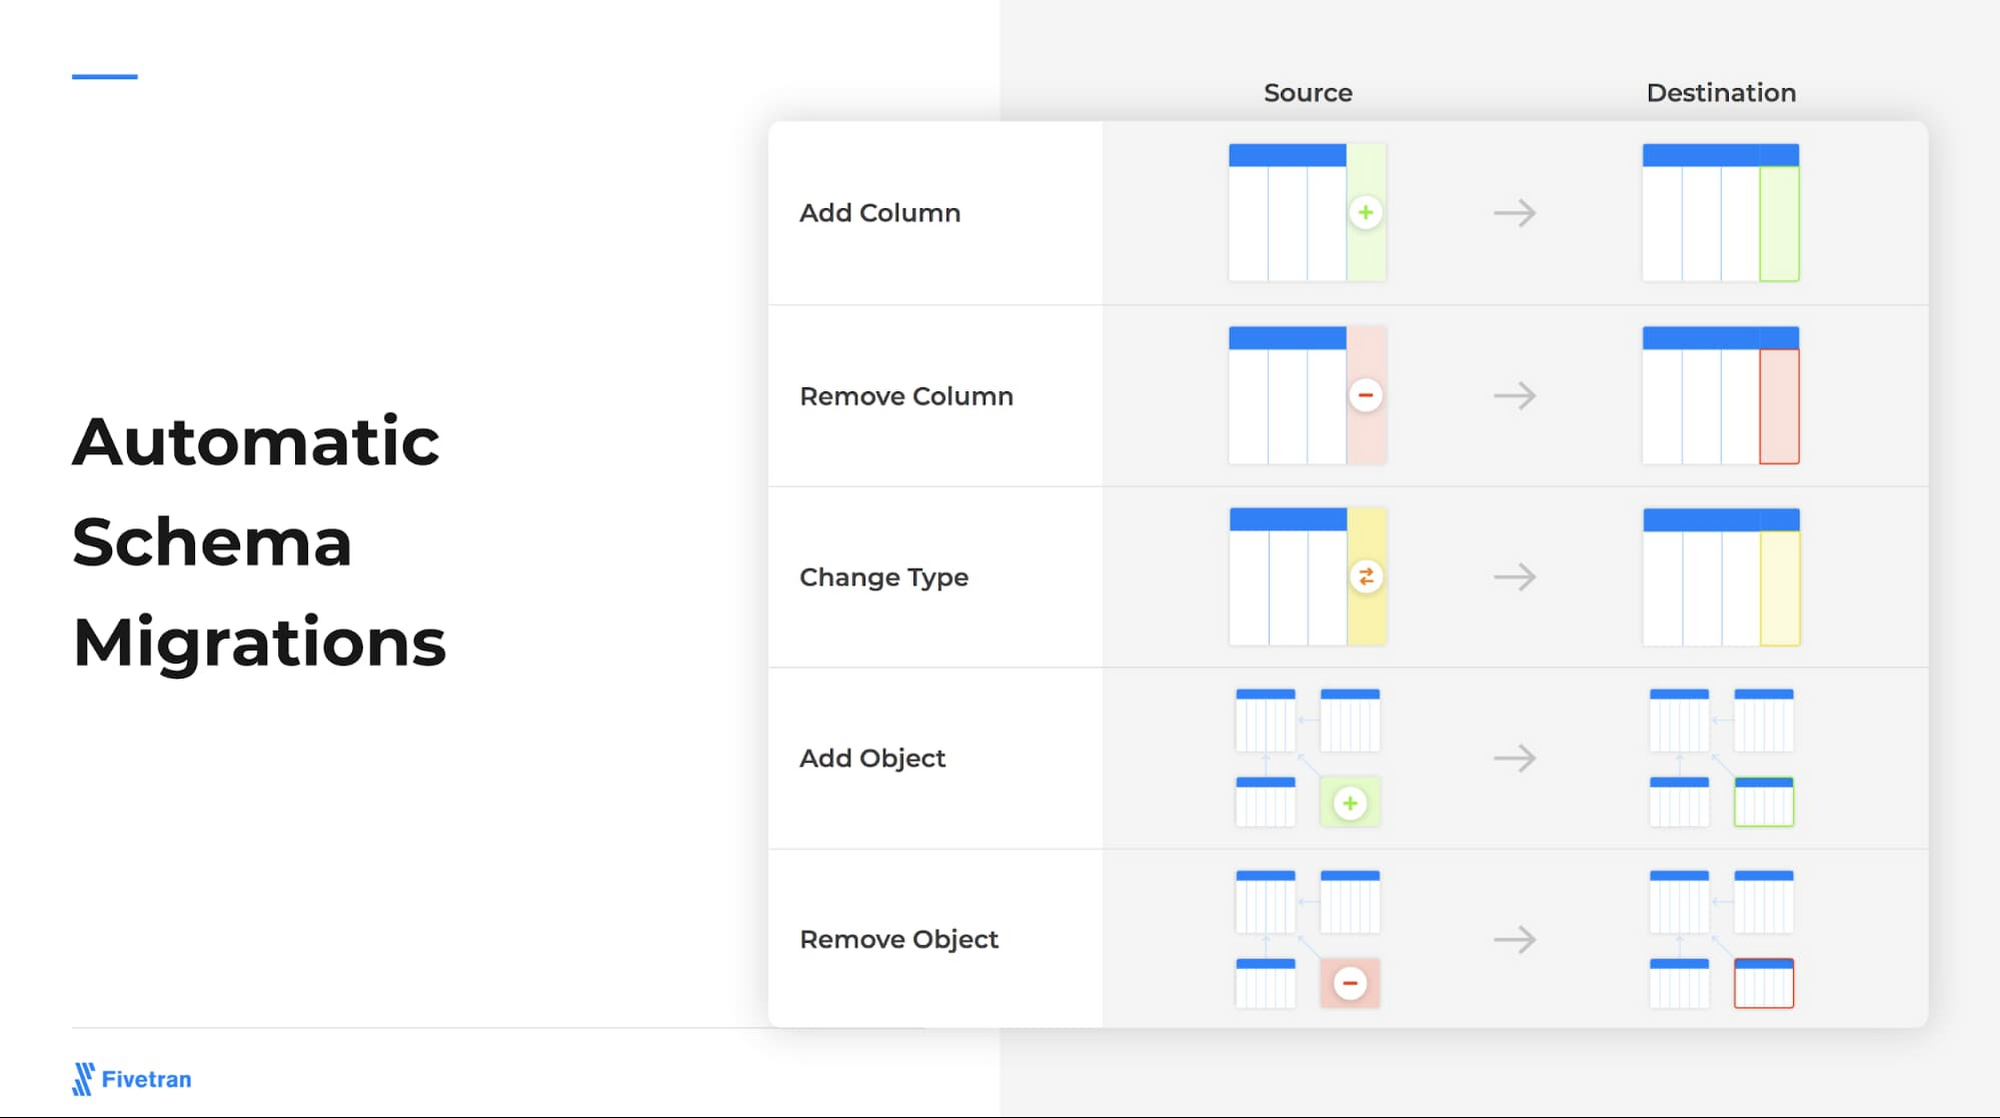
Maintenance: Maintenance of these pipelines requires intensive effort as different tools are typically required for each step in the process, creating several points of potential failure, each with different dependencies. Data ingestion pipelines are typically designed to be updated no more than a few times per year as a result. However, the continuous evolution of modern systems where source APIs and schemas change multiple times per week means that traditional approaches can't always keep up.
Brandwatch’s initial approach of stitching together different downloaded CSVs was more manual in nature, which introduces a new set of challenges, including increased likelihood for human error. While this may work for ad hoc reporting, an automated solution developed in-house to address this would have required a massive investment of time to develop and maintain this architecture while adding unnecessary complication and risk to the process. This work and hassle distracts data teams from focusing on our most important objective: Get value from the data.
A modern approach to ETL
After considering the challenges that come with a traditional approach to ETL, Brandwatch determined their needs are best met by deploying a modern data stack to develop their analytics solution that doesn't come with these challenges. Their requirements include an ETL pipeline that will reliably ingest data from cloud applications and services producing massive volumes of data in disparate formats and structures while minimizing their maintenance costs so they can maximize their value.
Such a proper modern data stack for this analysis consists of:
A serverless, cloud data warehouse like Google BigQuery that broadly scales to handle all of Brandwatch’s workloads without requiring their development team to maintain the underlying infrastructure. Ideally, this would separate the compute and storage to allow Brandwatch to minimize their costs for both.
A collaborative SaaS BI and analytics platform, like Looker, that allows them to take advantage of LookML's ability to provide all of their teams a common definition of their metrics to enable the most accurate analysis possible across the entire business.
SaaS Data Integration like Fivetran that takes care of multiple steps in the ELT and automated data ingestion. This tool would empower them to optimize their data strategy to bring in all relevant objects quickly and easily instead of requiring them to adapt their queries to work with limited datasets.
The Analytics Bottleneck: Data Ingestion
Successful analytics projects require a range of skills from various teams, including data analytics, data engineering, software engineering, and others. However, all of these teams have a common blocker that consumes their limited time: Reliability ingesting quality data that is ready for analysis.
The reality of traditional ETL tooling is that data analysts are forced to wait for data engineers to build and update data pipelines. Using an ELT approach, instead of ETL, unblocks data analysts from relying on data engineers to develop the necessary pipelines, and frees up the time of data engineers to focus on higher priority projects. ELT pipelines are usually more easily configurable and more fault/failure tolerant, which helps reduce the complexity of data pipelines and reduces the time burden of development.
Predictive Sales Analytics in Action for Salesforce Data
Data Extraction
Here are the steps that you could take to emulate Brandwatch’s setup to implement Fivetran and BigQuery together. We will presume BigQuery is already set up.
To get your Fivetran instance up and running:
1. Setup Google Data Transfer Service: Go to Google DTS and create a Transfer for “Salesforce by Fivetran”
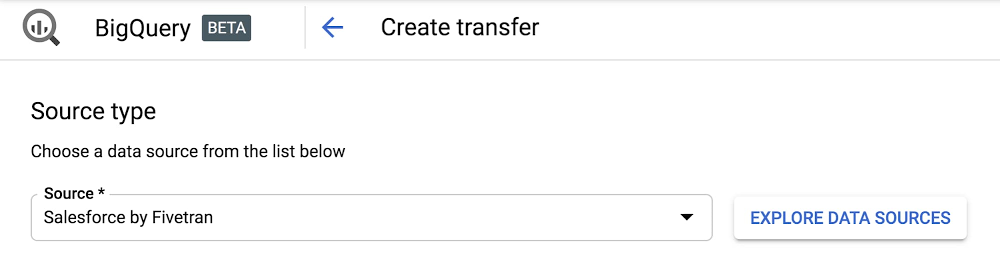
Setting up Fivetran through Google Data Transfer Service (DTS) to integrate your sales analytics data into BigQuery can be done in minutes and also transfers historical sales data to give you a full view of your business.
2. Configure your connection: Configure your destination settings, including:
Desired schema name and dataset ID
Choosing your update frequency.
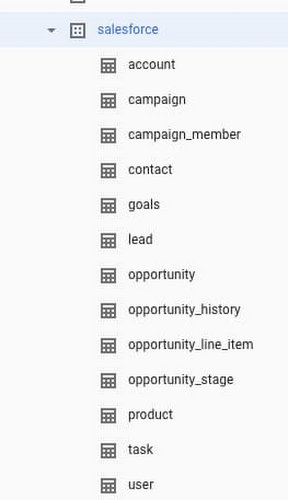
3. Authorize: Authenticate and authorize your Salesforce account and select either "all tables" or only those requiring regular updates. The most commonly selected tables include: Opportunity, Account, Contact, User, User Role, and any custom tables that are of note for your Salesforce analytics.
4. Sync your data: After authorizing your data source, you’ll receive an email notification alerting you to your new Fivetran account that has been created. You can use the Fivetran platform to do things like add new connectors or monitor your sync for completion. You’ll receive an email alert once your historical sync has been completed!
Data Preparation
Brandwatch's data preparation efforts can be replicated using several different tools. These include:
1. Fivetran's dbt Package for Salesforce: Install the Fivetran dbt Package for Salesforce using the instructions available here. This makes use of Fivetran’s ability to pull relevant tables from Salesforce, whether custom or standard, and create reporting tables that show:
Account owner and their related managers’ pipeline health, opportunities and their funnel stages, and win-loss metrics
Opportunities enhanced with related account and owner information
An overall view of sales health, including pipeline metrics, bookings
Users favoring open source technologies and prefer SQL as their data manipulation tool of choice will want to try out dbt first. Our package makes it easy to see how you can structure your transformations and helps you get started with your Salesforce dashboards.
2. Cloud Dataprep by Trifacta: Dataprep is an intelligent data service for visually exploring, cleaning, and preparing data for analysis, reporting, and machine learning. Its serverless architecture scales as needed without the added complication of managing the underlying infrastructure that comes with traditional ETL pipelines. This is especially useful if you have unique or custom transformations that you need to perform after the data has landed in BigQuery.
If you prefer a more guided tool with a visual interface for complex transformations, but aren’t looking to host servers yourself, you can try out Dataprep.
3. BigQuery: BigQuery's serverless, highly-scalable architecture enables you to query PBs of data with blazing fast speed. This means that data can be transformed after load instead of requiring it to be done as is most common in traditional ETL pipelines that load data into on-premises data warehouses that aren't capable of executing large queries as quickly.
Another option is to always start with running your transformations directly in BigQuery itself with SQL. From here, if you do find that you need a tool to help manage your transformations or orchestrate more complex ones, you can try going to one of the other tools mentioned above.
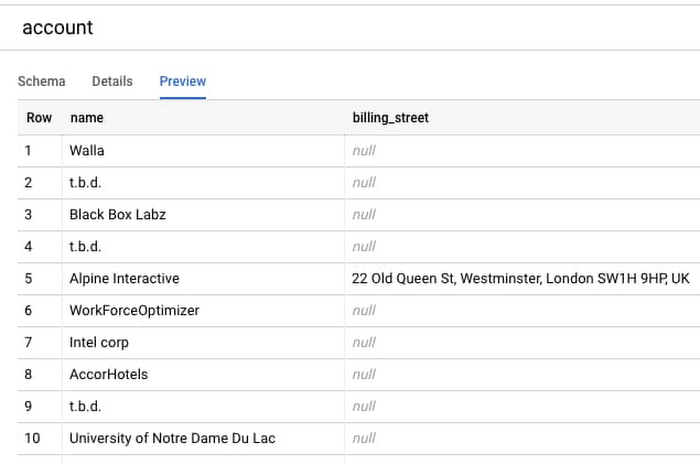
After preparing your data, you can start querying your data straight away, with an example of how that dataset would look in BigQuery below.
Unlocking a range of data analytics capabilities
This allows your teams to unlock an entire ecosystem of opportunities to extract additional value from your data much more quickly, allowing you to extract new information and insights from within your data that were previously hidden. Fivetran's pipeline into BigQuery enables you to:
Enrich with BigQuery Public Datasets: The Cloud Public Datasets Program hosts more than 150 public datasets in BigQuery that you can access at no cost and join with your existing data. These datasets, such as the Census Bureau's American Community Survey with incredibly detailed demographic data across the US updated annually and NOAA's Global Historical Climatology Network that details daily weather observations at thousands of weather stations around the world with historical data as far back as 1763, can help you discover new information in your data that was previously unseen. Check out the full catalog of public datasets to see how you can uncover new insights in your existing data without leaving BigQuery.
Build a full data experience with Looker: Looker's dashboards empower you to see the high-level trends of your data and drill-down into individual observations quickly and easily to help democratize data-driven decision making. These are built on the foundation of LookML to ingest sales data from BigQuery to provide the most critical information for business stakeholders. After defining a standard, scalable schema across your data, the integrated metric data can be explored in a variety of ways, which helps decision makers quickly understand the trends in their data. Check out this blog post to learn more about how your data teams benefit from using LookML.
Develop BigQuery ML Models: BigQuery ML lets you create and execute machine learning models in BigQuery using standard SQL queries. It helps democratize machine learning by letting SQL practitioners build models using existing SQL tools and skills, while increasing development speed by eliminating the need to move data.
Summary
Brandwatch was able to experience a wide range of benefits by opting for a modern data ingestion stack. These include:
Increased deal velocity by leveraging product features popular with customers
Higher user engagement and retention by refining the product to align with the user journey
Faster time to value for analytics, so decisions based on data can be made faster
Fostering a data-driven culture, which has resulted in better business decisions across the board
Similarly, if you are looking to answer some of the same questions, you might also benefit from:
Better visibility for all teams reporting off a centralized data source
Higher ROI across the entire stack by integrating data to make the most of each individual tool
Less maintenance time on pipelines resulting in more time for data teams to focus on predictive analytics
You can learn more about the Brandwatch use case for a modern ELT pipeline by reading the full Brandwatch case study from Google Cloud. Try Fivetran for BigQuery via Google DTS today with a 14-day free trial. To learn more about using Fivetran to unlock business intelligence in BigQuery and Looker, review the documentation available here or visit the Fivetran for BigQuery resources page. You can also check out the recent Fivetran webinar that describes how BigQuery, Dataprep, and Fivetran can be used together to reduce the burden of data ingestion.