Setting resource requests: the key to Kubernetes cost optimization
Ameenah Burhan
Solutions Architect
Anthony Bushong
Developer Relations Engineer
This is the first installment of a seven-part series covering the key findings from the State of Kubernetes Cost Optimization, a quantitative research report analyzing the cost efficiency of real-world, large-scale, anonymized Kubernetes clusters.
Workload requests are used everywhere in Kubernetes, from scheduling to scaling up and scaling down the cluster, to workload quality of service, to cost allocation, and more.
It should be no surprise that getting these right is at the heart of building a cost optimized Kubernetes cluster. It is also the first key finding of the State of Kubernetes Cost Optimization report:
Kubernetes cost optimization starts with understanding the importance of setting appropriate resource requests
Mismanagement of requests can disrupt applications, having a cascading negative impact on your application’s reliability. Let's review one actionable strategy to help you master this fundamental aspect of Kubernetes cost optimization.
Not setting requests properly can put workloads at risk
In the report, the “At Risk” segment consists of clusters where the sum of actual resource utilization is generally higher than the sum of their workloads' requested resources. This results in a higher risk of intermittent and hard to debug reliability issues caused by Node-pressure eviction.
Node-pressure eviction occurs when resources like memory, reach a capacity threshold on a node. This pressure state activates the Kubernetes kubelet to start reclaiming resources by abruptly terminating pods. The priority for killing pods is given to those that are using the most resources compared to what they have requested.
However, BestEffort Pods, which do not explicitly request any resources, have a high chance of being the first to be terminated due to their lack of specific requirements. If the kubelet cannot kill workloads fast enough, the Linux oom_killer - or "out of memory killer" - can also step in and kill containers. This process also accounts for prioritizing in part based on QoS class.
Workloads with a QoS class of BestEffort, and workloads with a QoS class of Burstable with memory under-provisioned can be the first to be terminated. Errors which could be related to this termination, such as OOMKilled, ContainerStatusUnknown, Error, and Evicted, can make troubleshooting difficult.
This is where viewing observability metrics can be particularly useful. For this reason, the report recommends that requests be properly set for critical workloads:
Avoid using BestEffort Pods for workloads that require a minimum level of reliability.
So how can we take action? Auditing clusters for workloads at risk can be difficult - especially if it is shared by multiple teams.
Introducing the GKE Workloads at Risk dashboard
That is why we are excited to introduce the GKE Workloads At Risk dashboard, a template in Cloud Monitoring that you can use to monitor BestEffort and Burstable workloads at risk for performance or reliability issues.
You can also manually navigate to the dashboard by:
In the Google Cloud console, select Monitoring. You can also navigate directly to Cloud Monitoring using the following link.
In the navigation pane, select Dashboards.
In the Sample Library pane, select Google Kubernetes Engine.
Click the Preview button next to the GKE Workload At Risk from the list of dashboards
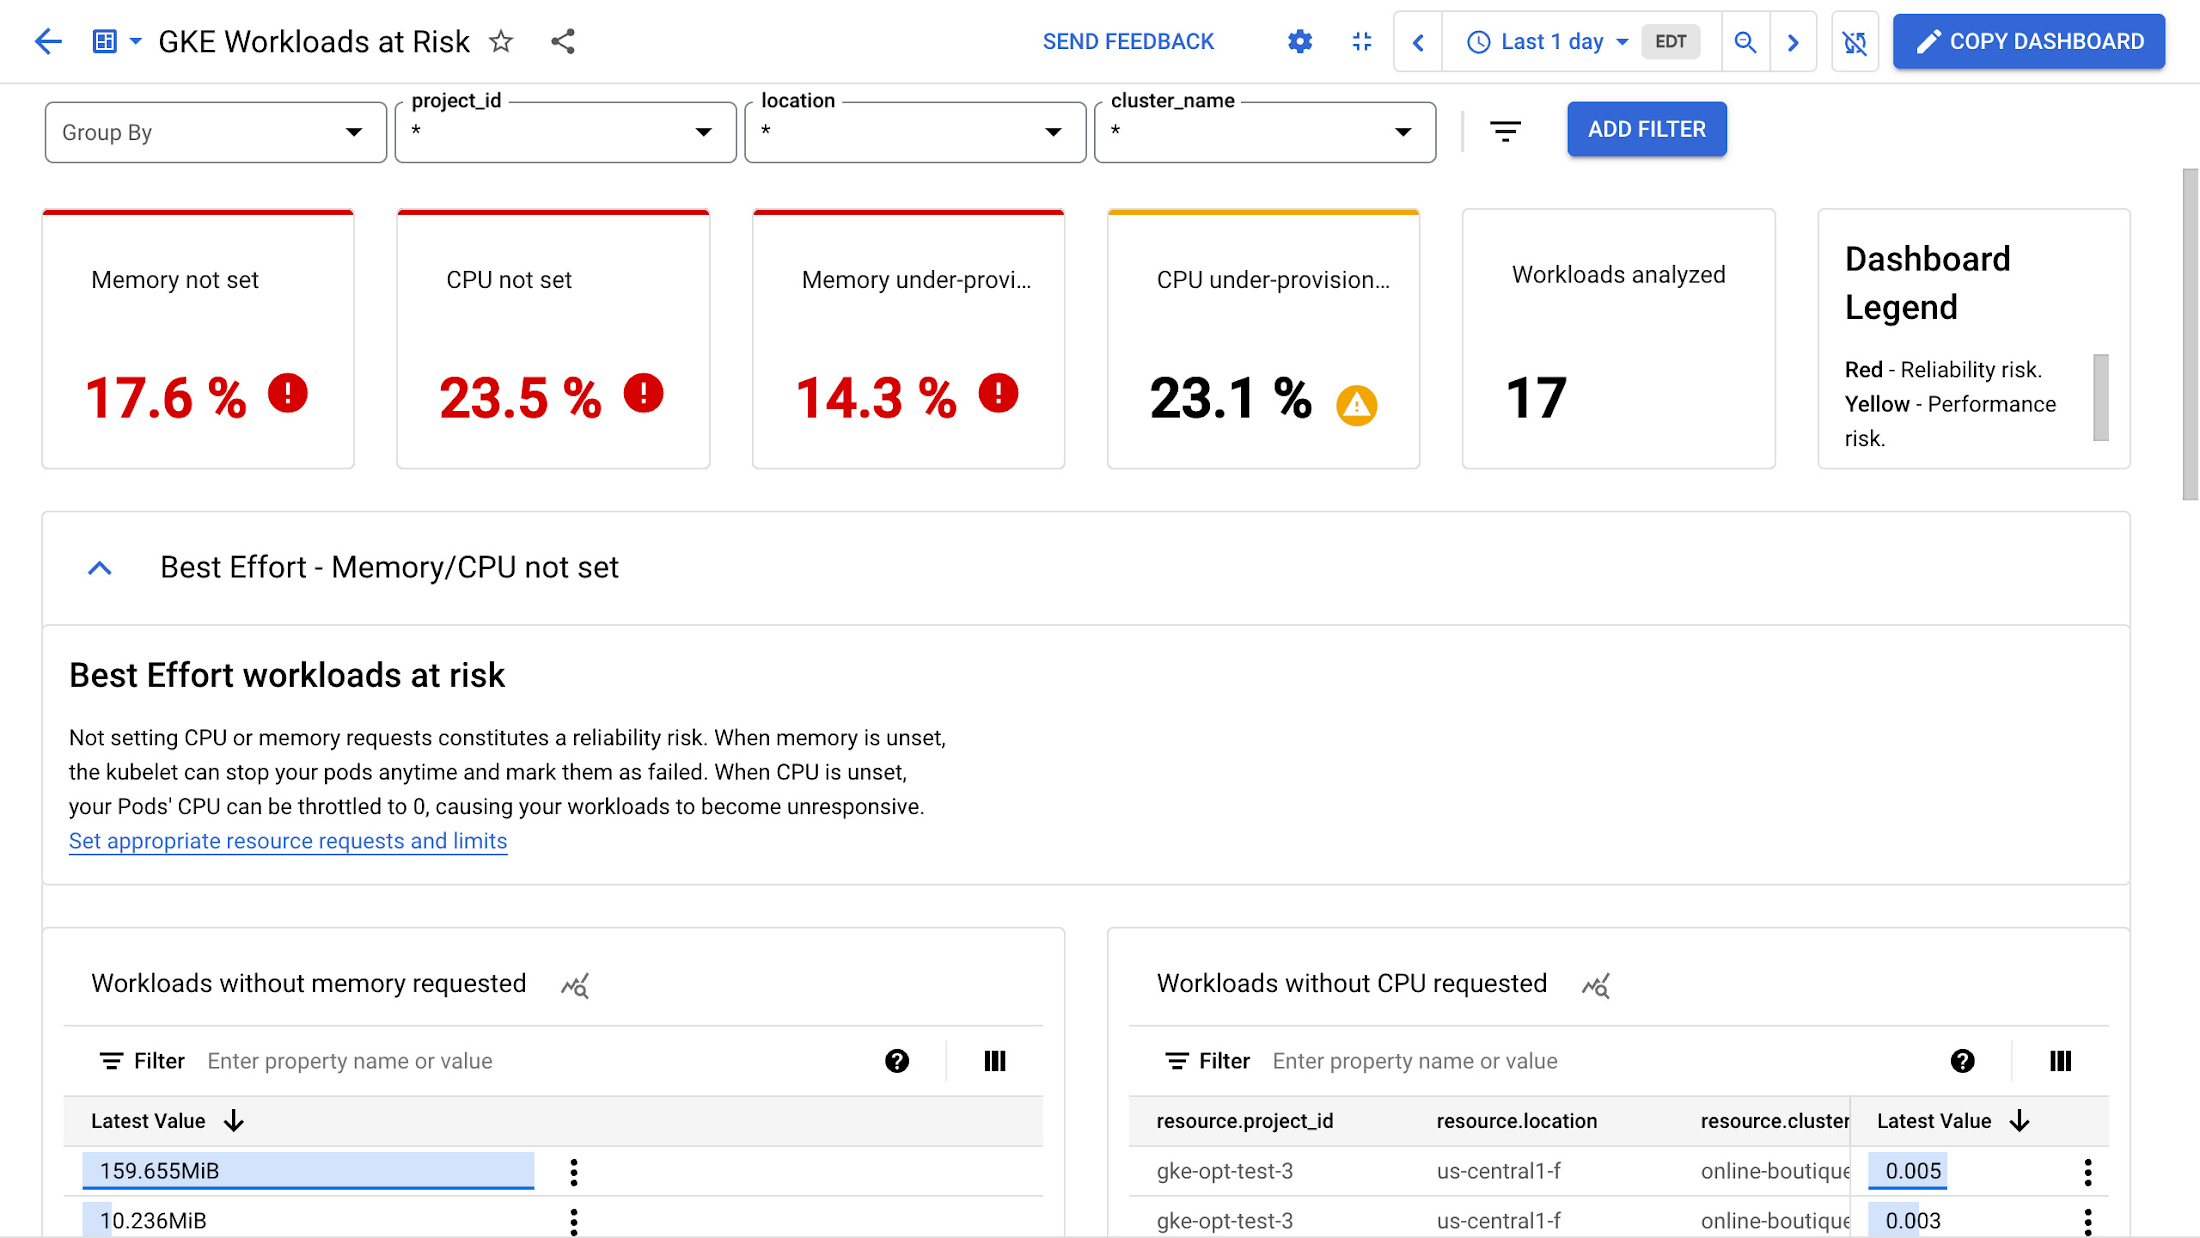
The "Best Effort Workloads at Risk" section shows workloads that do not have defined CPU or memory requests. If the memory request is undefined, your Pods may be evicted at any time and marked as failed. Similarly, if the CPU request is undefined, your workloads may become unresponsive as the CPU may be throttled to 0.
To avoid this, you should define CPU and memory requests for your workloads. This will ensure your workloads have the resources they need to run properly.

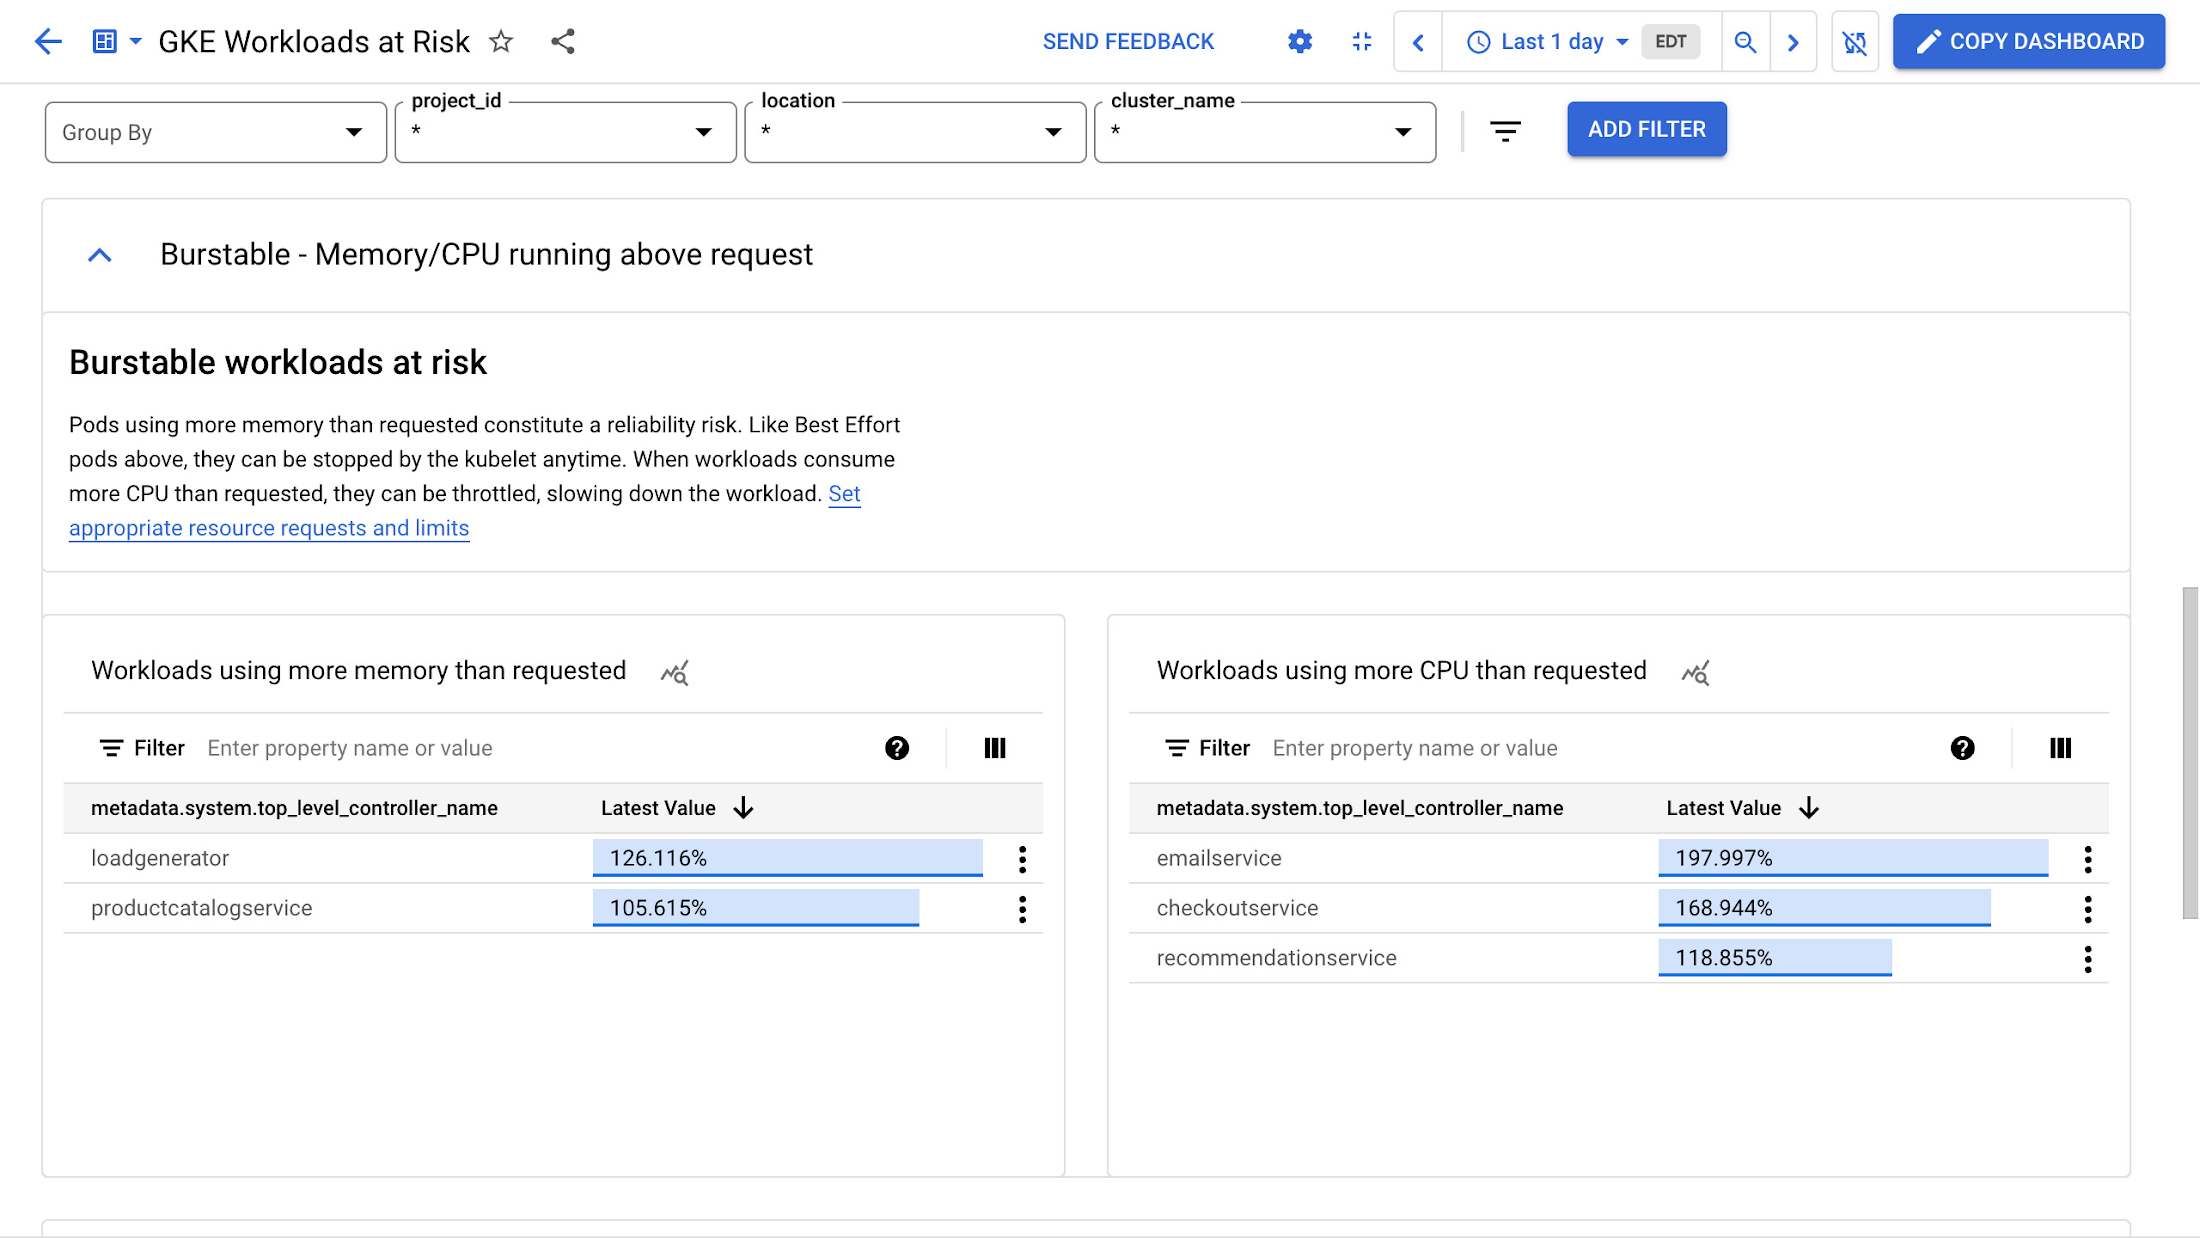
The "Burstable Workloads at Risk" section shows Pods that are using more memory and CPU than they requested. This can cause reliability issues if there is not enough memory available. These Pods, like the BestEffort Pods mentioned earlier, may be killed. Workloads that consume more CPU than requested may be throttled, resulting in poor performance that could be experienced by the end users of your workloads.

Identifying workloads at risk across your entire fleet
For organizations running multiple GKE clusters across multiple projects, we’ve developed a comprehensive and robust solution built atop BigQuery and Looker Studio.
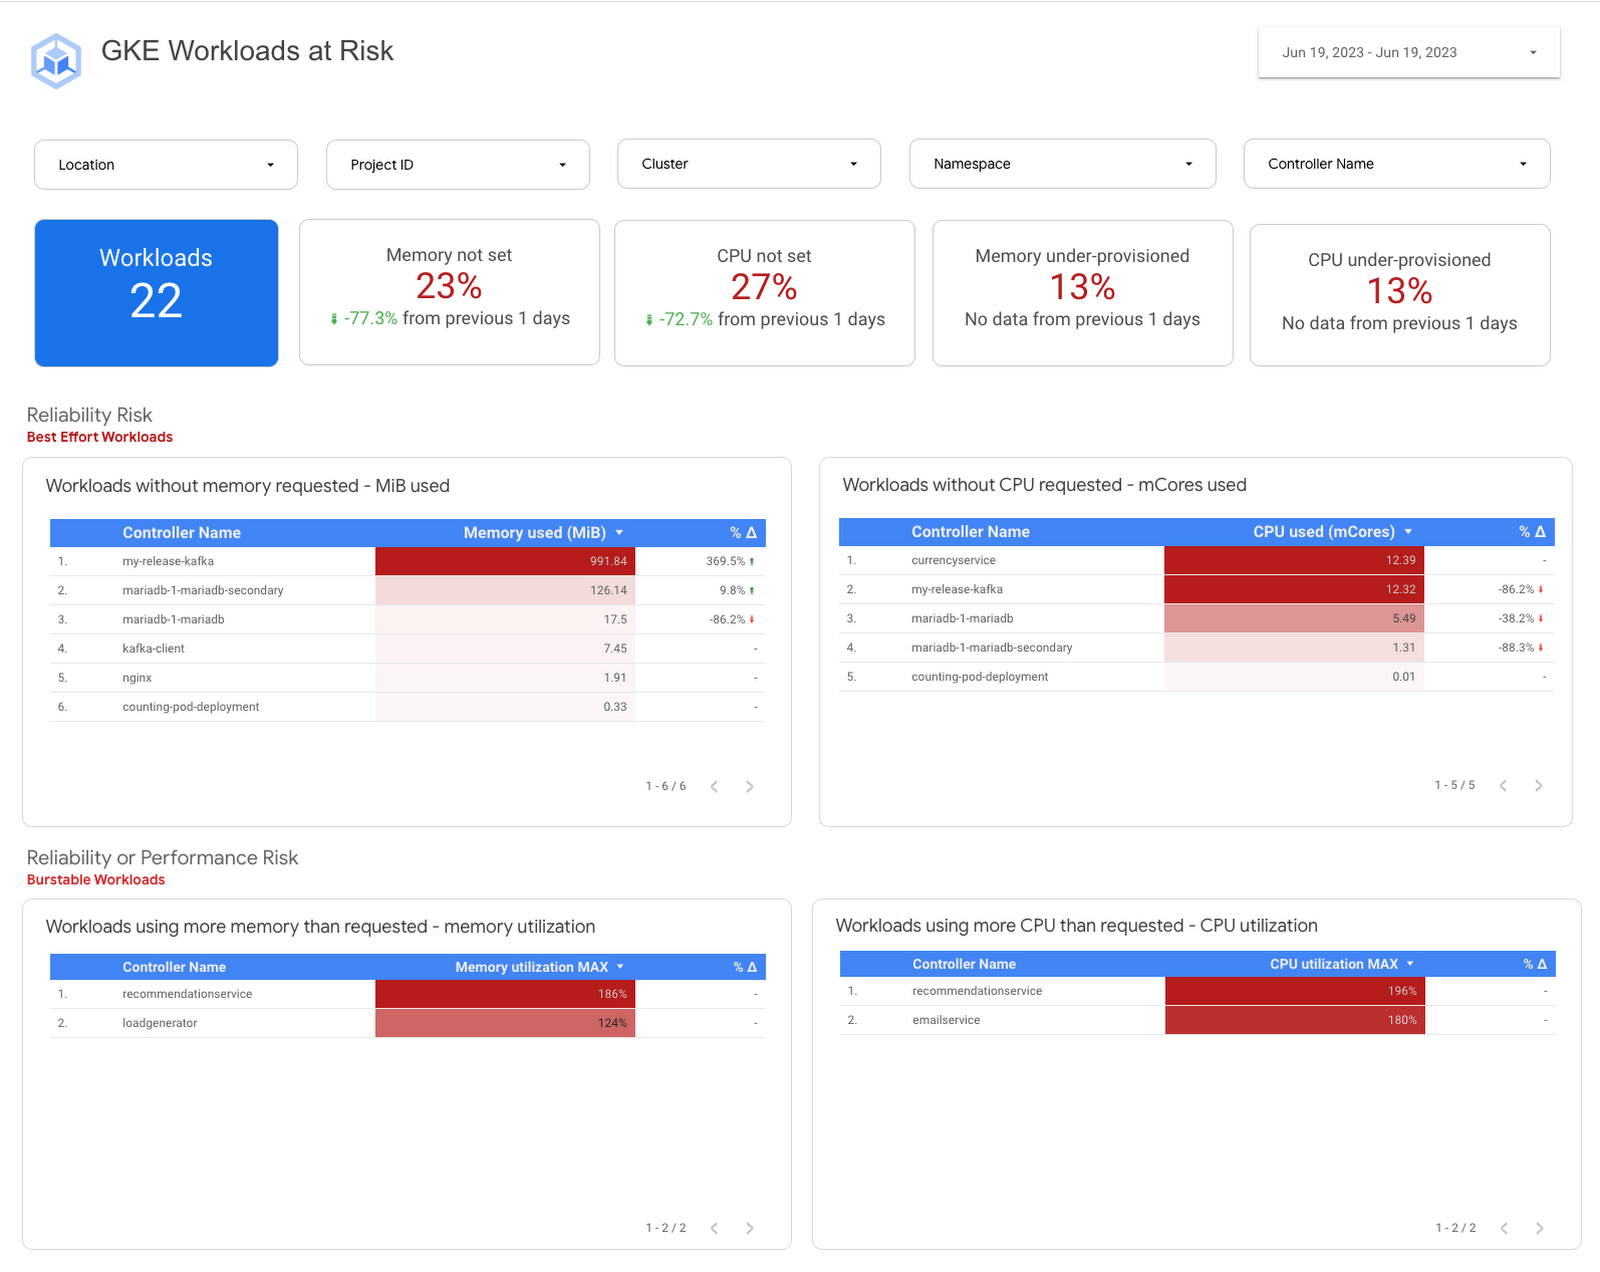

This solution harnesses the power of BigQuery to deliver swift insights across clusters and projects. It helps identify at-risk workloads while also providing recommendations, allowing you to monitor your progress with a historical perspective. You can also customize it for specific needs to realize consistent improvements.
To deploy this enhanced and customizable solution today, please follow this solution guide.
If you have Kubernetes clusters running elsewhere
The fundamental goal is to identify workloads that may be at risk due to how requests are – or aren't – configured. If you're looking for a lightweight method that works across any Kubernetes cluster, you can evaluate kube-requests-checker, a simple script that lists all user containers without requests for CPU, Memory, or both, in a given cluster.
You can also access an individual workload's quality of service class by running the following kubectl command.
In conclusion
With these tools, platform teams and application developers can put the first key finding of the State of Cost Optimization report into practice. This means working together to set requests for workloads that have any reliability requirements and building this into your culture.
You can find the resources discussed in this blog, along with a tutorial to set up example workloads in GKE, below:
The GKE Workloads at Risk dashboard template
The Right-sizing workloads at scale solution guide
The simple kube-requests-checker tool
An interactive tutorial to get set up in GKE with a set of sample workloads
Download the State of Kubernetes Optimization report, review the key findings, and stay tuned for our next blog post!
