Security insights from Chrome browser delivered with Splunk
Fletcher Oliver
Chrome Enterprise Customer Engineer
Security insights from Chrome browser delivered with Splunk
Two weeks ago, we announced the Chrome Enterprise Connectors Framework, enabling plug-and-play integrations with industry-leading security solutions and platforms. Together with our security partners, this new framework will help organizations work toward a Zero Trust model to keep their corporate data and users secure.
Enrolling machines in Chrome Browser Cloud Management
Getting started is easy. The first step is to make sure Chrome Browser Cloud Management is set up for your organization. This tool helps manage Chrome browser from a single, cloud-based Admin console, across Windows, Mac, Linux, and mobile devices at no additional cost. Setting up is simple. Check out this guide for steps on how to enroll your devices.
Once you have your machines enrolled in Chrome Browser Cloud management, you can easily set up the Splunk integration.
Setup in Splunk
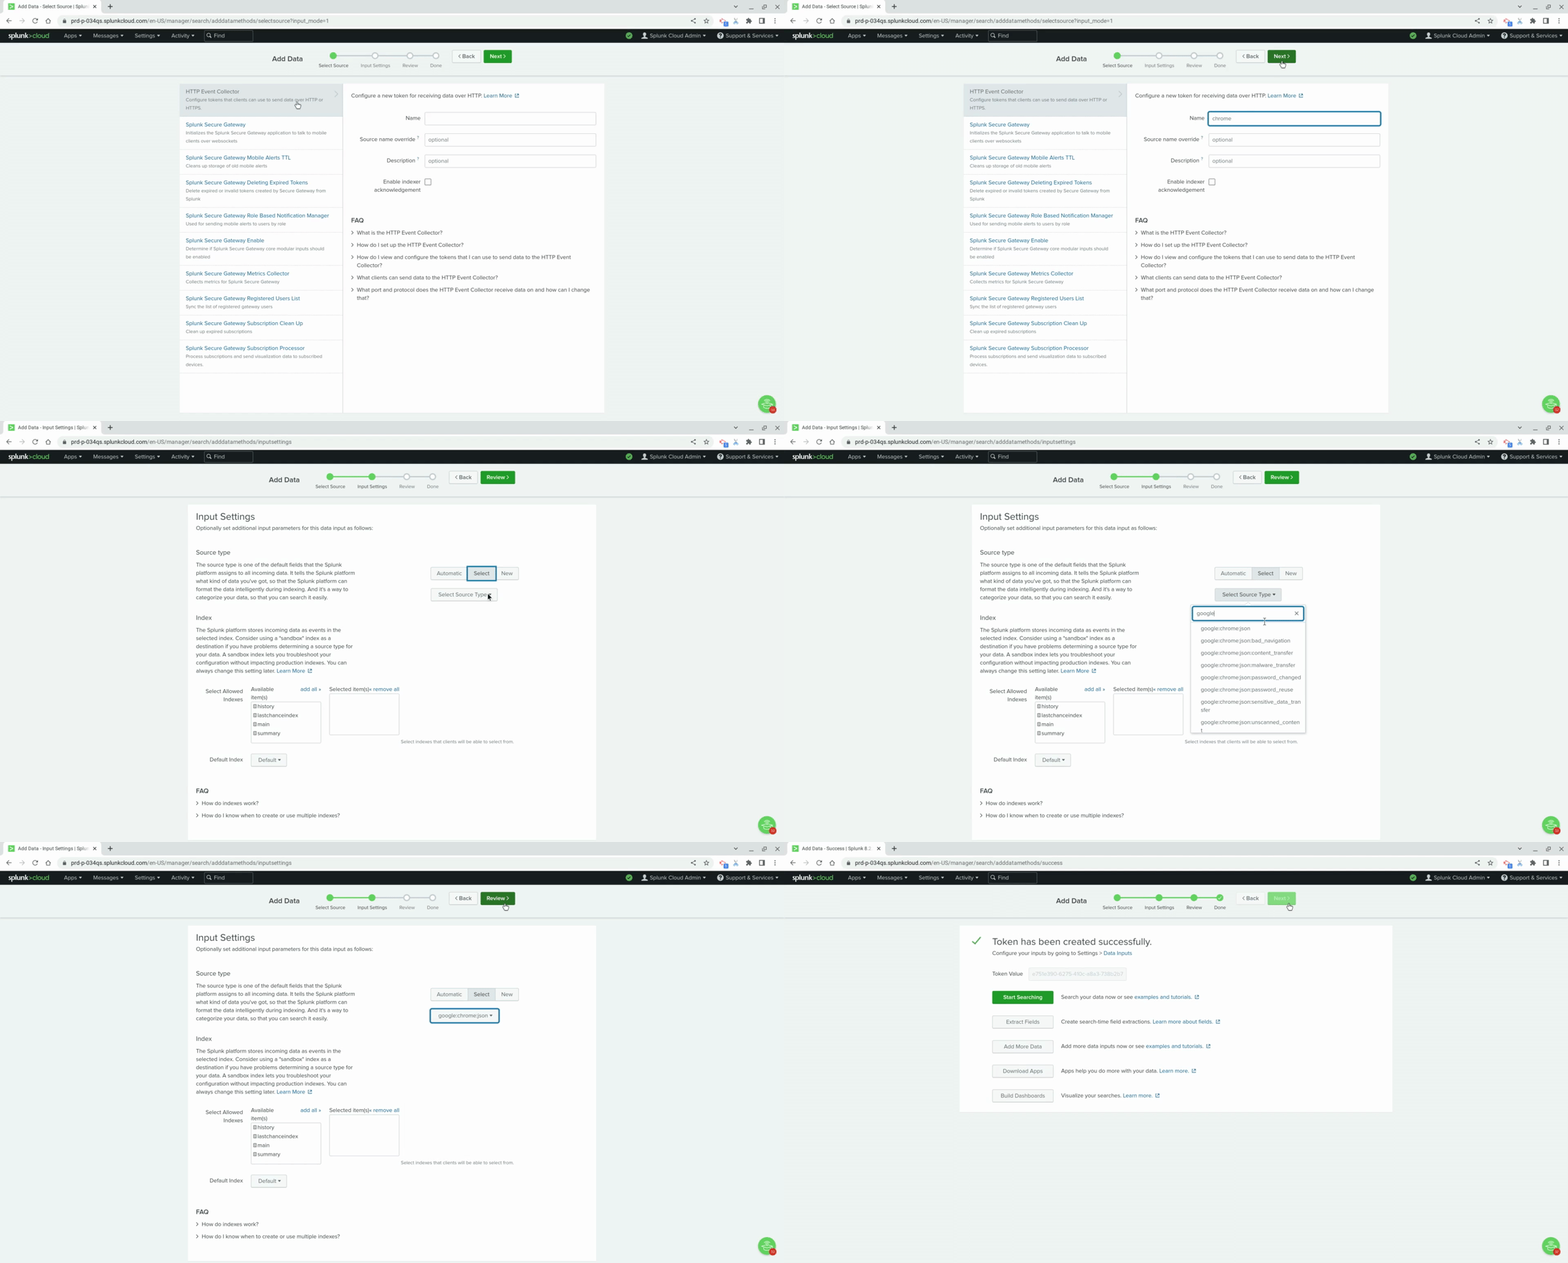
In order to get set up, you will first log into your Splunk instance to add the Google Chrome add-on for Splunk. You will set up an HTTP Event Collectors (or HEC) and choose google:chrome:json for the source type. Copy the token value shown; you’ll need it for later.

Setup in Chrome Browser Cloud Management
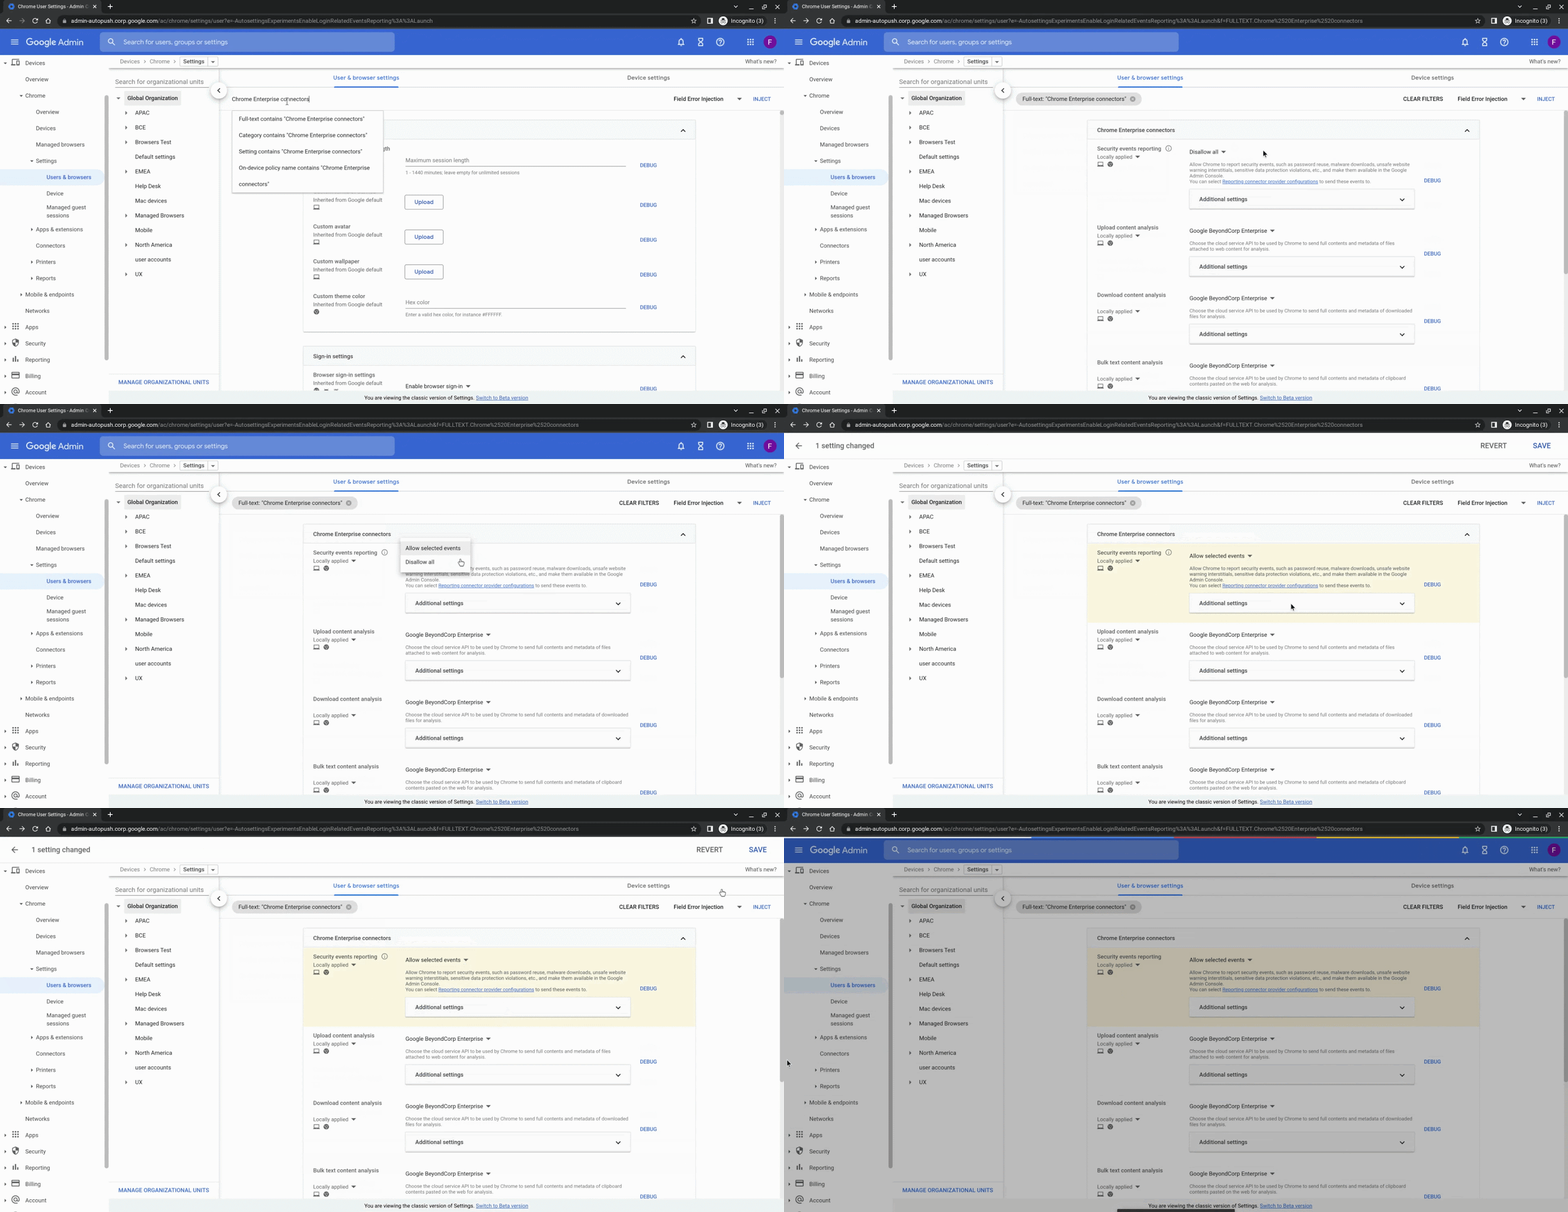
Log into your Google Admin console at admin.google.com to set up the integration in Chrome Browser Cloud Management. You will enable the security events reporting by going to Devices > Chrome > Users and browsers and searching for “Chrome Enterprise connectors.” Select “Allow selected events” under “Security events reporting.” Optionally, you can disable certain events from being sent by going into “Additional Settings.”

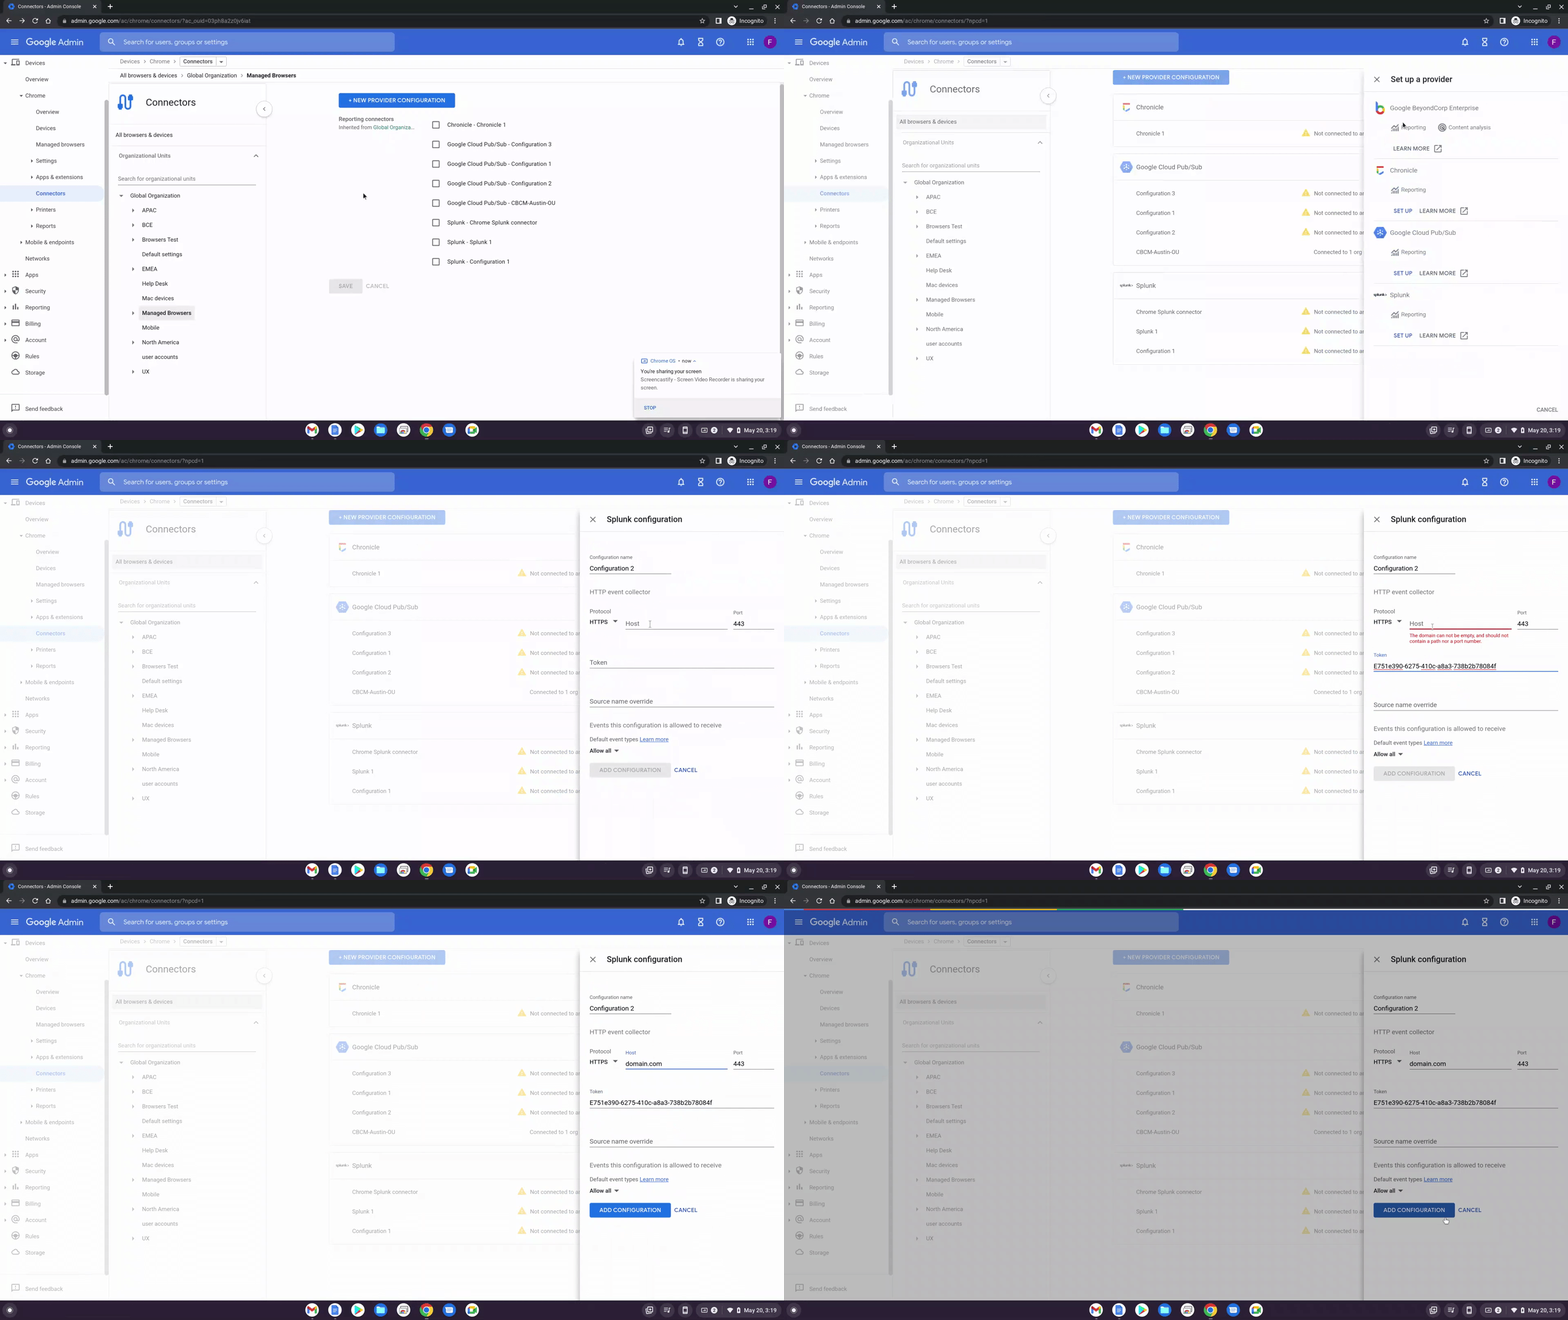
Now that the events are turned on, click the blue link in the description of “Security event reporting” to go to the connector provider configurations (you can also find it under Devices > Chrome > Connectors.) Click the new provider configuration button and select Splunk. Enter the configuration name that you want this connector to display as in Google Admin console. Enter the domain name of your Splunk instance and the token id generated from the HEC Splunk creation and select add configuration to save. All you have to do is select the Organizational Unit in which the reporting events are turned on, select the Chrome Splunk connector that was just created and hit save. Your integration is all set!

You can also download the setup guide or watch the setup of integration with Splunk end-to-end in the video below:
Register for Chrome Enterprise Demo Day
Aside from this integration, we will be highlighting more exciting features on our Chrome Enterprise Demo Day on June 8, 2022.
Register for free today to attend.
Helpful links to get you started:
Setup Guide: Splunk integration in Chrome Browser Cloud Management
Setting up Chrome Browser Cloud Management
Best practices for using Chrome Browser Cloud Management
Google Chrome Add-on for Splunk
Splunk Add-on installs as documented for a Single Server Install or a Distributed Environment Install.
Help Center Article for Reporting Connectors
Help Center Article for Chrome Enterprise Connectors Framework
