Announcing Workflows execution steps history
Mete Atamel
Cloud Developer Advocate
Archie Gautam
Product Manager
Introduction
As you orchestrate more services with Workflows, the workflow gets more complicated with more steps, jumps, iterations, parallel branches. When the workflow execution inevitably fails at some point, you need to debug and figure out which step failed and why. So far, you only had an execution summary with inputs/outputs and logs to rely on in your execution debugging. While this was good enough for basic workflows, it didn't provide step level debugging information.
The newly released execution steps history solves this problem. You can now view step level debugging information for each execution from the Google Cloud console or the REST API. This is especially useful for complicated workflows with lots of steps and parallel branches.
In this blog we will take a closer look at a concrete example of Workflows execution steps history.
Running BigQuery jobs in parallel
In an earlier blog post, Introducing Parallel Steps for Workflows, and its associated tutorial, we showed a workflow (workflow-parallel.yaml) that queries 5 BigQuery tables using parallel branches of Workflows to speed up processing.
The workflow outline is as follows:
runQueries step is a combination of 5 parallel branches where each table query happens in parallel.
Debugging with the execution steps history
Let’s assume you made a mistake with the name of one of the tables and you point to a non-existing table. Can the new execution steps history help us to debug that mistake?
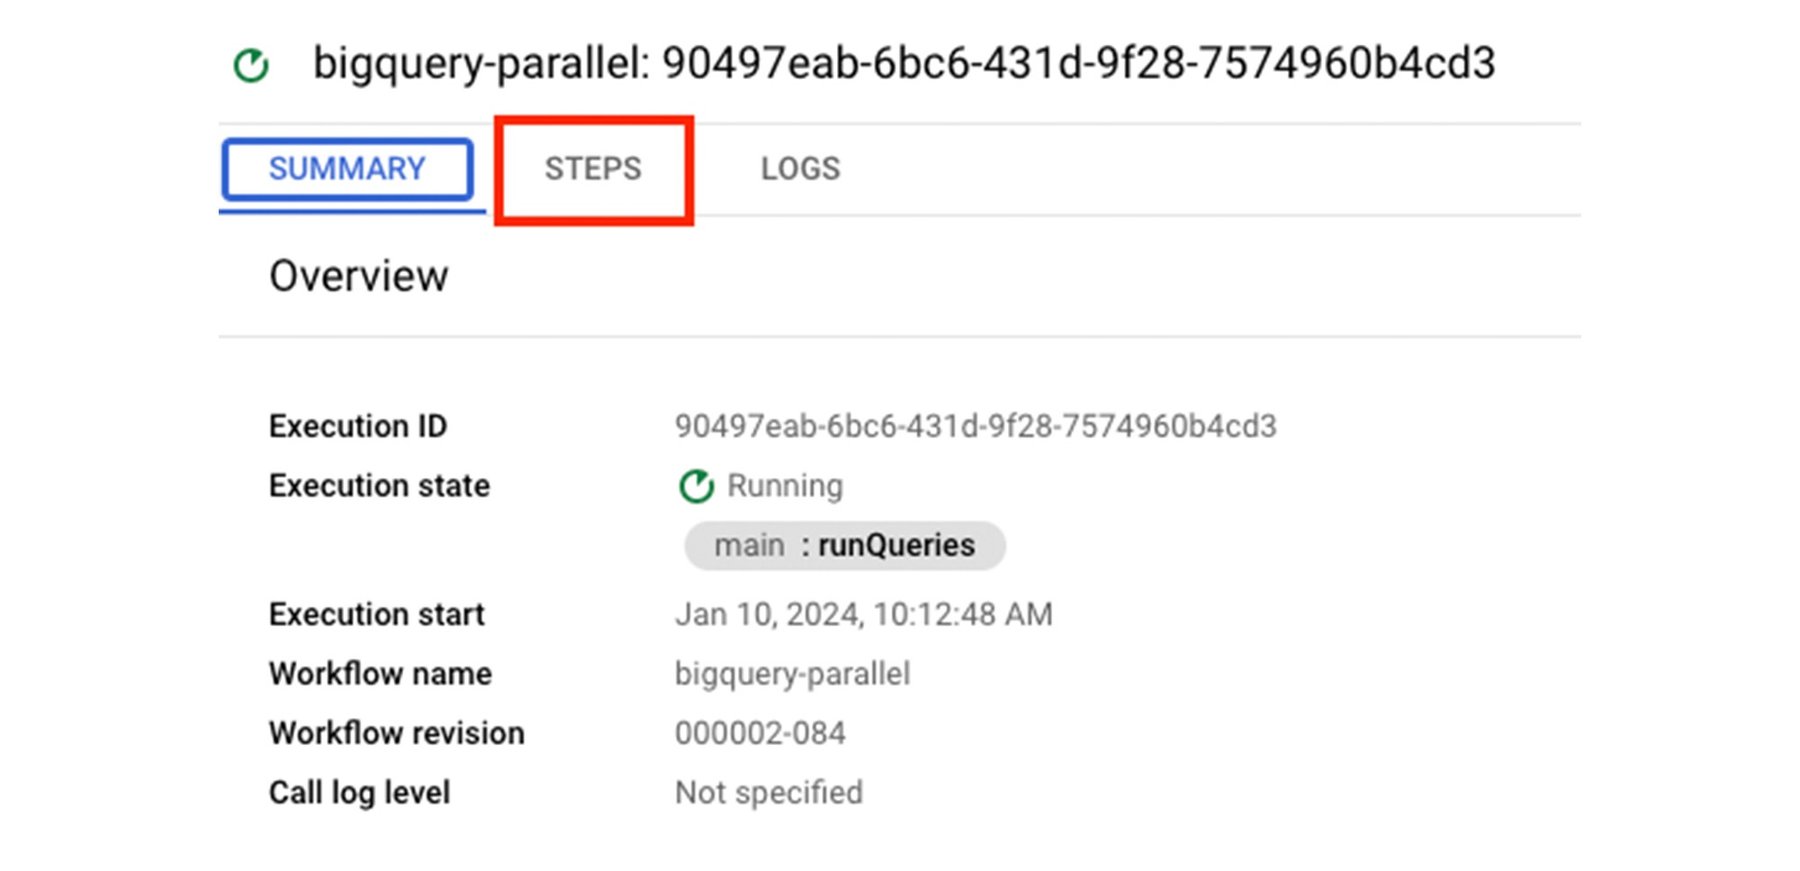
First, as the execution is running, you’ll realize a new steps tab under execution details in Google Cloud console:

Under the steps tab, you start seeing some steps succeeded, running, and failed:
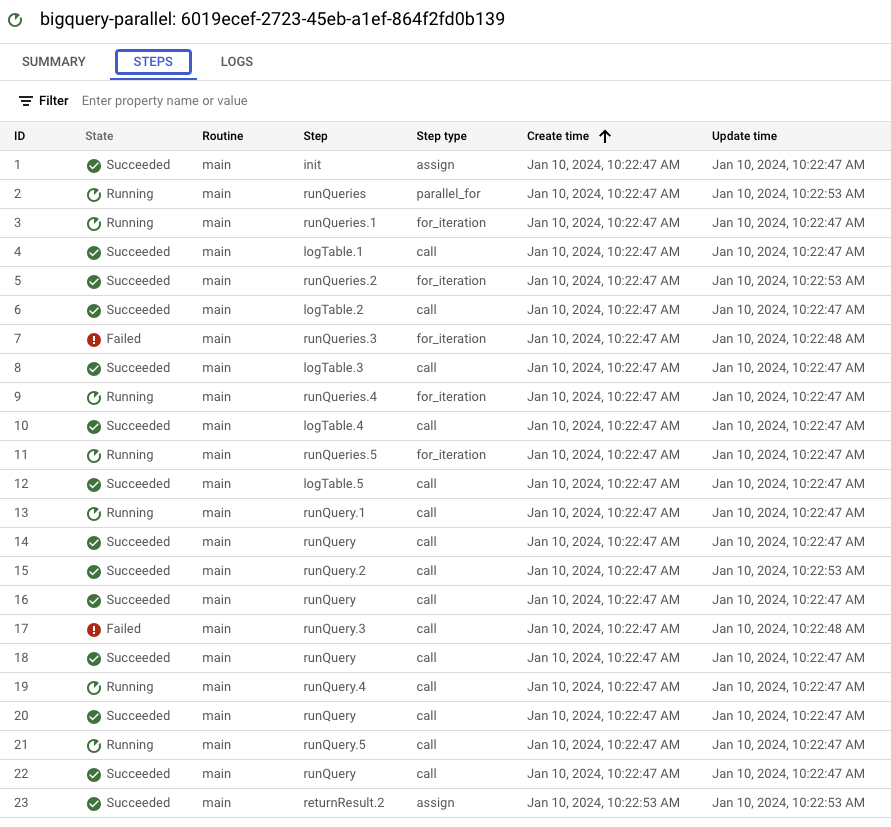

This is already very useful in visualizing and understanding what happens under the hood!
Once the execution is finished, you will see that the top level runQueries step failed. You can filter to see its children steps:
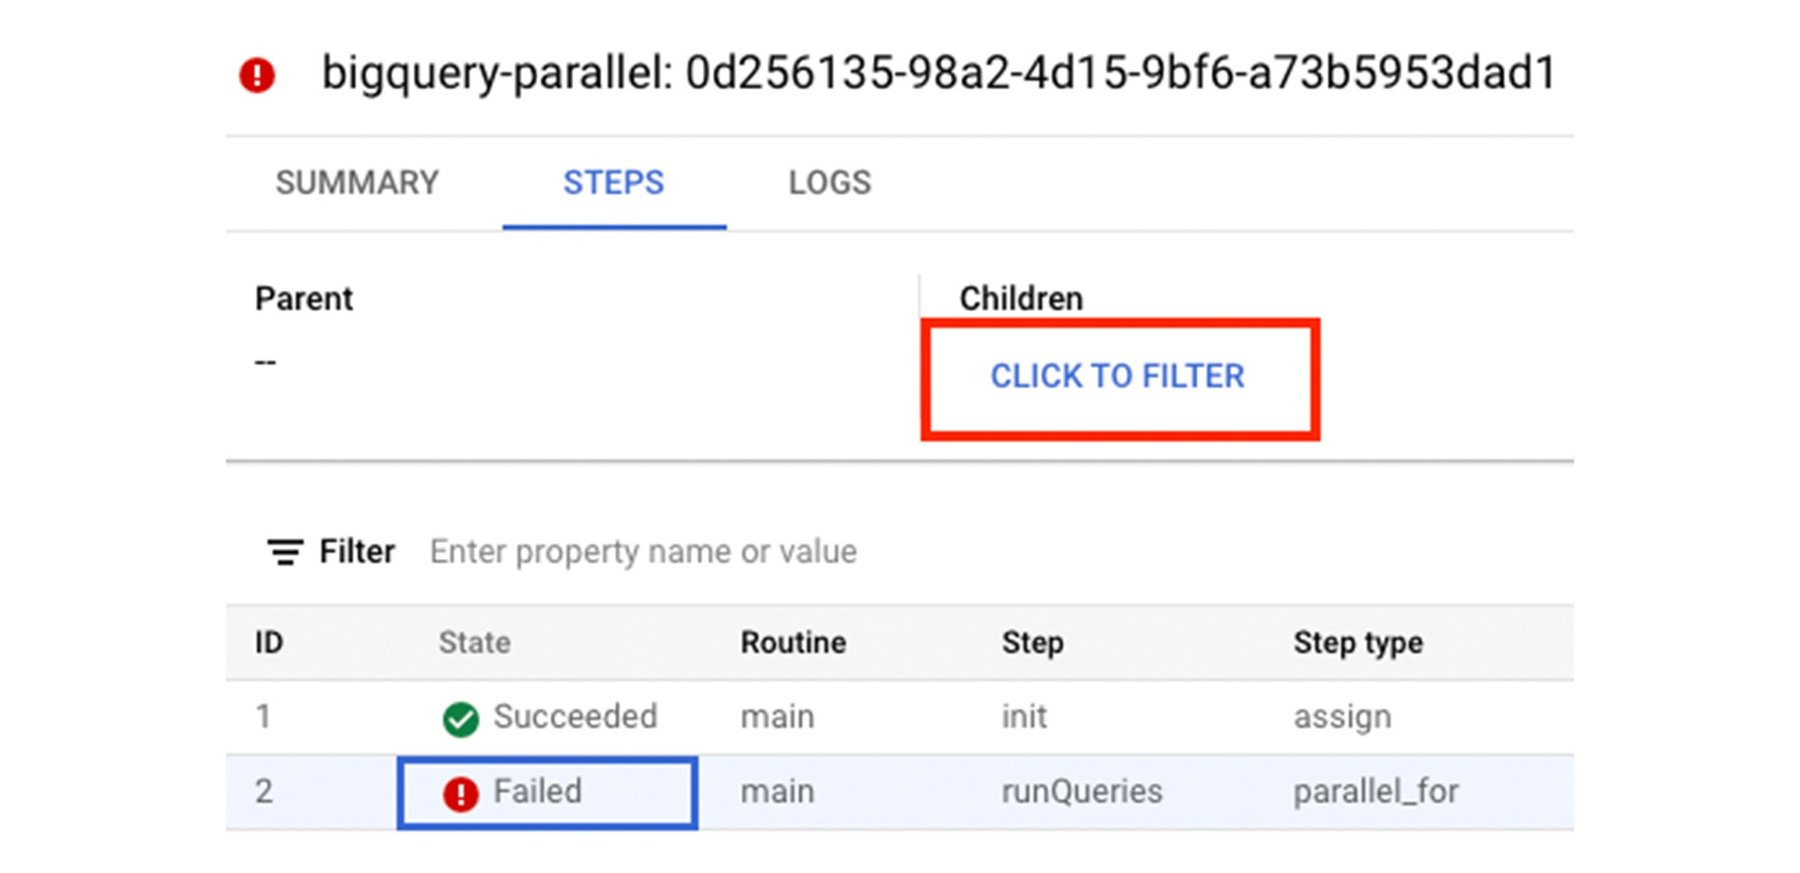

You see that one of the iterations (i.e. tables) of runQueries failed:
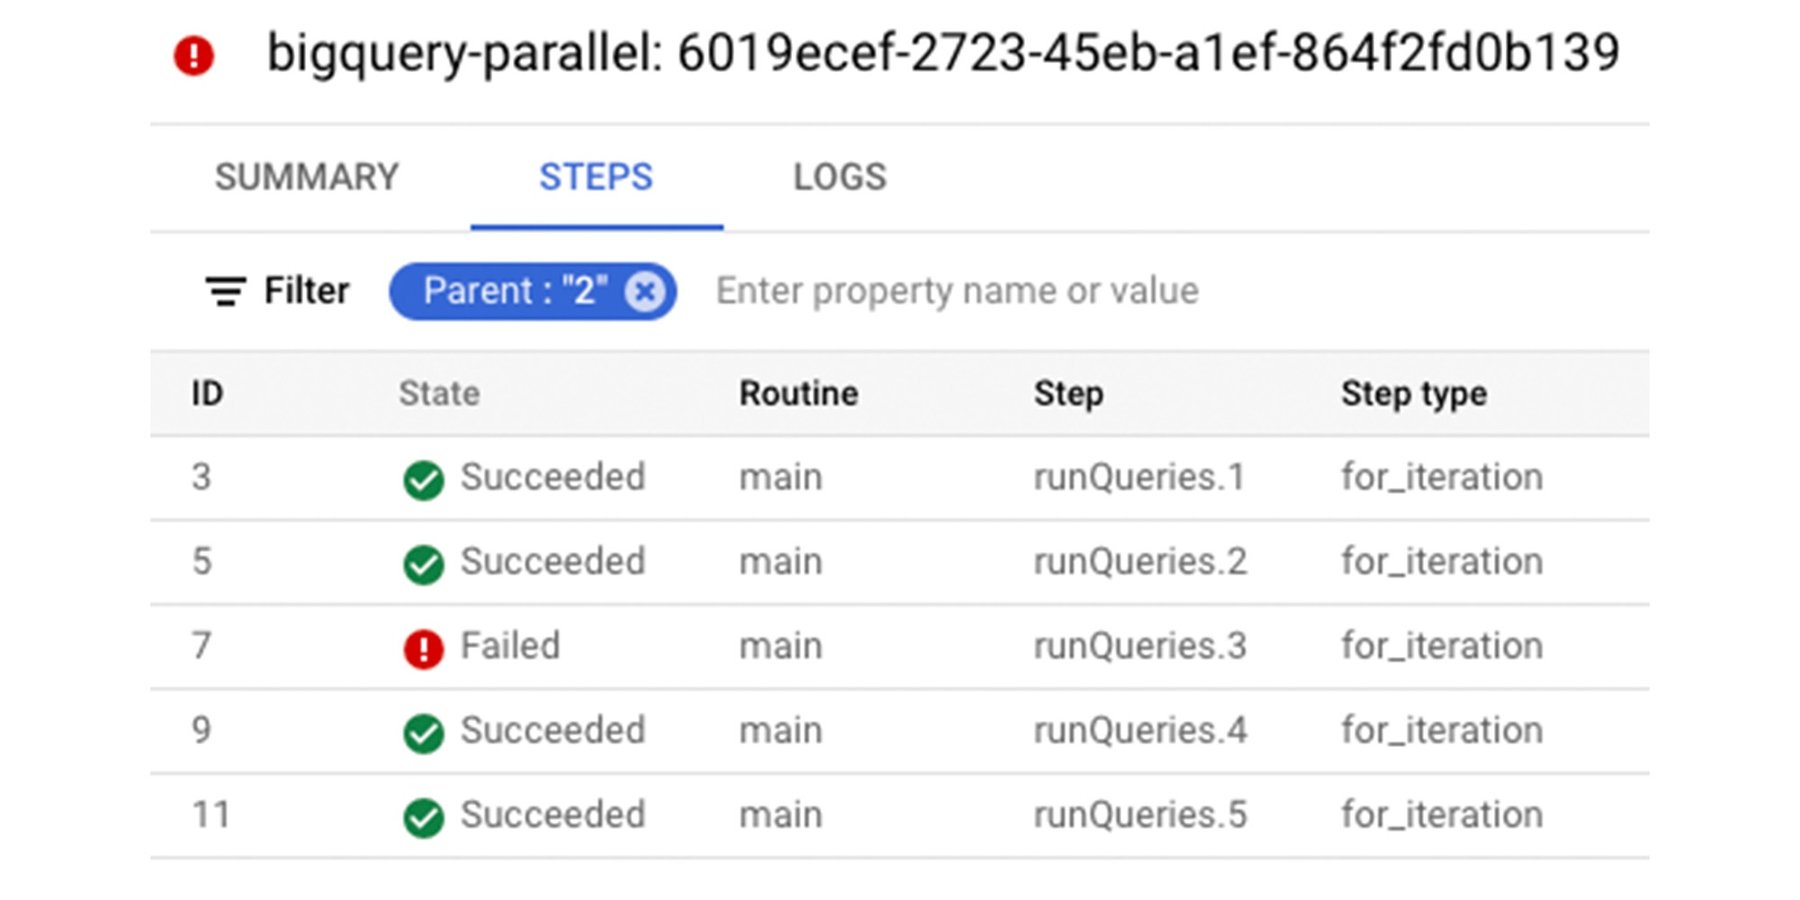

Further filtering on runQueries.3 step, you realize that runQuery.3 failed:
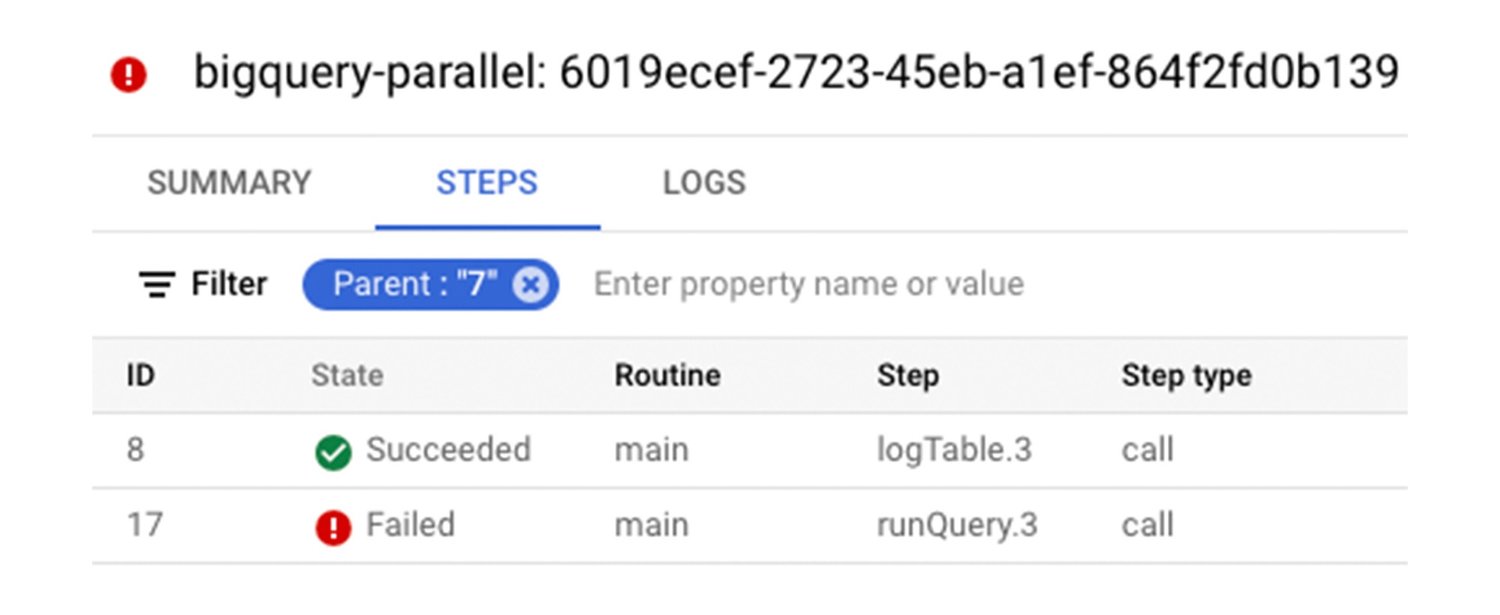

Finally, further zooming into runQuery.3 reveals that the step received HTTP status 404 which hints that the table in question might not exist:
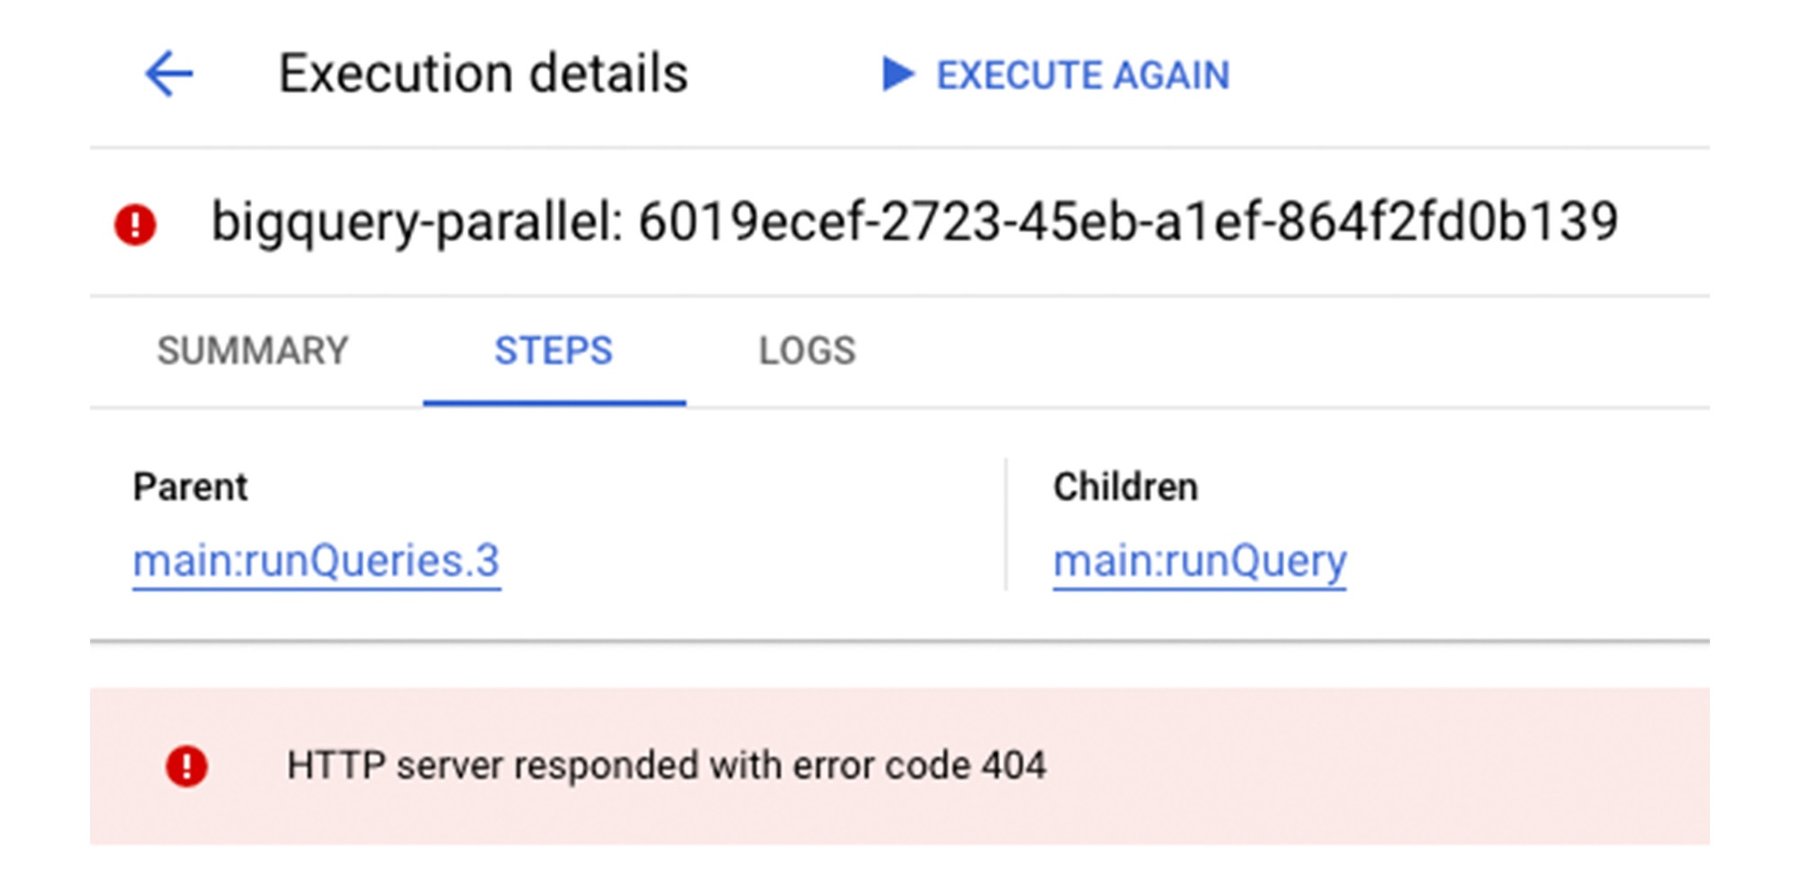

At this point, you can look into logs and get to the exact reason for HTTP 404, the non-existing table.
We went from a failed execution to the exact failed step in a parallel branch and the actual HTTP 404 error pretty quickly!
Summary
The new execution steps history makes it easier to understand what happens under the hood with an execution. While most developers will use the Google Cloud console to view the steps history, you can access the same information from the REST API as well. We will keep improving the developer experience with 2 more features scheduled for Workflows execution. You will be able to see progress for loops, parallel branches, retries and also see a detailed view of inputs/outputs and user variables. Stay tuned!
Next Steps
To learn more, check out the view history of execution steps documentation and the visualize and Inspect Workflows Executions blog post from Guillaume Laforge. You can also utilize the official Workflows samples and experiment with how the execution steps history helps. As always, connect with me on Twitter @meteatamel if you have any questions or feedback.
