AI in depth: profiling the model training process for TensorFlow on Cloud ML Engine
Leonid Kuligin
Strategic Cloud Engineer
Julien Phalip
Solutions Architect, Google Cloud
If you've used Cloud Machine Learning (ML) Engine, you know that it can train and deploy any TensorFlow, scikit-learn, and XGBoost models at large scale in the cloud. But did you know that Cloud ML Engine also allows you to use TensorFlow’s profiling mechanisms that can help you analyze and improve your model's performance even further?
Whether you use low-level APIs such as tf.Graph and tf.Session or high-level APIs such as tf.Estimator and tf.Dataset, it can sometimes be useful to understand how models perform at a lower level to tune your code for efficiency. For example, you might be interested in details about model architectures (e.g., device placement and tensor shapes) or about the performance of specific batch steps (e.g., execution time, memory consumption, or expensive operations).
In this post, we show you different tools that can help you gain useful insights into your Cloud ML Engine profiling information so that you can squeeze out that extra bit of performance for your models.
The examples presented in this post are based on this codelab and this notebook, which analyze a US natality dataset to predict newborns’ birth weights. While not necessary, you can follow the codelab first to familiarize yourself with the code. You can find the full code samples for this post and their prerequisites here.
Basic profiling
The simplest tool at your disposal for profiling the model training process is tf.train.ProfilerHook. ProfilerHook captures profile traces for individual steps that can give you an overview of the individual TensorFlow operations (i.e., the low-level API calls associated with the nodes in your TensorFlow graph), their dependencies and how they are attributed to hardware devices (CPUs, GPUs, and TPUs). In turn, `ProfilerHook` can help you identify possible bottlenecks so you can make targeted improvements to your pipeline and choose the right Cloud ML Engine cluster configuration.
If you already use TensorBoard to visualize your TensorFlow graph and store the profile traces in the same directory as the one used for your checkpoints, you will see two additional tabs named “Memory” and “Compute Time” in TensorBoard, at the bottom of the right sidebar. You will also see information about the total compute time, memory size, and tensor output shapes when clicking on a node, as described here.
Capturing traces for every step over the entire training process is often impractical, because that process can become resource-intensive, significantly increase your training times, and generate volumes of information that are too large to analyze. To reduce the volume of generated information, you can lower the sampling rate by using either the save_steps or the save_secs attributes to only save profile traces respectively every N steps or N seconds. Below is an example that captures traces every 10 steps:
If you want more control over which steps you’d like to profile, you can provide your own implementation of the step selection logic. For example, you can refer to LambdaProfilerHook, a custom extension of ProfilerHook that allows you to select arbitrary steps. One way to use it is to select a range of consecutive steps to profile a specific stage of the training process (in this case steps 100 to 110):
ProfilerHook generates one separate trace file named timeline-[STEP_NUMBER].json in the trace-event format for each selected step. To analyze the information contained in those files, first download them locally:
Then open the Chrome browser and type chrome://tracing in the URL bar. Then click the Load button and select a trace file. This loads the traces for the corresponding step into the Chrome tracing UI.
In the next sections, we show you how to collect and analyze profile traces for different Cloud ML Engine scale tiers (a single machine, a distributed cluster, and a single GPU instance).
Example on a single machine
Let’s first take a look at some traces captured for our sample training process using the BASIC scale tier, that is, with a single worker instance with four CPUs:
The above command runs the training job in 50K batch steps and generates traces every 20K steps, generating three profile trace files:
After downloading and loading one of the generated files in the Chrome tracing UI, you can see the execution time and dependencies for every operation in the graph:


Traces are divided in three main groups:
- Compute: Visualizes when each operation started and ended and in what thread it was executed. By clicking on an operation you can reveal more details about its execution times. By clicking on
View options > Flow eventsyou can reveal the operations’ dependencies. - Tensors: Visualizes when each tensor was created and deleted from memory. The circles represent the exact times at which the memory snapshots were taken for each tensor. By clicking on a tensor you can get more details about its shape, memory consumption, and creation and deletion times.
- Allocators: Visualizes the overall memory consumption while the batch step was processed. By clicking on the barplot you can reveal the exact memory consumption values at various points in time.
By inspecting the graphs, you can see that the speed or performance of your training job is mainly limited by the data input pipeline (since it’s the longest one). To implement some optimizations, you might want to check out the documentation on data input pipeline performance.
Example on a distributed cluster
Let’s now take a look at the same example but this time running the training job on the STANDARD_1 scale tier, i.e., one master node with four CPUs and four worker instances with eight CPUs each:
The above command generates a total of 15 trace files (three for the master and three for each of the four workers). Besides the usual metrics, the workers’ trace files also contain the parameter servers’ operations. (Note: the parameter server stores and updates the model's parameters in a distributed architecture.)
If you open one of the worker’s trace files, you see that the traces divided in the same types of groups as in the first example (Compute, Tensors, and Allocators). However there are now Compute and Tensors groups for all workers (e.g., a Compute group is named /job:/worker/replica:0/task:N/device:CPU:0 Compute for an Nth worker) and for all parameter servers (e.g., a Tensors group is named /job:/ps/replica:0/task:N/device:CPU:0 Tensors for the Nth parameter server).
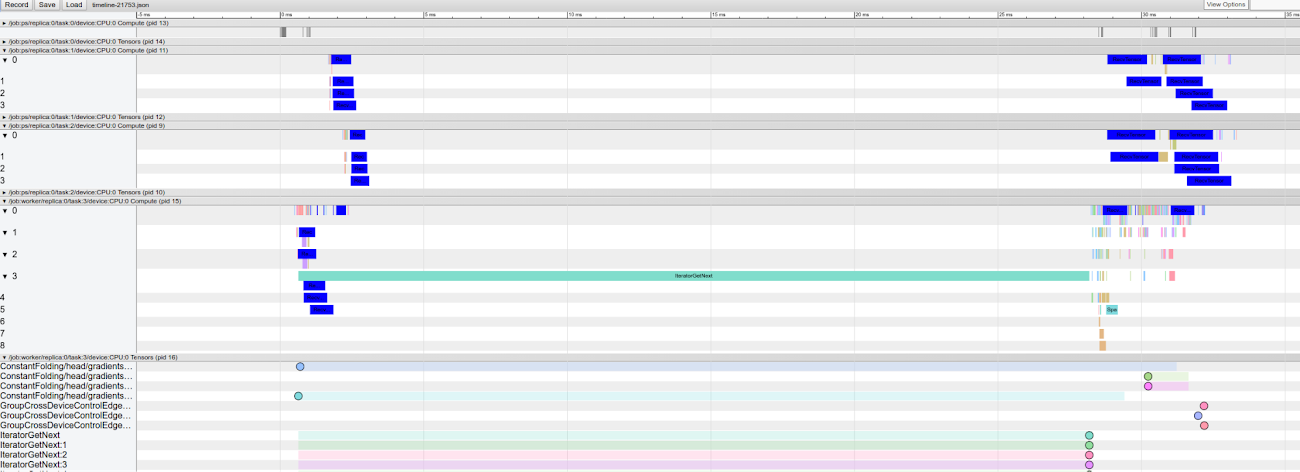

This comparison highlights the tradeoff inherent in distributed architectures: using more nodes can help the training process reach convergence quicker but also consumes more computational resources. It’s important to measure actual consumption so that you can finely adjust the number of workers you’re using, in order to reach the ideal balance between speed and cost. Capturing and visualizing traces can help you estimate your overhead, letting you more precisely select the architecture that is suited to your use case.
A GPU example
Let’s now take a look again at the same example but this time running the training job on the BASIC_GPU scale tier, that is, a single worker instance with eight CPUs and one GPU:
If you open one of the generated trace files, you see that things look a bit different from our previous examples:
- There still is an Allocators group for the memory consumption, however multiple allocators are displayed:
CPU, cpu_pool, GPUandcuda_host_buffer. You can read more about cuda_host here. - Statistics about the operations run in every GPU stream (including the
memcpystream) are available in each one of the Compute groups. You can find more details about CUDA streams here or here.
By inspecting the graphs, you see that the GPU utilization is quite low. This means either that GPUs are not the right fit for this model, or that the batch size must be increased significantly. You also see that the input data pipeline takes up a large share of the overall time spent for the whole step:


Advanced profiling
In cases where collecting basic traces for individual steps isn’t enough, TensorFlow offers another great tool called Profiler that lets you do some advanced analysis. Profiler allows you to aggregate traces for multiple steps and calculate average values for execution times, CPU and memory consumption. It also allows you to search for the most time- or resource-expensive operations, to analyze device placement and model architecture (number of parameters, tensor shapes), and more.
To use Profiler, simply instantiate a ProfileContext as shown in the following excerpt from our example code:
The above code generates a single Profiler context file that contains traces for 50 consecutive steps (that is between steps #1050 and #1100). If you want more control over how Profiler traces are collected, you can customize your profiling options in the ProfilerOptionBuilder class.
In the next sections, we show you two different ways to use Profiler traces: using the command line and using the standard user interface.
Using Profiler with the command line
Follow these steps to use Profiler with the command line:
1. Install the Bazel build tool by following the instructions for your platform. (Note: if you’ve already compiled TensorFlow from source, you should already have Bazel installed.)
2. Download and compile Profiler using Bazel:
3. Download the Profiler’s trace file locally:
4. Start a new Profiler session:
Now let’s take a look at a few examples of what you can do in Profiler by passing different options to the command line tool:
1. Display the python methods invocation tree:
The above command displays average statistics for the 50 profiled steps. You can also specify the exact steps that you are interested in by using the `regExes` filters.
2. Expose the operations that consume the most memory:
3. Display the tensor shapes and the number of parameters for all calls made to tf.trainabale_variables() in the profiled training steps:
Lastly, you can also experiment with the advise command to automatically profile your model and easily find the most expensive operations, the accelerators’ utilization, and more.
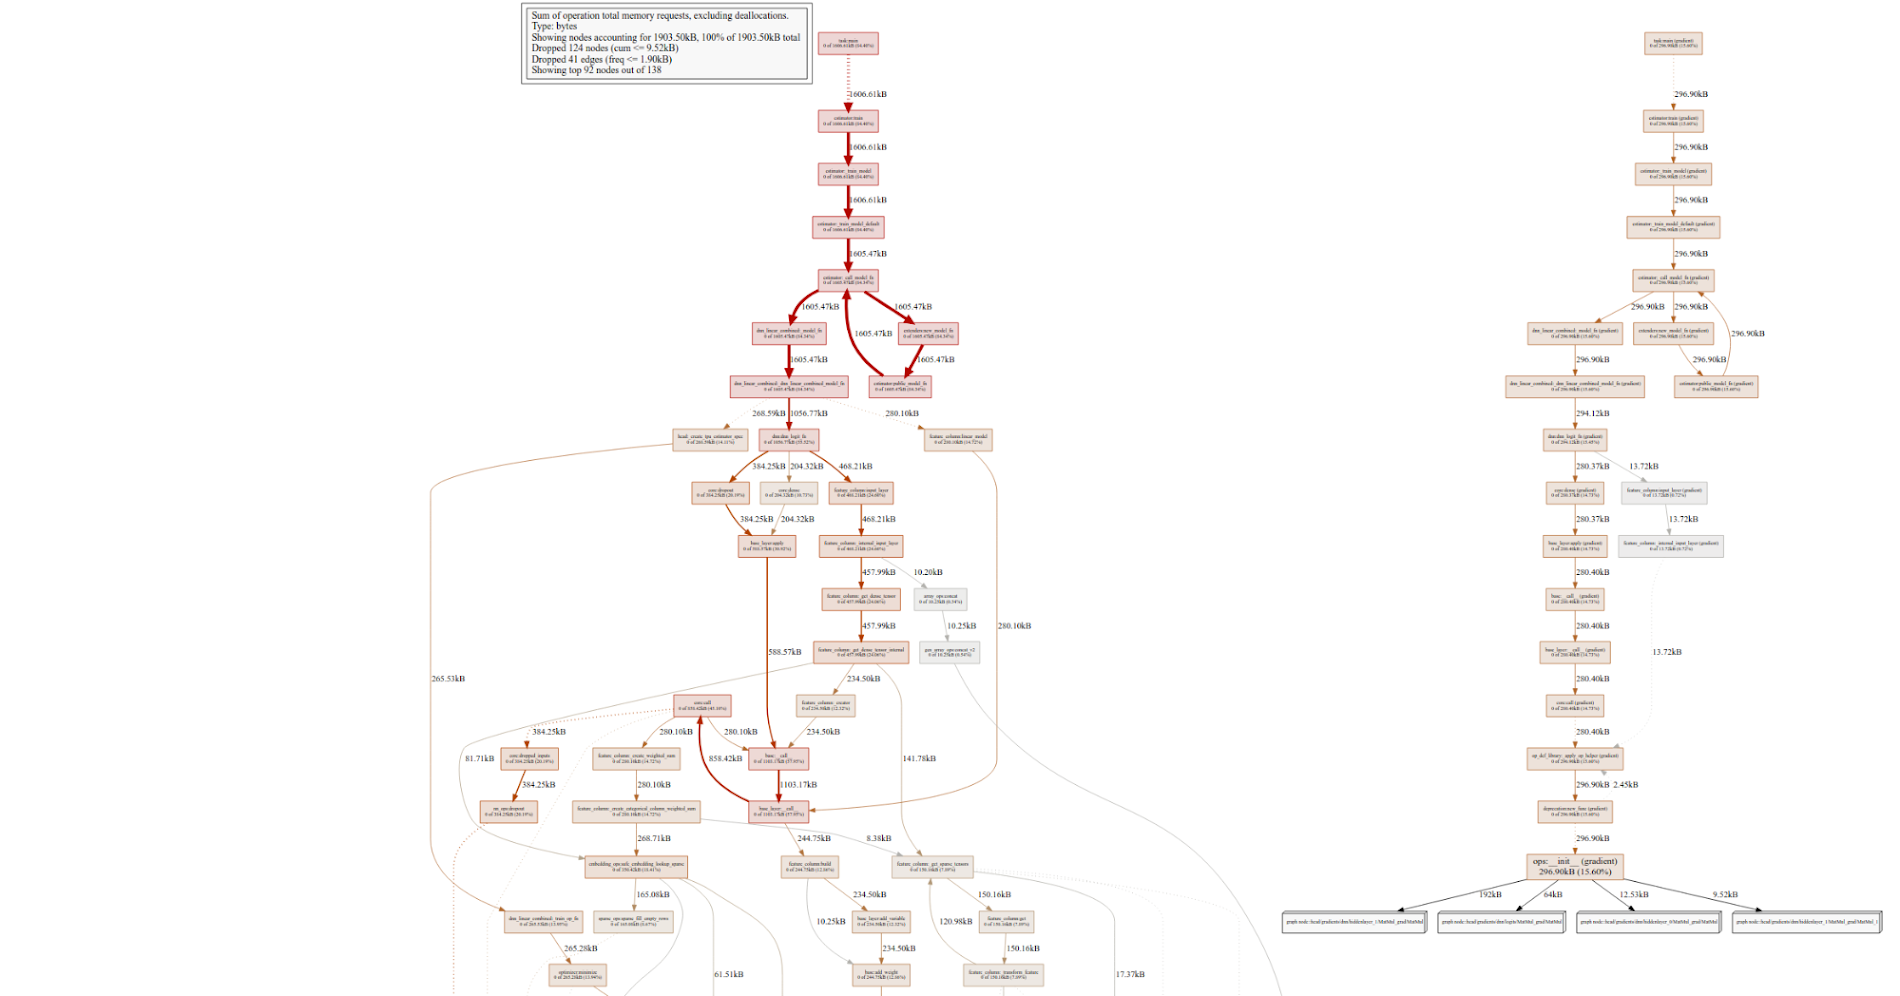
You can also visualize a timeline for a specific step to inspect with chrome://tracing as we’ve discussed above (read more about how to do this), or generate your own timelines for a few steps. First, generate a binary profile (taking into account your desired conditions) and then generate a visualization with pprof (if you’ve installed it):
tfprof> code -select accelerator_micros -max_depth 100000 -output pprof:outfile=PATH_TO_YOUR_FILE -trim_name_regexes .*apply_op.*
And now execute this command from your terminal to generate a png file:

Using the Profiler UI
There’s also a user interface tool called profiler-ui to analyze your Profiler trace files. To use profiler-ui, first follow the installation instructions, then start the tool:
This tool has the same capabilities as the command line interface but it is generally easier to use and can help you visually identify bottlenecks in the flow of operations.
Conclusion
We hope you find these techniques useful when training models, to better understand the performance and behavior of your training process. If you’re interested in learning more, check out some of our documentation below:

