Introducing built-in performance monitoring for Vertex AI Model Garden
Kate Brea
Product Manager, Google Cloud Observability
Warren Barkley
Senior Director, Product Management, Google Cloud
Try Gemini 3.1 Pro
Our most intelligent model available yet for complex tasks on Gemini Enterprise and Vertex AI
Try nowToday, we’re announcing built-in performance monitoring and alerts for Gemini and other managed foundation models – right from Vertex AI’s homepage.
Monitoring the performance of generative AI models is crucial when building lightning-fast, reliable, and scalable applications. But understanding the performance of these models has historically had a steep learning curve: in the past, you had to learn where the metrics were stored and where you could find them in the Cloud Console.
Now, these metrics are available right on Vertex AI’s home page, where you can easily find and understand the health of your models. Cloud Monitoring shows a built-in dashboard providing information about usage, latency, and error rates on your gen AI models. You can also quickly configure an alert if any requests have failed or been delayed.
How it works
If you’re using Vertex AI foundation models, you can find overview metrics for your models on the Dashboard tab in Vertex AI, and click into an out-of-the-box dashboard in Cloud Monitoring to gain more information and customize the dashboard. Here, you will be better able to understand capacity constraints, predict costs, and troubleshoot errors. You can also quickly configure alerts to quickly inform you about failures and their causes.
View Model Observability in Vertex AI
Configure an alert
Let’s say you’re an SRE who is responsible for ensuring the uptime of your company’s new customer service chatbot. You want to find a dashboard that gives you a bird’s eye view of possible issues with the chatbot, whether they include slowness, errors, or unexpected usage volume. Instead of hunting for the right metrics and creating a dashboard that displays them, you can now go to the Vertex Dashboard page to view high level metrics, and click “Show all metrics” to view a detailed, opinionated dashboard with information about query rates, character and token throughput, latency, and errors.
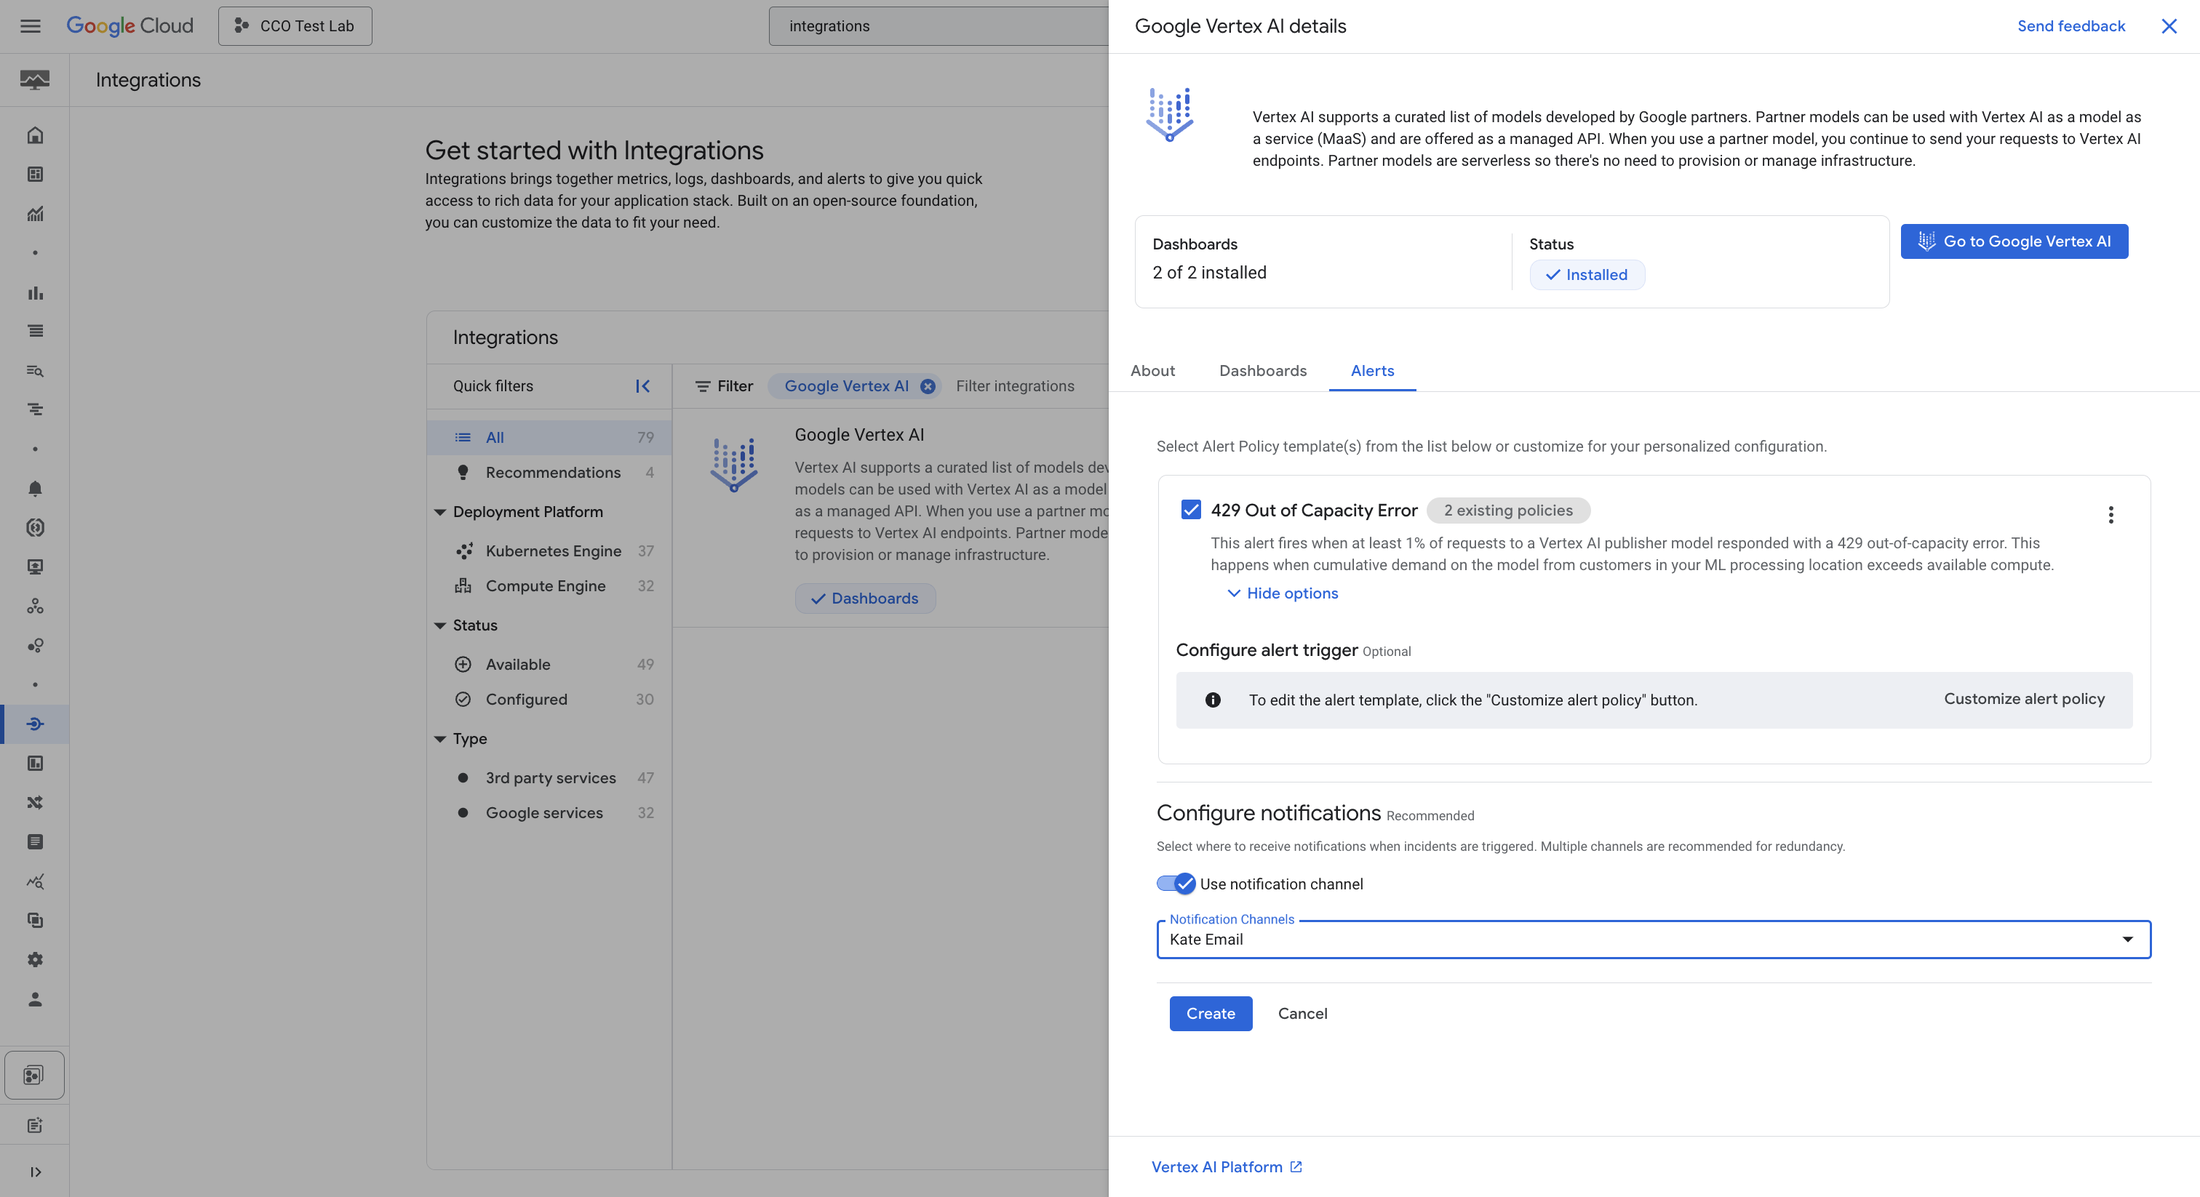
Then, let’s say that you notice that your model returned a 429 error for a number of your requests. This happens when the ML serving region associated with your model runs out of aggregate capacity across customers. You can remediate the issue by purchasing provisioned throughput, switching ML processing locations, or scheduling non-urgent requests for a less busy time using batch requests. You can also quickly turn on a recommended alert that will let you know if more than 1% of your requests return 429 errors ever again.
Get started today
If you’re a user of managed gen AI models from Vertex AI Model Garden, check out the “Model Observability” tab in your project’s Vertex Dashboard page. Click “Show all metrics” to find the built-in dashboard. To configure recommended alerts related to your gen AI workloads, check out the Vertex AI Integration in Cloud Monitoring.