This page applies to Apigee and Apigee hybrid.
View
Apigee Edge documentation.
![]()
What does this dashboard tell me?
The Error Code Analysis dashboard tells you about error rates for API proxies and targets. The Error Code Analysis dashboard uses:
The response code to calculate proxy errors
The target response code to calculate target errors
Errors reported on the Error Code Analysis dashboard might be different from errors reported
on the API Proxy Performance dashboard because
that dashboard calculates error rates based on
the is_error flow variable. That variable can be explicitly set by the API proxy,
so it is not related to the error codes in the proxy response or target response.
When calculating error rates:
A proxy can handle a target error and still return a success response. In this case, the error is counted as a target error but not as a proxy error.
When the target response is either success or does not exist, but the proxy responded with an error, the error is counted against the proxy.
If both the proxy and target respond with an error, the error is counted on the target.
The Error Code Analysis dashboard
To access the Error Code Analysis dashboard:
In the Google Cloud console, go to the Analytics > API metrics > Error Code Analysis page.
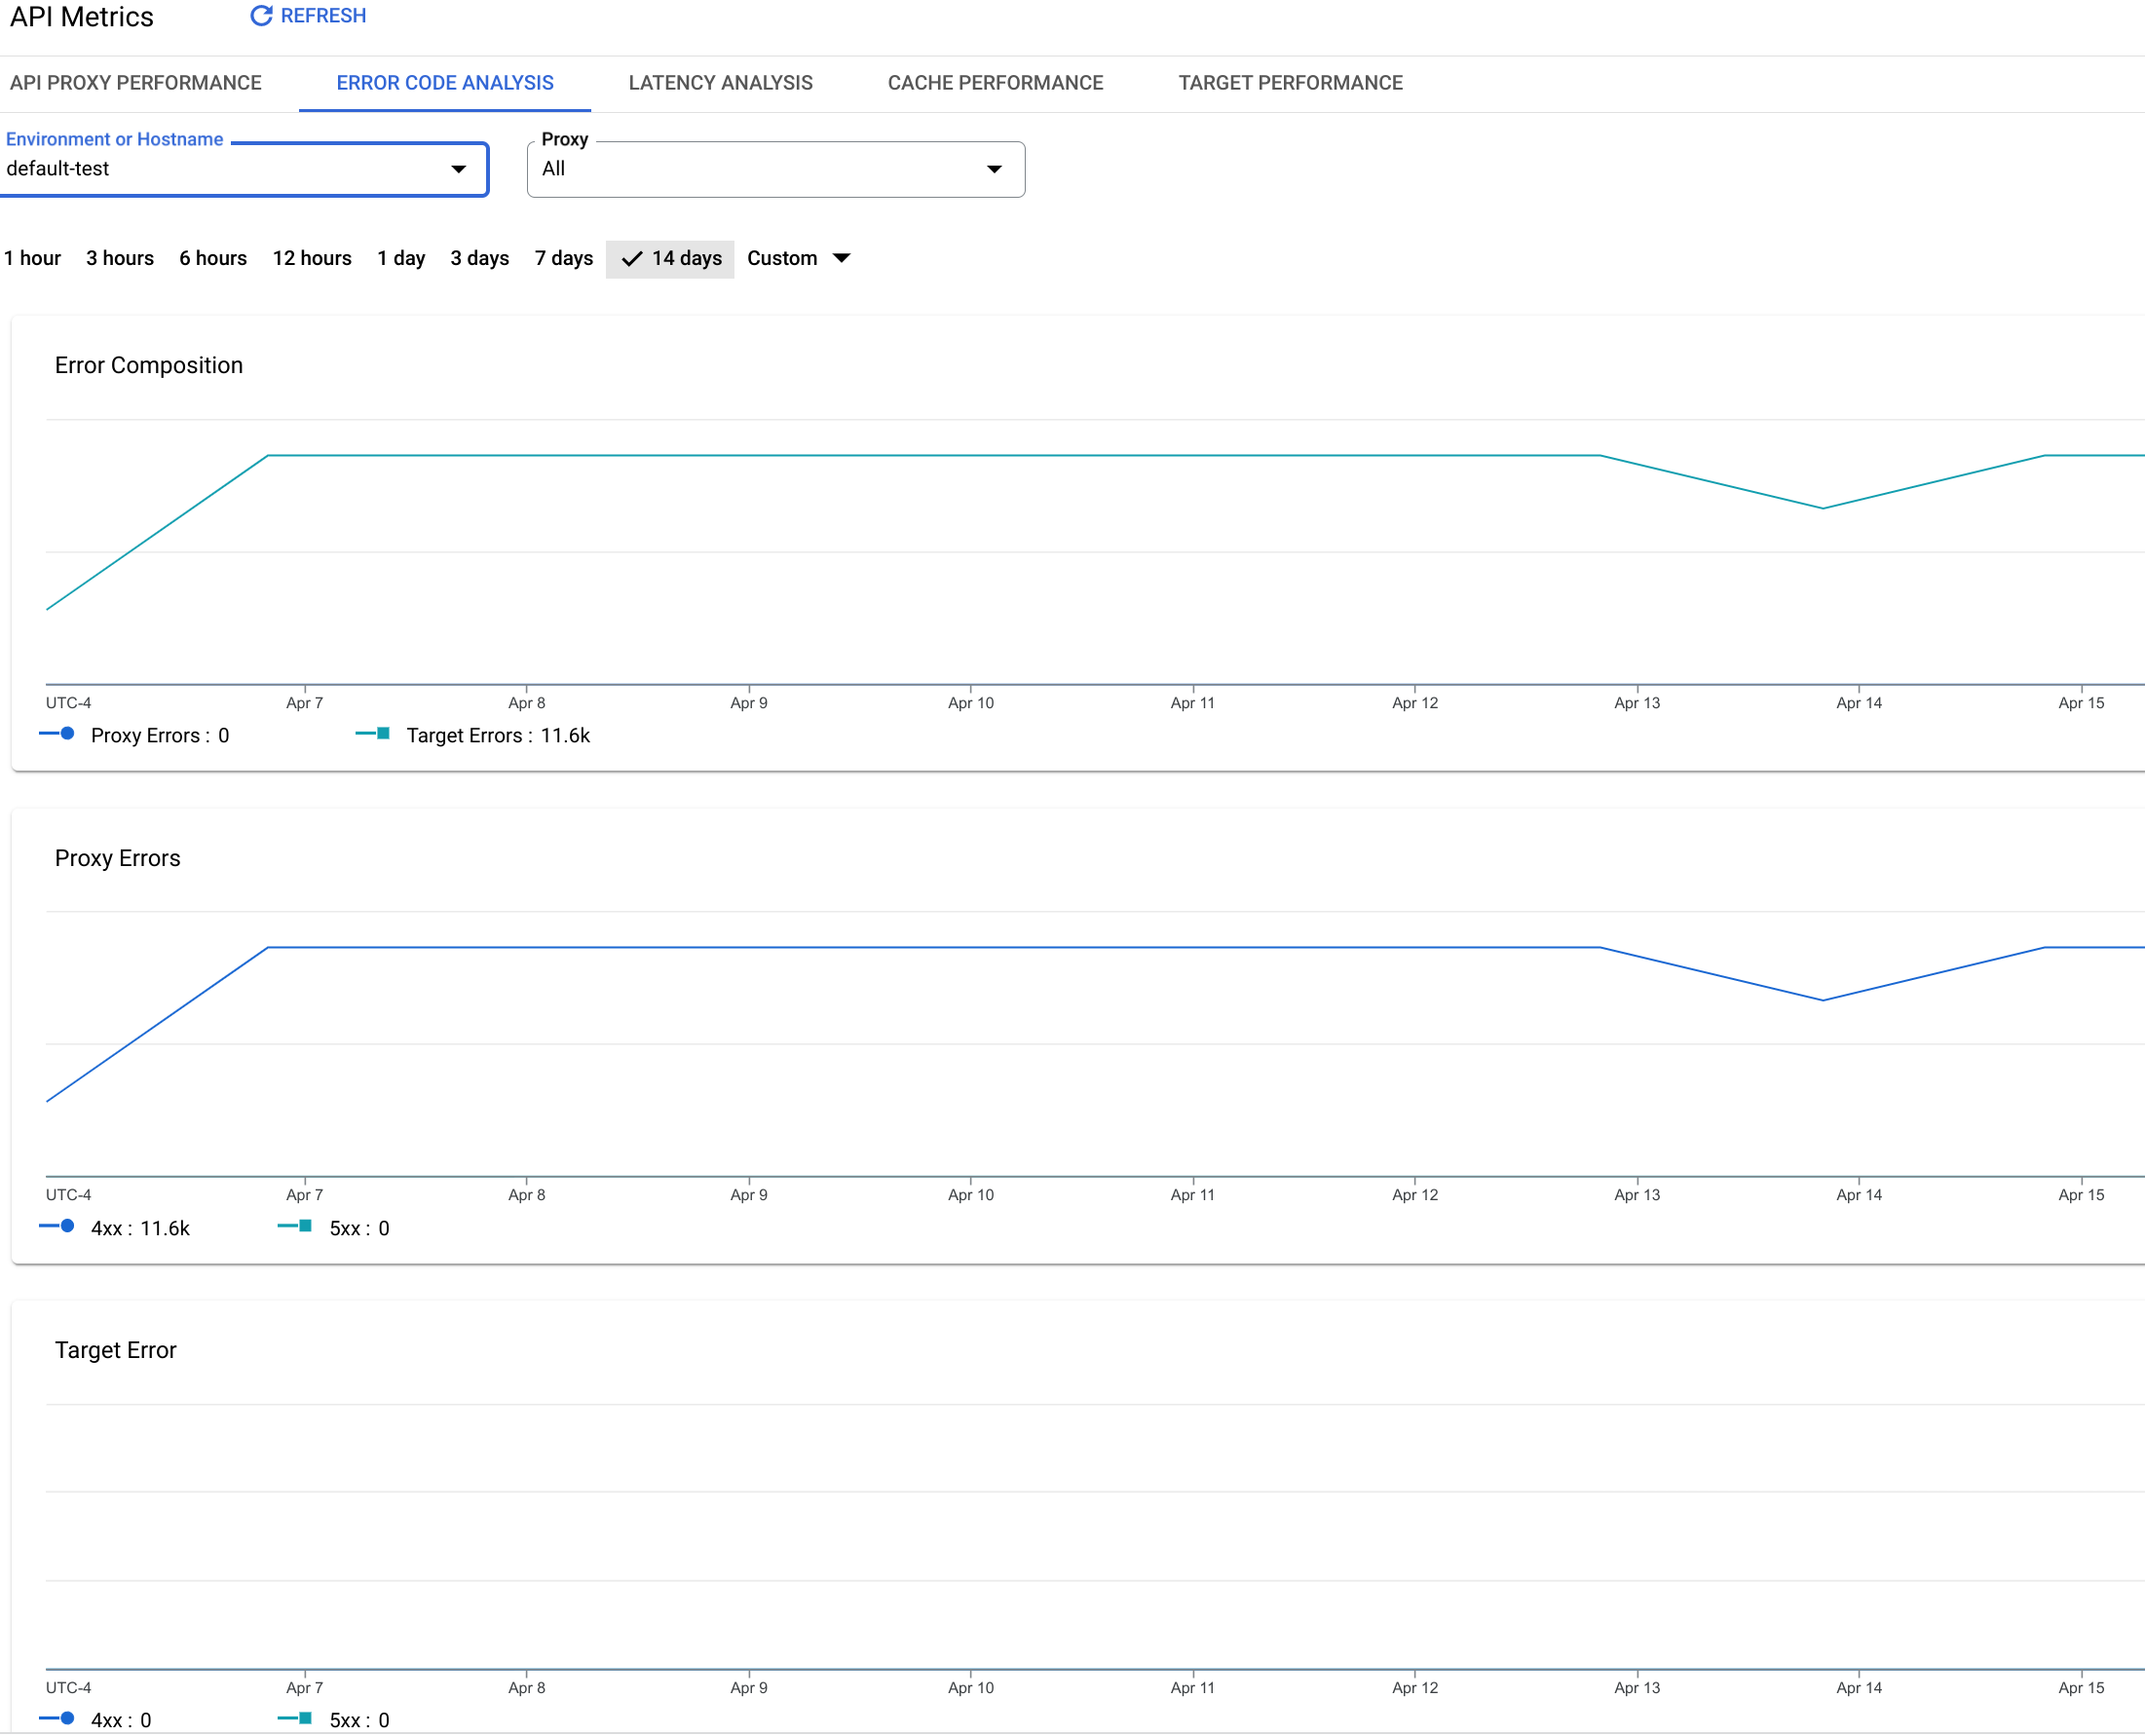
The Error Code Analysis view is shown:

What does this dashboard measure?
- Error Composition
- Proxy Errors
- Target Errors
- Errors by Proxy
- Errors by Target
- Proxy Errors by Response Code
- Target Errors by Response Code
Error Composition
| Metric | Description |
|---|---|
| Total Errors | The total number of proxy errors + target errors that resulted from all requests and responses seen in an Apigee organization over the specified time period. See What does this dashboard tell me? for more on how Total Errors, Proxy Errors, and Target Errors are calculated. |
| Proxy Errors | The total number of proxy errors seen in an Apigee organization in the specified time period as determined by the response code. Proxy errors are measured between the time an entire request is received by Apigee from a client and the time the request is sent to the backend target. |
| Target Errors | The total number of target errors seen in an Apigee organization in the specified time period as determined by the target response code. Target errors are measured between the time an entire request is sent by Apigee to a backend target and the time the response is returned the client app. |
Proxy Errors
| Metric | Description |
|---|---|
| Total Proxy Errors | The total number of proxy errors seen in an Apigee organization in the specified time period. Proxy errors are measured between the time an entire request is received by Apigee from a client and the time the request is sent to the backend target. |
| 4XX | Shows the number of proxy errors that resulted in HTTP 4xx errors. For a complete list of HTTP status codes, see "Status Code Definitions" in the HTTP specification. |
| 5XX | Shows the number API requests that resulted in HTTP 5xx errors. For a complete list of HTTP status codes, see "Status Code Definitions" in the HTTP specification. |
Target Errors
| Metric | Description |
|---|---|
| Total Target Errors | The total number of target errors seen in an Apigee organization in the specified time period. Target errors are measured between the time an entire request is sent by Apigee to a backend target and the time the response is returned the client app. |
| 4XX | The number of target errors that resulted in HTTP 4xx errors. For a complete list of HTTP status codes, see "Status Code Definitions" in the HTTP specification. |
| 5XX | The number of target errors that resulted in HTTP 5xx errors. For a complete list of HTTP status codes, see "Status Code Definitions" in the HTTP specification. |
Errors by Proxy
| Metric | Description |
|---|---|
| <Proxy name> |
The total number of proxy errors seen in an Apigee organization in the specified time period for each individual proxy. Hover over the bars to see the number of errors that came from the each proxy request flow and from the target request flow, respectively. Proxy errors are measured between the time an entire request is received by Apigee from a client and the time the request is sent to the backend target. |
Errors by Target
| Metric | Description |
|---|---|
| <Target name> |
The total number of target errors seen in an Apigee organization in the specified time for each individual target. The number of calls that did not reach any target are listed in the Target Not Contacted column. Hover over the bars to see the number of errors that came from the each proxy response flow and from the target response flow, respectively. Target errors are measured between the time an entire request is sent by Apigee to a backend target and the time the response is returned to the client app. The chart shows the number of errors that came from the proxy response flow and from the target response flow, respectively. |
Proxy Errors by Response Code
| Metric | Description |
|---|---|
| <Response Code> |
The total number of proxy errors seen in an Apigee organization in the specified time that returned each response code. Hover over the bars to see the number of errors that returned each response code. |
Target Errors by Response Code
| Metric | Description |
|---|---|
| <Response Code> |
The total number of target errors seen in an Apigee organization in the specified time that returned each response code. Hover over the bars to see the number of errors that returned each response code. |
