The Cache Performance dashboard lets you see at a glance the value of the response cache.
The dashboard helps you visualize the benefit of the response cache in terms of lower latency and reduced
load backend servers.
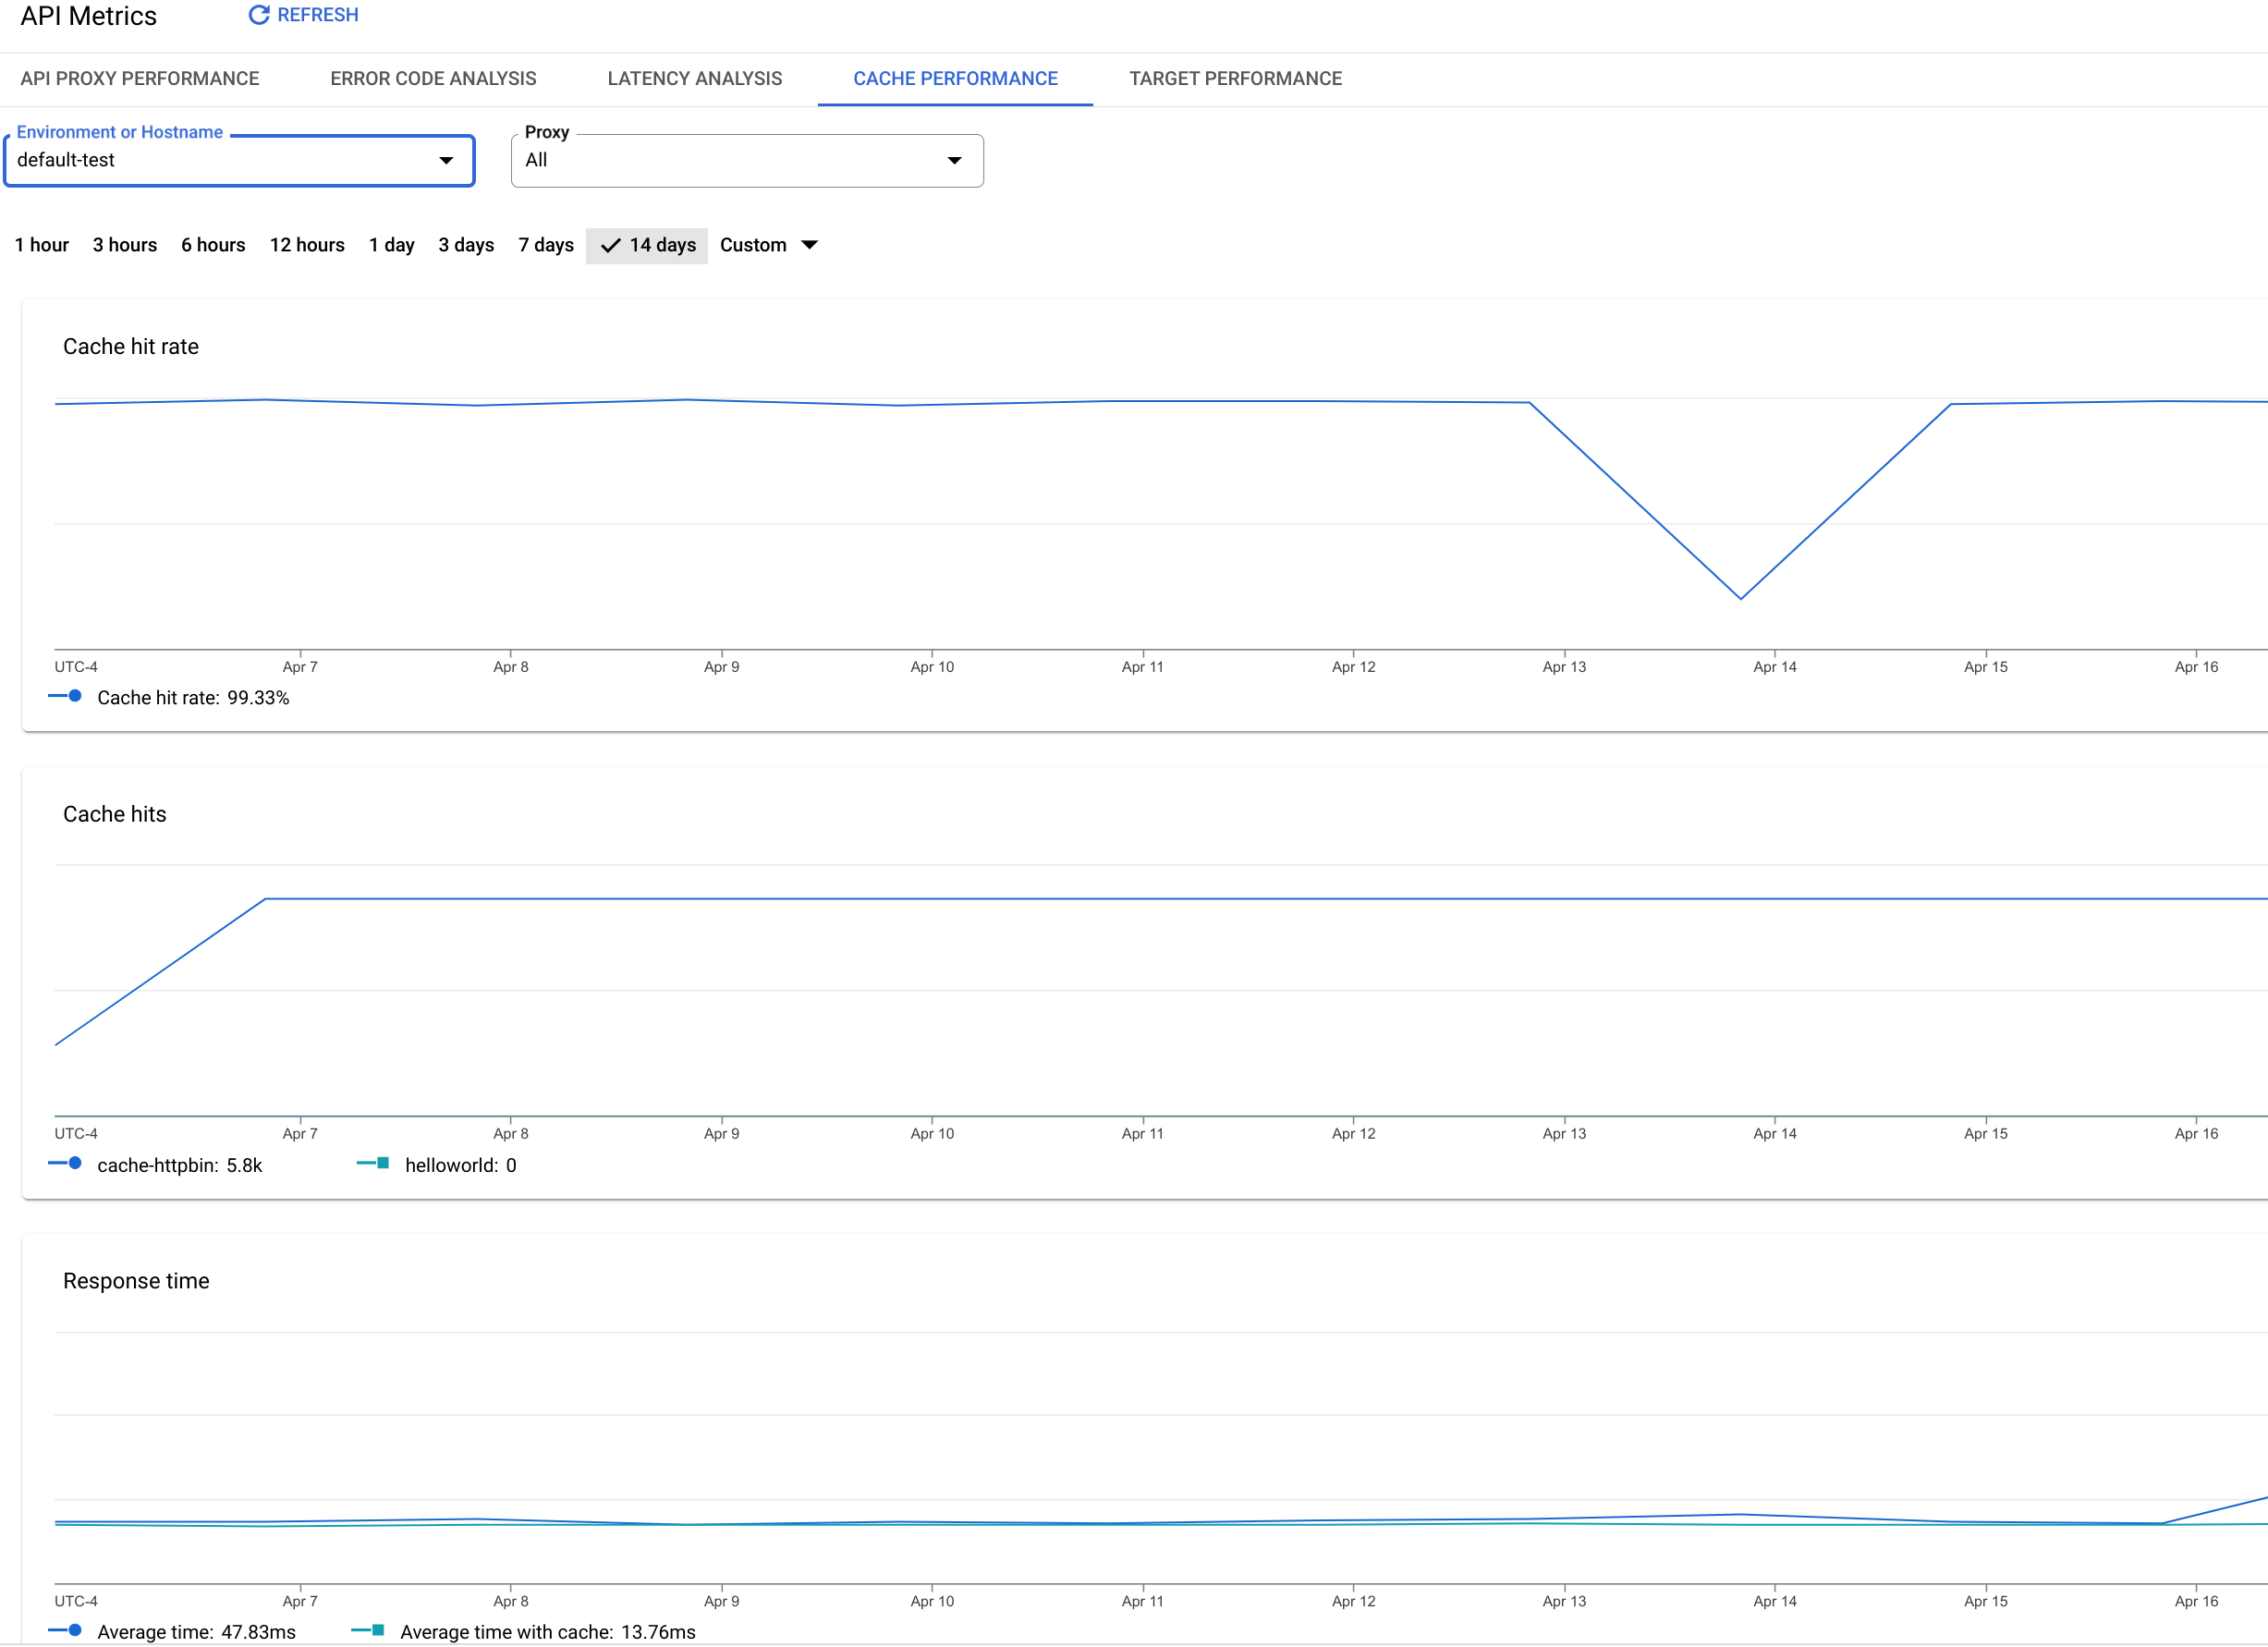
The Cache Performance dashboard
To access the Cache Performance dashboard:
In the Google Cloud console, go to the Analytics > API metrics > Cache Performance page.
[[["Easy to understand","easyToUnderstand","thumb-up"],["Solved my problem","solvedMyProblem","thumb-up"],["Other","otherUp","thumb-up"]],[["Hard to understand","hardToUnderstand","thumb-down"],["Incorrect information or sample code","incorrectInformationOrSampleCode","thumb-down"],["Missing the information/samples I need","missingTheInformationSamplesINeed","thumb-down"],["Other","otherDown","thumb-down"]],["Last updated 2025-09-04 UTC."],[[["\u003cp\u003eThis page focuses on the Cache Performance dashboard within Apigee and Apigee hybrid.\u003c/p\u003e\n"],["\u003cp\u003eThe dashboard visualizes the effectiveness of the ResponseCache policy, but not LookupCache or PopulateCache policies.\u003c/p\u003e\n"],["\u003cp\u003eYou can access the Cache Performance dashboard through the Apigee UI in the Cloud console or the classic Apigee UI.\u003c/p\u003e\n"],["\u003cp\u003eThe dashboard measures metrics like average cache hit rate, cache hits by API proxy, and average time with and without the cache.\u003c/p\u003e\n"],["\u003cp\u003eData in the dashboard may take up to 10 minutes to appear after API calls, and performance ratios may be temporarily inaccurate with new data.\u003c/p\u003e\n"]]],[],null,["# Cache performance dashboard\n\n*This page\napplies to **Apigee** and **Apigee hybrid**.*\n\n\n*View [Apigee Edge](https://docs.apigee.com/api-platform/get-started/what-apigee-edge) documentation.*\n\nWhat does this dashboard tell me?\n---------------------------------\n\nThe Cache Performance dashboard collects data from the\n[ResponseCache policy](/apigee/docs/api-platform/reference/policies/response-cache-policy).\nThis dashboard does not collect data from the [LookupCache](/apigee/docs/api-platform/reference/policies/lookup-cache-policy)\nor [PopulateCache](/apigee/docs/api-platform/reference/policies/populate-cache-policy) policies.\n\nThe Cache Performance dashboard lets you see at a glance the value of the response cache.\nThe dashboard helps you visualize the benefit of the response cache in terms of lower latency and reduced\nload backend servers.\n\n\n| **Note:** **Data delay interval** \n| After API calls are made to proxies, it may take up to **10 minutes** for the data to appear in dashboards, custom reports, and management API calls.\n\n\u003cbr /\u003e\n\nThe Cache Performance dashboard\n-------------------------------\n\nTo access the Cache Performance dashboard:\n\nIn the Google Cloud console, go to the **Analytics \\\u003e API metrics \\\u003e Cache Performance** page.\n\n[Go to Cache Performance](https://console.cloud.google.com/apigee/analytics/cache-performance)\n\n\u003cbr /\u003e\n\nThe **Cache Performance** view is shown:\n\nWhat does this dashboard measure?\n---------------------------------\n\n| **Note:** The performance ratios may appear incorrect for the first few minutes for new data. This is because with a small number of data points, there can be a difference in the number of data points being compared to create the ratios. This inconsistency will resolve itself within a few minutes as it collects more data points. If the performance ratios still appear incorrect, refresh the page."]]