Google Cloud Managed Service for Prometheus charges for the number of samples ingested into Cloud Monitoring and for read requests to the Monitoring API. The number of samples ingested is the primary contributor to your cost.
This document describes how you can control costs associated with metric ingestion and how to identify sources of high-volume ingestion.
For more information about the pricing for Managed Service for Prometheus, see Managed Service for Prometheus pricing summary.
View your bill
To view your Google Cloud bill, do the following:
In the Google Cloud console, go to the Billing page.
If you have more than one billing account, select Go to linked billing account to view the current project's billing account. To locate a different billing account, select Manage billing accounts and choose the account for which you'd like to get usage reports.
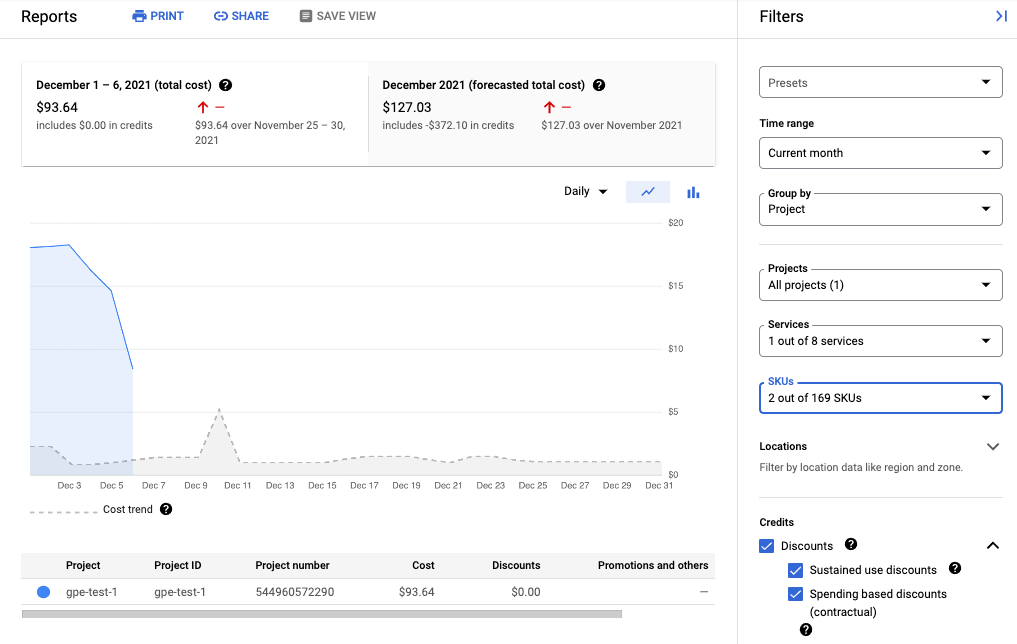
In the Cost management section of the Billing navigation menu, select Reports.
From the Services menu, select the Cloud Monitoring option.
From the SKUs menu, select the following options:
- Prometheus Samples Ingested
- Monitoring API Requests
The following screenshot shows the billing report for Managed Service for Prometheus from one project:
Reduce your costs
To reduce the costs associated with using Managed Service for Prometheus, you can do the following:
- Reduce the number of time series you send to the managed service by filtering the metric data you generate.
- Reduce the number of samples that you collect by changing the scraping interval.
- Limit the number of samples from potentially misconfigured high-cardinality metrics.
Reduce the number of time series
Open source Prometheus documentation rarely recommends filtering metric volume, which is reasonable when costs are bounded by machine costs. But when paying a managed-service provider on a unit basis, sending unlimited data can cause unnecessarily high bills.
The exporters included in the kube-prometheus
project—the kube-state-metrics
service in particular—can emit a lot of metric data.
For example, the kube-state-metrics service emits hundreds of metrics,
many of which might be completely valueless to you as a consumer. A
fresh three-node cluster using the kube-prometheus project sends
approximately 900 samples per second to Managed Service for Prometheus.
Filtering these extraneous metrics might be enough by itself to get your bill
down to an acceptable level.
To reduce the number of metrics, you can do the following:
- Modify your scrape configs to scrape fewer targets.
- Filter the collected metrics as described in the following:
- Filter exported metrics when using managed collection.
- Filter exported metrics when using self-deployed collection.
If you are using the kube-state-metrics service, you could add a
Prometheus relabeling rule with a keep
action. For managed collection, this rule goes in your PodMonitoring or
ClusterPodMonitoring definition. For
self-deployed collection, this rule goes in your Prometheus scrape
config or your
ServiceMonitor definition (for
prometheus-operator).
For example, using the following filter on a fresh three-node cluster reduces your sample volume by approximately 125 samples per second:
  metricRelabeling:
  - action: keep
    regex: kube_(daemonset|deployment|pod|namespace|node|statefulset|persistentvolume|horizontalpodautoscaler)_.+
    sourceLabels: [__name__]
The previous filter uses a regular expression to specify which metrics to keep
based on the name of the metric. For example, metrics whose name begins with
kube_daemonset_ are kept.
You can also specify an action of drop, which filters out the metrics
that match the regular expression.
Sometimes, you might find an entire exporter to be unimportant. For example,
the kube-prometheus package installs the following service monitors by
default, many of which are unnecessary in a managed environment:
alertmanagercorednsgrafanakube-apiserverkube-controller-managerkube-schedulerkube-state-metricskubeletnode-exporterprometheusprometheus-adapterprometheus-operator
To reduce the number of metrics that you export, you can delete, disable, or
stop scraping the service monitors you don't need. For example, disabling
the kube-apiserver service monitor on a fresh three-node cluster reduces
your sample volume by approximately 200 samples per second.
Reduce the number of samples collected
Managed Service for Prometheus charges on a per-sample basis. You can reduce the number of samples ingested by increasing the length of the sampling period. For example:
- Changing a 10-second sampling period to a 30-second sampling period can reduce your sample volume by 66%, without much loss of information.
- Changing a 10-second sampling period to a 60-second sampling period can reduce your sample volume by 83%.
For information about how samples are counted and how the sampling period affects the number of samples, see Pricing examples based on samples ingested.
You can usually set the scraping interval on a per-job or a per-target basis.
For managed collection, you set the scrape interval in the
PodMonitoring resource by using the interval field.
For self-deployed collection, you set the sampling interval in your scrape
configs, usually
by setting an interval or scrape_interval field.
Configure local aggregation (self-deployed collection only)
If you are configuring the service by using self-deployed collection,
for example with kube-prometheus, prometheus-operator, or by manually
deploying the image, then you can reduce your samples sent to Managed Service for Prometheus
by aggregating high-cardinality metrics locally. You can
use recording rules to aggregate away labels such as instance and use the
--export.match flag or the EXTRA_ARGS environment
variable to only send aggregated data to
Monarch.
For example, assume you have three metrics, high_cardinality_metric_1, high_cardinality_metric_2,
and low_cardinality_metric. You want to reduce the samples sent for
high_cardinality_metric_1 and eliminate all samples sent for
high_cardinality_metric_2, while keeping all raw data stored locally (perhaps
for alerting purposes). Your setup might look something like this:
- Deploy the Managed Service for Prometheus image.
- Configure your scrape configs to scrape all raw data into the local server (using as few filters as desired).
Configure your recording rules to run local aggregations over
high_cardinality_metric_1andhigh_cardinality_metric_2, perhaps by aggregating away theinstancelabel or any number of metric labels, depending on what provides the best reduction in the number of unneeded time series. You might run a rule that looks like the following, which drops theinstancelabel and sums the resulting time series over the remaining labels:record: job:high_cardinality_metric_1:sum expr: sum without (instance) (high_cardinality_metric_1)
See aggregation operators in the Prometheus documentation for more aggregation options.
Deploy the Managed Service for Prometheus image with the following filter flag, which prevents raw data from the listed metrics from being sent to Monarch:
--export.match='{__name__!="high_cardinality_metric_1",__name__!="high_cardinality_metric_2"}'This example
export.matchflag uses comma-separated selectors with the!=operator to filter out unwanted raw data. If you add additional recording rules to aggregate other high-cardinality metrics, then you also have to add a new__name__selector to the filter so that the raw data is discarded. By using a single flag containing multiple selectors with the!=operator to filter out unwanted data, you only need to modify the filter when you create a new aggregation instead of whenever you modify or add a scrape config.Certain deployment methods, such as prometheus-operator, might require you to omit the single quotes surrounding the brackets.
This workflow might incur some operational overhead in creating and managing
recording rules and export.match flags, but it's likely that you can cut a lot
of volume by focusing only on metrics with exceptionally high cardinality. For
information about identifying which metrics might benefit the most from local
pre-aggregation, see Identify high-volume metrics.
Do not implement federation when using Managed Service for Prometheus. This workflow makes using federation servers obsolete, as a single self-deployed Prometheus server can perform any cluster-level aggregations you might need. Federation may cause unexpected effects such as "unknown"-typed metrics and doubled ingestion volume.
Limit samples from high-cardinality metrics (self-deployed collection only)
You can create extremely high-cardinality metrics by adding labels that have
a large number of potential values, like a user ID or IP address. Such
metrics can generate a very large number of samples. Using labels
with a large number of values is typically a misconfiguration. You can
guard against high-cardinality metrics in your self-deployed collectors
by setting a sample_limit value
in your scrape configs.
If you use this limit, we recommend that you set it to a very high value, so that it only catches obviously misconfigured metrics. Any samples over the limit are dropped, and it can be very hard to diagnose issues caused by exceeding the limit.
Using a sample limit is not a good way to manage sample ingestion, but
the limit can protect you against accidental misconfiguration. For more
information, see
Using sample_limit to avoid overload.
Identify and attribute costs
You can use Cloud Monitoring to identify the Prometheus metrics that are writing the largest numbers of samples. These metrics are contributing the most to your costs. After you identify the most expensive metrics, you can modify your scrape configs to filter these metrics appropriately.
The Cloud Monitoring Metrics Management page provides information that can help you control the amount you spend on chargeable metrics without affecting observability. The Metrics Management page reports the following information:
- Ingestion volumes for both byte- and sample-based billing, across metric domains and for individual metrics.
- Data about labels and cardinality of metrics.
- Use of metrics in alerting policies and custom dashboards.
- Rate of metric-write errors.
To view the Metrics Management page, do the following:
-
In the navigation panel of the Google Cloud console, select Monitoring, and then select Metrics management:
- In the toolbar, select your time window. By default, the Metrics Management page displays information about the metrics collected in the previous one day.
For more information about the Metrics Management page, see View and manage metric usage.
The following sections describe ways to analyze the number of samples that you are sending to Managed Service for Prometheus and attribute high volume to specific metrics, Kubernetes namespaces, and Google Cloud regions.
Identify high-volume metrics
To identify the Prometheus metrics with the largest ingestion volumes, do the following:
-
In the navigation panel of the Google Cloud console, select Monitoring, and then select Metrics management:
- On the Billable samples ingested scorecard, click View charts.
- Locate the Namespace Volume Ingestion chart, and then click more_vert More chart options.
- Select the chart option View in Metrics Explorer.
- In the Builder pane of Metrics Explorer, modify the fields
as follows:
- In the Metric field, verify that the following resource and
and metric are selected:
Metric Ingestion AttributionandSamples written by attribution id. - For the Aggregation
field, select
sum. - For the by field, select
the following labels:
attribution_dimensionmetric_type
- For the Filter field, use
attribution_dimension = namespace. You must do this after aggregating by theattribution_dimensionlabel.
The resulting chart shows the ingestion volumes for each metric type.
- In the Metric field, verify that the following resource and
and metric are selected:
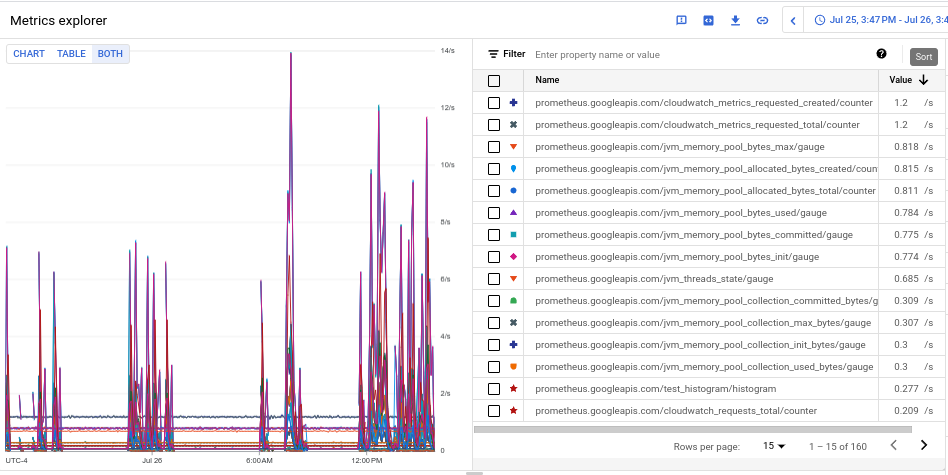
- To see the ingestion volume for each of the metrics, in the toggle labeled Chart Table Both, select Both. The table shows the ingested volume for each metric in the Value column.
- Click the Value column header twice to sort the metrics by descending ingestion volume.
The resulting chart, which shows your top metrics by volume ranked by
mean, looks like the following screenshot:
Identify high-volume namespaces
To attribute ingestion volume to specific Kubernetes namespaces, do the following:
-
In the navigation panel of the Google Cloud console, select Monitoring, and then select Metrics management:
- On the Billable samples ingested scorecard, click View charts.
- Locate the Namespace Volume Ingestion chart, and then click more_vert More chart options.
- Select the chart option View in Metrics Explorer.
- In the Builder pane in Metrics Explorer, modify the fields
as follows:
- In the Metric field, verify that the following resource and
and metric are selected:
Metric Ingestion AttributionandSamples written by attribution id. - Configure the rest of the query parameters as appropriate:
- To correlate overall ingestion volume with namespaces:
- For the Aggregation
field, select
sum. - For the by field, select the
following labels:
attribution_dimensionattribution_id
- For the Filter field, use
attribution_dimension = namespace.
- For the Aggregation
field, select
- To correlate ingestion volume of individual metrics with
namespaces:
- For the Aggregation
field, select
sum. - For the by field, select
the following labels:
attribution_dimensionattribution_idmetric_type
- For the Filter field, use
attribution_dimension = namespace.
- For the Aggregation
field, select
- To identify the namespaces responsible for a specific
high-volume metric:
- Identify the metric type for the high-volume metric by
using one of the other examples to identify high-volume
metric types. The metric type is the string in the table
view that begins with
prometheus.googleapis.com/. For more information, see Identify high-volume metrics. - Restrict the chart data to the identified metric type by
adding a filter for the metric type in the Filter
field. For example:
metric_type=
                   prometheus.googleapis.com/container_tasks_state/gauge
. - For the Aggregation
field, select
sum.
- Identify the metric type for the high-volume metric by
using one of the other examples to identify high-volume
metric types. The metric type is the string in the table
view that begins with
- For the by field, select
the following labels:
attribution_dimensionattribution_id
- For the Filter field, use
attribution_dimension = namespace.
- To correlate overall ingestion volume with namespaces:
- In the Metric field, verify that the following resource and
and metric are selected:
- To see ingestion by Google Cloud region, add the
locationlabel to the by field. - To see ingestion by Google Cloud project, add the
resource_containerlabel to the by field.