Stretching Elastic’s capabilities with historical analysis, backups, and cross-cloud monitoring on Google Cloud Platform
Vincent Roseberry
Software Engineer and Cloud Partner Engineering
Joseph Lewis III
Software Engineer and Cloud Partner Engineering

Elastic provides essential enterprise search services within companies to improve employee productivity, and to reduce barriers to collaboration. So I’m happy to report that Elastic Cloud on GCP is an offering built through a partnership between Google and Elastic that lets you deploy and manage a secure cluster running on Google infrastructure with the latest version of Elasticsearch and Kibana. Elastic Cloud is a great way to take full advantage of one-click upgrades, auto-snapshotting every 30 minutes, and out-of-the-box monitoring and metrics. It also includes the X-Pack feature set, for security, monitoring, machine learning, and reporting.
Although Elastic Cloud on GCP is an excellent option for running Elastic, Google also strives to meet customers where they are today. In today’s blog post, we will showcase three use cases for integrating Google Cloud with Elastic that could be useful if you’re currently managing your own Elastic stack in Compute Engine, on-premise, or even in another cloud provider. These integrations can also serve as a useful starting point when you are ready to migrate from managing your own Elastic instances to Elastic Cloud on GCP.
We’ll highlight three main integration points:
- Historical analysis
- Snapshot and restore
- Cross-cloud monitoring
Historical analysis: BigQuery output plugin for Logstash
Our first use case is how to run historical analysis on any amount of log data using either standard SQL, or even point-and click-tools that leverage BigQuery integrations. In order to do this, we will integrate Logstash log events with BigQuery.Historical analysis of logs can provide insight on activities ranging from detecting security threats to finding the lifetime value (LTV) of a customer. Kibana has already demonstrated to the Elastic community the value of this type of log analysis, and as a result, it has become an essential tool for many users of Elasticsearch. The addition of upcoming features such as SQL Access, a planned addition to X-Pack, also has the ability to analyze historical logs stored in Elasticsearch.
However, for a full Enterprise Data Warehouse (EDW) user experience managed by Google, you might think of BigQuery as a valuable complement to the Elastic stack. BigQuery can provide data analysts and business intelligence developers the ability to write and run standard SQL against petabytes of log data. You can also deploy your own BigQuery integrations with existing tools such as Tableau, Looker, Chartio, and Google Data Studio, to name a few. In addition to ease of use, BigQuery can join with many other datasets that you wouldn’t typically store in an Elasticsearch cluster. For example, BigQuery offers both Public Datasets and Commercial Datasets, which when joined with your existing data, might reveal valuable correlations with external factors. These data sources can be used in place without having to store or move any data.
BigQuery Data Transfer Service also simplifies the process of augmenting your Logstash log events with your own application data stored in Google applications. BigQuery Data Transfer Service can automate the extraction of sources like Adwords, DoubleClick Campaign Manager, DoubleClick for Publishers, and YouTube.
With all of this data and tooling in place, the Google_bigquery output plugin can combine your Logstash event data with BigQuery to create a valuable Enterprise Data Warehouse (EDW) without the level of effort normally required when building an EDW.
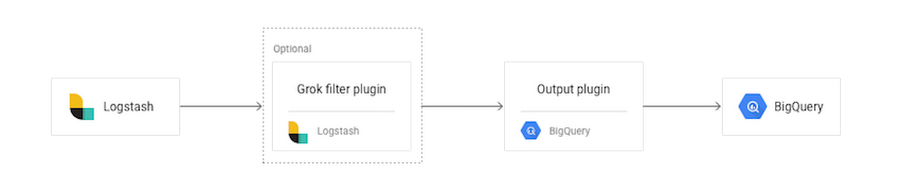
From only an initial glance at this architecture, it may seem to require multiple steps, but the left three boxes, inputs, filters, and outputs all run in a single Logstash JVM (Java Virtual Machine), so the setup is more straightforward than the diagram might indicate. To remove this complexity, let’s take a deeper look.
Essentially, the plugin will upload log events to BigQuery, rolling files based on the date pattern provided in a configuration setting. The log events get written to files locally and, once the file is closed, the plugin uploads it to the configured BigQuery datasets using the BigQuery jobs API.
A grok filter plugin is the tool we recommend to help make sure your events get parsed into fields that can be easily queried from BigQuery. You must configure your plugin so it sends events with the same structure. The BigQuery schema typically meets this need. In addition to the `grok` filter, there are alternatives to achieving the same data structures such as the dissect filter plugin, which may be more performant for certain use cases.
If you do require log events with different structures, you can separate different log events with Logstash conditionals and utilize multiple configuration blocks.
A major benefit of this plugin is that once it is setup and configured, a complex or nightly ETL is not required for integrating log data into your BigQuery data warehouse. The logs effectively become “streaming” depending on which input mechanism is leveraged. You can easily analyze all of the logs using familiar business intelligence tools and combine the log analysis with the wealth of BigQuery data sources available to deepen your analysis.
BigQuery pricing also makes Google_bigquery_output_plugin a great option for storing historical or “cold” logs that you may want to keep but may not be worth the compute cost of keeping on a running Elasticsearch cluster. Since BigQuery separates storage costs from query cost, you could use Google_bigquery_output_plugin as a means to store historical log events at $.01 per GB, per month, and not pay for any query costs until you are ready to actually perform a historical analysis on the data.
For more on the Google_bigquery_output_plugin, please see the Elastic docs on the topic.
You can also make this feed bi-directional and bring the results of your analysis back into Elasticsearch with the Logstash JDBC input plugin.
Snapshot and restore via the Google Cloud Storage repository plugin
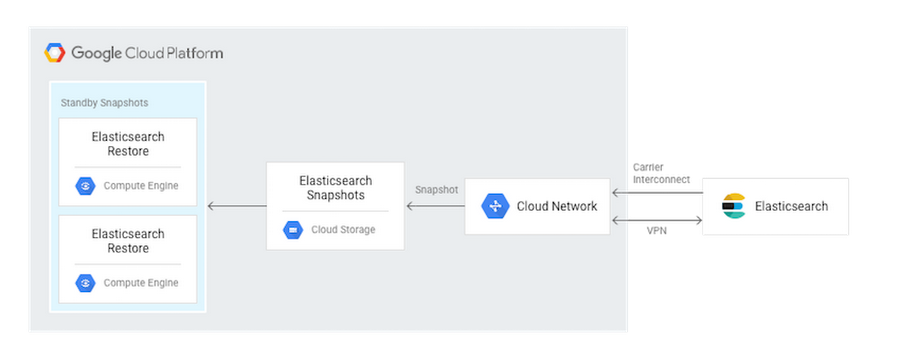
The next use case we’ll discuss is the ability to take advantage of Cloud Storage for taking snapshots and restoring your Elasticsearch clusters.Cloud Storage is a unified object storage product that offers several features that are essential for robust backup and recovery operations. A few relevant highlights include:
Multi-regional buckets: If you want to backup your Elastic snapshots not just to the geographically closest Google Cloud Platform region, but also have that snapshot copied and available in another region of the world, you can enable this feature in a single configuration setting.
Object versioning: Cloud Storage allows you to enable object versioning at the bucket level. Once enabled, a history of modifications (overwrite or delete, for example) of objects is kept for all objects in the bucket. You can list archived versions of an object, restore an object to an older state, or permanently delete a version, as needed. Having this level of object version history of a snapshot could be critical if your Elasticsearch cluster were to experience a data corruption issue.
Object lifecycle management: You can define lifecycle management policies to let Cloud Storage automatically implement your retention policies like deleting snapshots older than 365 days or moving snapshots to cold storage after 30 days.
Object change notification: Cloud Storage’s Object Change Notification Feature lets applications get notified of changes to a bucket, such as when a new Elasticsearch snapshot gets uploaded. A simple example of an action that might automatically occur is an application’s receipt of a notification gets notified that a snapshot was taken successfully.
All of this functionality can be utilized simply by using Cloud Storage as a repository for snapshot and restore in Elasticsearch. You can install a plugin for this feature using the plugin manager with onlyin a single command:
sudo bin/elasticsearch-plugin install repository-gcs
The plugin needs to be installed on every node in the cluster, and each node must be restarted after installation. Using this plugin is a great choice for any Elasticsearch cluster running on Google Cloud, and with proper network configuration, it can also be a useful way to provide a highly durable backup for an on-premise installation of Elasticsearch.
In addition, once the snapshot is available in Cloud Storage, you can set up more advanced configurations. One potential architecture pattern is to use the object change notification of Cloud Storage to trigger an auto-restore to an Elasticsearch cluster on Compute Engine. This second cluster could serve as a warm standby or “failover” that is made primary with a DNS change.
If your Elasticsearch cluster implementation is willing to trade RTO (recovery time objective) for cost, you could also manually trigger these recovery actions to occur only in the event of an on-premise outage.
For more on the Cloud Storage Repository Plugin, please see this documentation.
Cross-cloud monitoring: Stackdriver Elasticsearch plugin
Multi-cloud management is a common topic with our Google Cloud customers. The technically savvy customer realizes that having both cost efficiency and the best tools and technology often requires a multi-cloud topology. We have found that customers who have successfully implemented multi-cloud environments get to choose the best-of-breed tools to stay competitive, maintain flexibility, and avoid breaks in business continuity.One way that customers have been able to start consolidating their multi-cloud troubleshooting is through the use of X-Pack Basic’s monitoring features (formerly Marvel). Customers have also extended their multi-cloud logging and monitoring with even more diagnostic features such as tracing and debugging by using Stackdriver alongside their X-Pack monitoring.
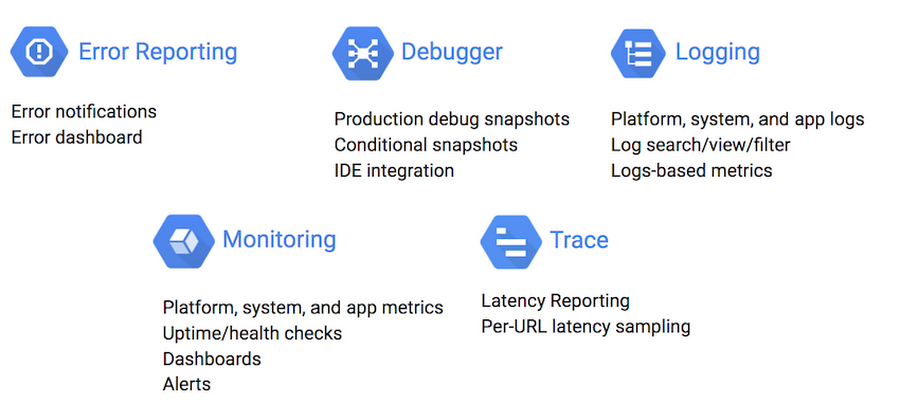
Stackdriver Monitoring provides visibility into the performance, uptime, and overall health of cloud-powered applications. Stackdriver collects metrics, events, and metadata from Google Cloud Platform, Amazon Web Services, and metrics specific to Elasticsearch. Stackdriver comprises features such as Stackdriver Logging, Stackdriver Monitoring, Stackdriver Trace, Stackdriver Error Reporting, and Stackdriver Debug. These diagnostics features are well-integrated with each other. This integration helps you connect and correlate diagnostics data easily. Stackdriver pulls together various monitoring tools and clouds all under one umbrella.
Once you have set up and enabled a Stackdriver account and configured credentials, you start monitoring your Elasticsearch clusters across both AWS and GCP in four steps:
- Download the Stackdriver monitoring agent installation script:
- Run the installation script:
- Download a configuration file for ElasticSearch and put it in proper directory:
- Restart the stackdriver agent:
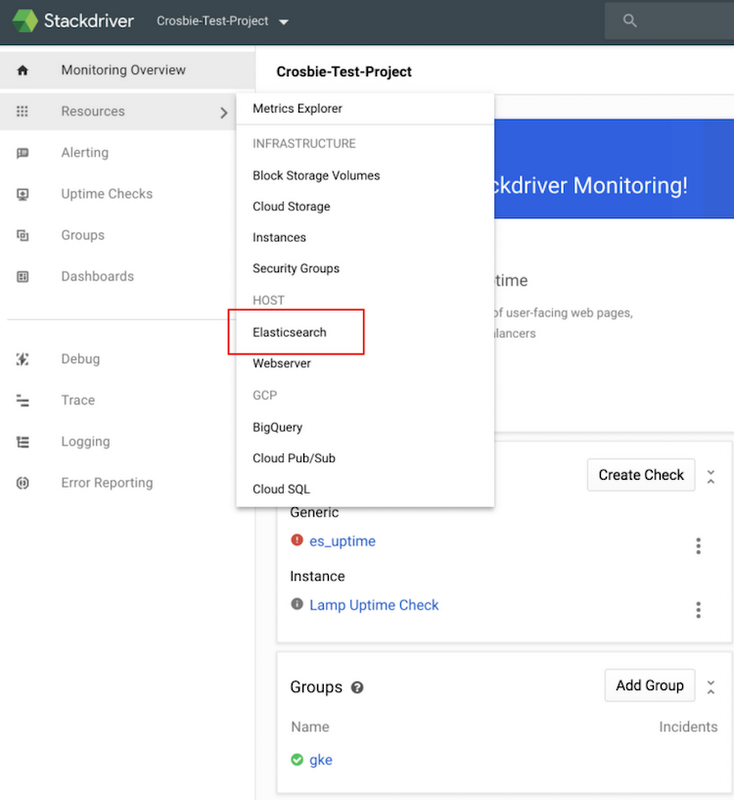
As these steps are applied to each virtual machine in your Elasticsearch clusters, specific Elasticsearch metrics will become available in Stackdriver. Clicking on the Elasticsearch resource from within Stackdriver, as shown in the image below, provides an overview dashboard of all your Elasticsearch clusters across both GCP and AWS.
For further instructions as well as details on what is monitored, please review the Elasticsearch Plugin for Stackdriver monitoring documentation..
This post should serve simply as a jumping-off point for what you can achieve once you consolidate Elasticsearch metrics across clouds in Stackdriver. To learn more about muli-cloud monitoring, please visit the Stackdriver page.